 Open Access Article
The excellent TE performance of photoelectric material CdSe along with a study of Zn(Cd)Se and Zn(Cd)Te based on first-principles†‡
Qi Zhonga,
Zhenhong Dai *a,
Jianye Liua,
Yinchang Zhao
 a and
Sheng Meng
 b
b
aDepartment of Physics, Yantai University, Yantai 264005, People’s Republic of China. E-mail: zhdai@ytu.edu.cn; y.zhao@ytu.edu.cn
bBeijing National Laboratory for Condensed Matter Physics and Institute of Physics, Chinese Academy of Sciences, Beijing, 100190, People’s Republic of China. E-mail: smeng@iphy.ac.cn
First published on 15th August 2019
Abstract
Zn(Cd)Se and Zn(Cd)Te are well known for their excellent photoelectric performance, however, their thermoelectric (TE) properties are usually ignored. By taking advantage of first-principles calculations, the Boltzmann transport equation and semiclassical analysis, we executed a series of thermal and electronic transport investigations on these materials. Our results show that CdSe has the lowest anisotropic thermal conductivity, κL, of the four materials, at 4.70 W m−1 K−1 (c axis) and 3.85 W m−1 K−1 (a axis) at a temperature of 300 K. Inspired by the very low lattice conductivity, other thermoelectric parameters were calculated in the following research. At a temperature of 1200 K we obtained a pretty large power factor, S2σ, of 4.39 × 10⁻³ W m−1 K−2, and based it on the fact that the corresponding figure of merit ZT can reach 1.8 and 1.6 along the a axis and c axis, respectively. We revealed the neglected thermoelectric potential of CdSe by means of systematic studies and demonstrated that it is a promising material with both excellent photoelectric performance and thermoelectric performance.
1. Introduction
With increasing environmental pollution, searching for alternative energy and recovering waste heat more effectively have become urgent problems to be solved. Thermoelectric (TE) materials make it possible to convert heat energy into electric energy with no pollution in this process.1–4 What is used to evaluate thermoelectric materials is the dimensionless figure of merit ZT = S2σT/(κe + κL),5 where S, σ, T, κe and κL are the thermopower (Seebeck coefficient), electrical conductivity, absolute temperature, electrical thermal conductivity and lattice thermal conductivity, respectively. In terms of the formula above, increasing the power factor S2σ and decreasing the lattice thermal conductivity are two measures usually used to improve ZT.1,6–12 Making use of the carrier scattering mechanism,13,14 modulation doping15 and band engineering,11,16,17 the power factor S2σ can be improved effectively. The lattice thermal conductivity κL can be shown as κL = CVνphl/3, where CV, l and νph are the heat capacity, phonon mean free path and phonon group velocity, respectively. By utilizing microstructure defects and nanostructures18–21 the κL can be significantly reduced, for example CaF2, SrF2 and BaF2 crystals, with a fluorite structure (space group Fm![[3 with combining macron]](https://www.rsc.org/images/entities/char_0033_0304.gif) m), acquired a substantially decreased thermal conductivity by doping with rare-earth elements,22–24 and the p-type nanocrystalline bismuth antimony telluride (BiSbTe) bulk material showed a peak ZT of 1.2 at room temperature by the increased phonon scattering by defects and grain boundaries.20 In view of the above, similar methods can be applied to selenide and telluride.
m), acquired a substantially decreased thermal conductivity by doping with rare-earth elements,22–24 and the p-type nanocrystalline bismuth antimony telluride (BiSbTe) bulk material showed a peak ZT of 1.2 at room temperature by the increased phonon scattering by defects and grain boundaries.20 In view of the above, similar methods can be applied to selenide and telluride.
Organic materials, especially polymer materials, have been found to be one of the best potential thermoelectric materials on account of their excellent flexibility, easy production, as well as high power factor,25 but the poor thermal stability and high contact resistance restrict their application in the commercial field.26 Based on the above, the thermoelectric materials applied in practice are mainly inorganic compounds, such as Na-doped PbTe (ZT ∼ 2.0 at 773 K), for which the κL was reduced by adjusting the nanostructure,7 heavily doped PbSe27 (ZT ∼ 2.0 at 1000 K), p-type GBT compounds [GeTe]m[Bi2Te3]n28 (ZT ∼ 1.4 at 300 K), n-type doped SnSe29 (ZT ∼ 2.7 along the a axis) and Cu2Se, for which the ZT values were enhanced by doping with 1 mol% indium and a peak value of 2.6 at 850 K was achieved.30 Additionally, studies by the Ren group and Tritt group20,31 have recently acquired ZT values of 1.5 in nanostructured Bi2Te3 accompanied with a reduced lattice thermal conductivity, enhanced Seebeck coefficient S and enhanced mobility μ.
From the above materials we can see that they all contain Se or Te in the compounds and so in this paper we investigated ZnSe, ZnTe, CdSe and CdTe which have been usually researched for their excellent optical properties,32,33 but their thermoelectric properties were easily neglected. Generally speaking, direct band gap semiconductors are more suitable for photoelectric materials, while indirect band gap semiconductors with a moderate band gap are more likely to be chosen for thermoelectric materials. This is because for indirect band gap semiconductors the conduction band minimum and valence band maximum are located in different positions in κ space, thus they not only require energy absorption but also a change in momentum to complete the transition of electrons. However, the band gap is not the only factor that determines the properties of thermoelectric materials: the electronic band structures, electronic effective mass, Debye temperature ΘD, phonon group velocities and scattering rate also play a role. In this paper, we carried out first-principles calculations and systematically studied the electronic and thermal transport properties of those materials and surprisingly found that all of them have relatively low lattice thermal conductivity, especially CdSe. In view of this, we calculated the power factor, electronic thermal conductivity and figure of merit ZT of CdSe and obtained a glorious result, which confirms that CdSe not only performs well in the field of photoelectricity, but also shows superior performance in thermoelectric devices. In Sec. 2, we introduce the calculation methods and some details. In Sec. 3, the calculated data and some figures are shown. Sec. 4 is the summery of our work.
2. Methodology
The lattice thermal conductivity κL is an important parameter in the process of investigating thermal transport properties, which can be obtained from the phonon Boltzmann transport equation (BTE) and the interatomic force constant (IFC), and along the α axis κL is defined as:
 | (1) |
| Fqνα = τphqν(υqνα + Δqν) | (2) |
 | (3) |
 | (4) |
 | (5) |
In the course of calculating the ZT values, lattice thermal transport and electronic transport are two parts that we should focus on. For the lattice thermal transport study, κL was calculated by the SHENGBTE code36 with a 15 × 15 × 15 q-mesh taken from the BZ. Using a 3 × 3 × 3 supercell, the IFC2 and IFC3 are computed with a combination of the VASP package,37,38 PHONOPY program39 and THIRDORDER.PY script.36 For optimizing the initial cell, take 9 × 9 × 9 Γ-centered Monkhorst–Pack k-mesh from the BZ and the ion (electronic) convergence criterion is 10−6 eV (10−8 eV), the interactions between ion cores and valence electrons are modeled by the projector augmented wave potentials (PAW)40 and a plane wave basis set with a cutoff energy of 500 eV is used. The generalized gradient approximation (GGA) of Perdew–Burke–Ernzerhof (PBE) was applied in the exchange-correlation functional.41 In terms of electronic transport, using the semiclassical Boltzmann theory, rigid-band method and constant scattering time approximation, κe, σ and S can be obtained using the BOLTZTRAP code.42 Additionally, for the purpose of acquiring Kohn–Sham eigenvalues derivatives, a 55 × 55 × 55 k-mesh of BZ is used in the process of optimizing the electronic structure. In the process of DFT calculations, the lattice constant a (c) is for the ground-state systems, which eliminated the effect of thermal expansion (TE) caused by the lattice vibrations (effect of crystal volume change on phonon frequency), however, the TE effect in heavy materials is fairly weak43 and the materials we study all have large atomic masses similarly to the thermoelectric studies of HgS,35 SnGe,44 CoSb3 and IrSb3,45 all of which neglected the TE effect. Additionally, ZnSe, CdSe, ZnTe and CdTe are not layered materials in view of their crystal structures (shown in Fig. 1) so we don’t use the vdW corrections.
3. Results and discussion
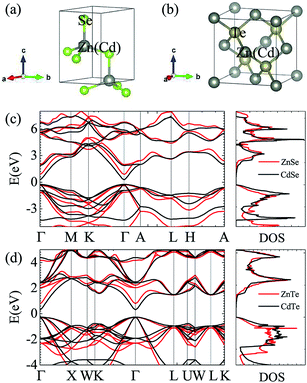
Fig. 1 and Table 1 show the crystal and electronic band structures and calculated parameters of ZnSe, CdSe, ZnTe and CdTe, respectively. Fig. 1(a) and (b) are the crystal structures of these materials, and Zn(Cd)Se and Zn(Cd)Te belong to the hexagonal and cubic crystal systems with an anisotropic and isotropic lattice structure, respectively, which influences the electronic structure and transport properties. The primitive cell of ZnSe (CdSe) is composed of two Zn (Cd) atoms and two Se atoms, and in the case of the ZnTe (CdTe) primitive cell, it is constituted by four Zn (Cd) atoms and four Te atoms. The space group and computed equilibrium lattice constant and band gap are consistent with previous work46–51 and are shown in Table 1. We also calculated the electronic band structures using the GW approximation, which is consistent with previous research:52 the scissors shift of EGW − EDFT has no effect on the thermal transport properties of these materials. From Fig. 1(c) and (d), we can see that all of the four materials are direct band gap semiconductors, with the band gap of ZnSe (ZnTe) generally larger than that of CdSe (CdTe). The local band effective mass is closely related to the band shape, which is defined as:
 | (6) |
For the sake of performing a comprehensive research on the phonon transport properties, the phonon dispersion and phonon density of states (PDOS) are demonstrated in Fig. 2. There are four and eight atoms in the primitive cell of Zn(Cd)Se and Zn(Cd)Te, respectively, so 12 or 24 phonon branches exist in the corresponding picture. Classically, low-frequency phonon modes are primarily derived from the larger atomic mass which is opposite to the situation of high-frequency branches, however, the cases of ZnSe (a) and CdTe (d) are contrary to this rule: the vibrations of heavier atoms (Se or Te) offered the high-frequency phonon modes, and the low-frequency branches are afforded by the lighter atoms (Zn or Cd). We can see that in (b) and (c) the optical modes are split into two parts, which causes a vacancy around the frequency of 4 THz. This phenomenon can also be reflected in the PDOS with the corresponding value equalling zero for CdSe (ZnTe) and the optical modes with frequencies above and below 4 THz have six and three (fifteen and six) branches, respectively. The Debye temperature ΘD is a significant parameter in terms of thermal transport – at a given temperature a lower ΘD may cause enhanced phonon scattering so that the lattice conductivity is reduced,54–56 and this is defined as:
 | (7) |
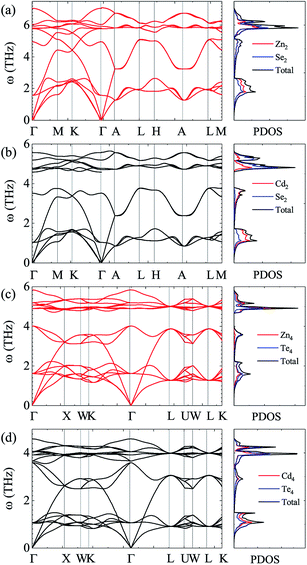 | ||
| Fig. 2 Calculated phonon dispersion and partial phonon density of states (PDOS) along various high-symmetry paths in the first Brillouin zone of ZnSe (a), CdSe (b), ZnTe (c) and CdTe (d). | ||
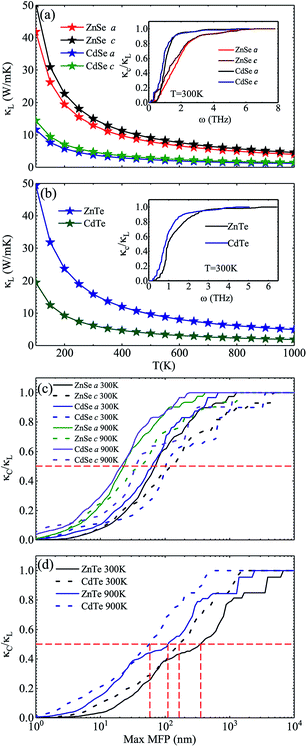
Fig. 3 shows the calculated lattice thermal conductivity κL and the normalized κL vs. the phonon maximum mean-free path (MFP) at different temperatures for ZnSe, CdSe, ZnTe and CdTe. Because ZnSe and CdSe are anisotropic, Fig. 3(a) and (c) reveal the data along the a axis and c axis. Comparing (a) with (b), we find that CdSe and CdTe have lower lattice conductivities, consistent with the above guess. To cite an instance, at the temperature of 300 K, the κL values of ZnSe a axis (c axis), CdSe a axis (c axis), ZnTe and CdTe are 12.92 W m−1 K−1 (14.99 W m−1 K−1), 3.85 W m−1 K−1 (4.70 W m−1 K−1), 15.86 W m−1 K−1 and 6.14 W m−1 K−1, respectively. All of them are much smaller than the κL of graphene (64.80 W m−1 K−1)59 and silicene (27.7 W m−1 K−1),60 and some are also lower than CoSb3 (11.5 W m−1 K−1)61 and SnSi (10.1 W m−1 K−1)44 at the same temperature, especially for CdSe, for which the κL along the a axis is little smaller than that of SnGe (κL ∼ 4.7 W m−1 K−1 at 300 K, and the ZT value reaches 1.64 at 450 K44), so it is truly rewarding to further research the thermoelectric properties of it. For the anisotropic material ZnSe (CdSe), the κL along the a axis is approximately 17.30% ∼ 13.20% (19.82% ∼ 17.94%) lower than that along c axis when the temperature is altered from 100 K to 1000 K, which reflects a moderate anisotropy of the thermal transport properties of ZnSe and CdSe. In Fig. 3(a) and (b), the insets illustrate the relationship between the normalized κL and frequency, and it can be summarized that 65% (70%), 95% (94%), 85% and 92% of the κL of ZnSe a axis (c axis), CdSe a axis (c axis), ZnTe and CdTe, respectively, are provided by the phonon modes with frequencies below 2 THz, where the acoustic modes are located, which means that the acoustic phonons play a dominant role in the process of thermal transport. Fig. 3(c) and (d) reveal the size dependent κL – with an increase in temperature the MFP values of all the materials are shortened, which reflects the intensification of phonon activity. At room temperature, when the normalized κL reaches 50%, the corresponding phonon MFPs are 72 nm (126 nm), 65 nm (104 nm), 349 nm and 166 nm for ZnSe a axis (c axis), CdSe a axis (c axis), ZnTe and CdTe, respectively. Combined with these figures, we can see that CdSe has the shortest MFPs, and in addition, for anisotropic ZnSe and CdSe, compared with the a axis the c axis has a slightly longer phonon MPF despite the temperature increase. Along with this, the thermal conductivity of chalcogenides can be controlled by the thermally active phonon modes which are affected by defects, as demonstrated in the instance of Ga doped Cu2Te, in which within the limits of Ga doping the doping has a great influence on the thermal conductivity: a decreased thermal conductivity κ can be acquired in Cu2−xTe in which intrinsic vacancies were substituted by shallow type dopants of Ga3+. However, if going beyond the doping limits, an increased thermal conductivity can be caused on account of the increased number of thermally active phonon modes in disordered species (CuGaTe2).62
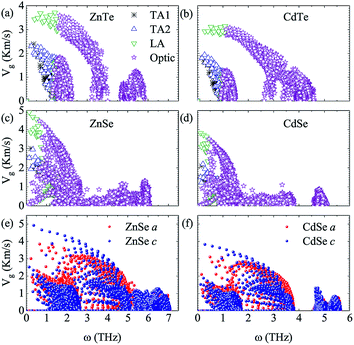
To further explore the essence of thermal transport, the phonon group velocities of different phonon modes, and the relevant values along the a axis and c axis of anisotropic ZnSe and CdSe are shown in Fig. 4. Compared to ZnSe and ZnTe, CdSe and CdTe have the smaller values on the whole, which is consistent with the lower κL value of them. In terms of the specific data the largest group velocities of the four materials, all located in the LA modes, are 3.71 Km s−1, 3.14 Km s−1, 4.91 Km s−1 and 3.82 Km s−1 for ZnTe, CdTe, ZnSe and CdSe, respectively. Considering isotropic ZnTe and CdTe, the group velocities of the acoustic and optical modes show an obvious separation at a frequency around 1 THz, however, a similar phenomenon is not distinct for ZnSe and CdSe, which means that the optical phonons are also involved in the low-frequency thermal transport. The lattice conductivity along the a axis is slightly lower than that along the c axis for ZnSe and CdSe with regard to Fig. 3, and this point can also be reflected in Fig. 4(e) and (f). Even though the phonon group velocity along the a axis is smaller than that along the c axis, due to the fact that the differences between them are tiny, the anisotropy of both materials are not obvious.
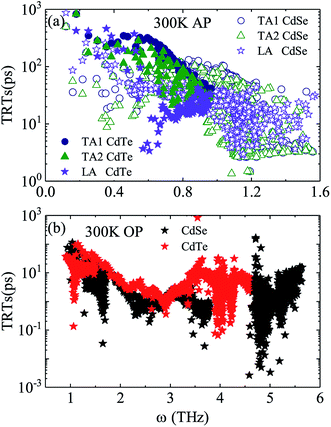
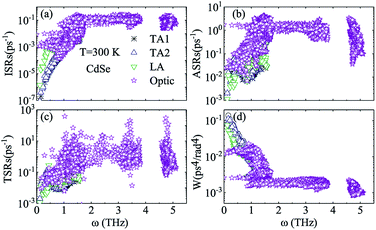
Judging from the results of the above research, CdSe and CdTe show better thermoelectric properties among the four materials. In order to further reveal the differences between them in thermoelectric performance, the total relaxation time at a temperature of 300 K of acoustic phonons and optical phonons as a function of frequency are shown in Fig. 5(a) and (b), respectively. The acoustic modes of CdTe are mainly concentrated below 1 THz, while CdSe occupies a wider frequency range and has more acoustic modes with relaxation times more than 10 ps, since the acoustic modes account for only a small fraction of all phonon modes, the conclusions should be drawn from the more convincing Fig. 5(b). The optical modes of CdTe are distributed above those of CdSe over the whole frequency range, which means that the CdTe has a longer relaxation time in the gross and further explains the larger thermal conductivity of it at 300 K. In the following studies, to further explore the physical mechanism involved in thermal transport, the isotopic scattering rates (ISRs), anharmonic three-phonon scattering rates (ASRs), total scattering rates (TSRs) and weighted phase space W of acoustic modes and optical modes of CdSe at 300 K are plotted in Fig. 6. The ISRs, ASRs and TSRs are connected by the relaxation time and can be written as:
 | (8) |
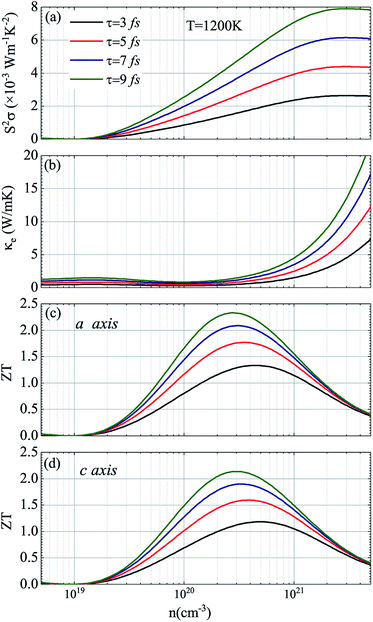
In view of the pretty low lattice conductivity κL of CdSe, it is truly rewarding to investigate the electron transport mechanisms and then calculate the corresponding ZT values (the ZT values of CdTe are not as good as those of CdSe and are shown in S1‡), therefore, the Power factor S2σ, electronic conductivity κe and figure of merit ZT along the a (c) axis of p-type doped CdSe are shown in Fig. 7 (the n-type doped CdSe shows a significantly worse performance, and the relevant ZT values are shown in S2‡) with regard to electronic scattering time τ. We use the formula τ ∼ d/υ to estimate the amplitude of it roughly, where d represents the average electron–electron distance decided by the doping concentration, υ is the electron velocity and can be further written as:  . For the case of CdSe with a doping concentration of n ∼ 1020 cm−3, the electron velocity υ ∼ 6 × 10⁴ m s−1 so that the τ is estimated about 15 fs and can be limited to the range of 1–10 fs by referring to literature12,64,65 and taking the impurity scattering, lattice vibration and other factors into account, in this paper we used 3, 5, 7 and 9 fs for further illustrations. At a temperature of 1200 K, the maximum power factor S2σ is 7.90, 6.14, 4.39 and 2.63 (×10−3 W m−1 K−2) for electronic scattering times of 9 fs, 7 fs, 5 fs and 3 fs, respectively. The change of electronic scattering time has little influence on electronic thermal conductivity κe until the doping concentration increases to 3 × 1020 cm−3, because the lattice thermal conductivity κL along the a axis of CdSe is smaller and under the same doping concentration and electronic scattering time the relevant TE performance is better. With the electronic scattering τ = 9, 7, 5 and 3 fs, the maximum ZT values are 2.3 (n = 2.75 × 1020 cm−3), 2.1 (n = 3.09 × 1020 cm−3), 1.8 (n = 3.46 × 1020 cm−3) and 1.3 (n = 4.32 × 1020 cm−3) for CdSe-a, respectively. In terms of CdSe-c, the values are slightly smaller but still ideal: 2.2 (n = 3.09 × 1020 cm−3), 1.9 (n = 3.46 × 1020 cm−3), 1.6 (n = 4.09 × 1020 cm−3) and 1.2 (n = 4.81 × 1020 cm−3) for τ = 9, 7, 5 and 3 fs, respectively. All of the above ZT values exceed 1, even for the minimum electronic scattering time τ = 3 fs. Using τ = 5 fs as an example, the ZT value of CdSe is also larger than that of many currently commercially utilized materials, such as AgSbTe2 (ZT ∼ 1.6),66,67 Ag9TiTe5 and YbxCo4Sb12 (ZT ∼ 1.2).68,69
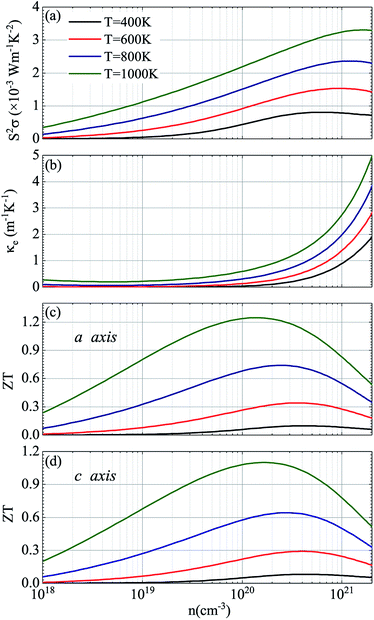
Considering that temperature also plays a critical role in the ZT valus, Fig. 8 shows the corresponding thermoelectric parameters of p-type doped CdSe at different temperatures with the electronic scattering time of 5 fs. It can be seen from the figure that with the increase of temperature, the doping concentration of the maximum power factor obtained has a less obvious increase, and additionally, there is a slightly decrease in the power factor S2σ compared to the temperature of 1200 K with the same electronic scattering time, and the relevant electronic thermal conductivity κe is decreased too. The values of the power factor S2σ are 3.30, 2.36, 1.53 and 0.80 (×10−3 W m−1 K−2) for temperatures of 1000 K, 800 K, 600 K and 400 K, respectively, and the figure of merit ZT along the a axis is 1.25 (n = 1.34 × 1020 cm−3), 0.74 (n = 2.47 × 1020 cm−3), 0.34 (n = 3.55 × 1020 cm−3) and 0.10 (n = 4.19 × 1020 cm−3) for temperatures of 1000 K, 800 K, 600 K and 400 K, respectively. The performance of CdSe-c is not good as that of the former, but a value exceeding 1 (ZT = 1.10) was still obtained at 1000 K with a doping concentration of 1.83 × 1020 cm−3. Compared with those materials that have equivalent ZT values, such as NbFeSb-based p-type half-Heuslers (ZT ∼ 1)69 and Cu2.1Zn0.9SnSe4 (ZT ∼ 0.9),70 CdSe is easy to obtain and more economical and practical, and the anisotropic behavior of it can be achieved experimentally by using the perfect monocrystal. According to Fig. 7 and 8, the final figure of merit ZT is the result of mutual restriction of thermopower S, electrical conductivity σ, temperature T, electronic thermal conductivity κe and lattice thermal conductivity κL. So finding the best combination of them is the key to acquiring the optimal ZT values. Our research suggests that CdSe is not only a prominent photoelectric material, but also has excellent performance in the field of thermoelectricity, and combining these two properties with practical applications will make them a better prospect.
4. Conclusion
In summary, we have investigated the thermal transport properties and electronic structure of anisotropic ZnSe and CdSe and isotropic ZnTe and CdTe by taking advantage of first-principles calculations. Regarding the former the thermoelectric performance along the a axis is relatively better, and CdTe and CdSe have the lower lattice thermal conductivities κL among the four materials, which are 6.14 W m−1 K−1 and 3.85 W m−1 K−1 (a axis) at room temperature, respectively. Inspired by the pretty low lattice thermal conductivity of CdSe, we calculated the power factor S2σ, electronic thermal conductivity κe and finally obtained the figure of merit ZT based on the Boltzmann transport equation. At a temperature of 1200 K, the ZT value of CdSe along the a axis (c axis) is 1.8 (1.6) with the electronic scattering time of 5 fs, and it has better properties than most of the materials currently studied and commercially applied. These direct band gap semiconductors are well known for their excellent photoelectric performance, while the thermoelectric properties are usually ignored, however, our studies reveal more possibilities of them in the area of thermoelectricity, and in order to obtain broader application prospects we will focus on the combination of photoelectric properties and thermoelectric properties in a later investigation.Conflicts of interest
There are no conflicts to declare.Acknowledgements
This research were supported by the National Natural Science Foundation of China under Grant No. 11774396 and No. 11704322, the Shandong Natural Science Funds for Doctoral Program under Grant No. ZR2017BA017, and the National Key Research and Development Program of China under Grant No. 2016YFA0300902.References
- J. P. Heremans, V. Jovovic, E. S. Toberer, A. Saramat, K. Kurosaki, A. Charoenphakdee, S. Yamanaka and G. J. Snyder, Science, 2008, 321, 554 CrossRef CAS PubMed.
- G. J. Snyder and E. S. Toberer, in Materials For Sustainable Energy: A Collection of Peer-Reviewed Research and Review Articles from Nature Publishing Group, World Scientific, 2011, pp. 101–110 Search PubMed.
- L. E. Bell, Science, 2008, 321, 1457 CrossRef CAS PubMed.
- J. P. Heremans, M. S. Dresselhaus, L. E. Bell and D. T. Morelli, Nat. Nanotechnol., 2013, 8, 471 CrossRef CAS PubMed.
- G. Melnyk, E. Bauer, P. Rogl, R. Skolozdra and E. Seidl, J. Alloys Compd., 2000, 296, 235 CrossRef CAS.
- K. Biswas, J. He, I. D. Blum, C.-I. Wu, T. P. Hogan, D. N. Seidman, V. P. Dravid and M. G. Kanatzidis, Nature, 2012, 489, 414 CrossRef CAS PubMed.
- H. Wang, J.-H. Bahk, C. Kang, J. Hwang, K. Kim, J. Kim, P. Burke, J. E. Bowers, A. C. Gossard and A. Shakouri, et al., Proc. Natl. Acad. Sci. U. S. A., 2014, 111, 10949 CrossRef CAS PubMed.
- L. Hicks and M. S. Dresselhaus, Phys. Rev. B: Condens. Matter Mater. Phys., 1993, 47, 12727 CrossRef CAS PubMed.
- Y. Pei, A. LaLonde, S. Iwanaga and G. J. Snyder, Energy Environ. Sci., 2011, 4, 2085 RSC.
- Y. Zhao and Z. Dai, RSC Adv., 2017, 7, 25803 RSC.
- W. Liu, X. Tan, K. Yin, H. Liu, X. Tang, J. Shi, Q. Zhang and C. Uher, Phys. Rev. Lett., 2012, 108, 166601 CrossRef PubMed.
- Y. Zhao, Z. Dai, C. Zhang, C. Lian, S. Zeng, G. Li, S. Meng and J. Ni, Phys. Rev. B, 2017, 95, 014307 CrossRef.
- J. Shuai, J. Mao, S. Song, Q. Zhu, J. Sun, Y. Wang, R. He, J. Zhou, G. Chen and D. J. Singh, et al., Energy Environ. Sci., 2017, 10, 799 RSC.
- J. Mao, Y. Wu, S. Song, Q. Zhu, J. Shuai, Z. Liu, Y. Pei and Z. Ren, ACS Energy Lett., 2017, 2, 2245 CrossRef CAS.
- M. Zebarjadi, G. Joshi, G. Zhu, B. Yu, A. Minnich, Y. Lan, X. Wang, M. Dresselhaus, Z. Ren and G. Chen, Nano Lett., 2011, 11, 2225 CrossRef CAS PubMed.
- Y. Pei, H. Wang and G. J. Snyder, Adv. Mater., 2012, 24, 6125 CrossRef CAS PubMed.
- Y. Pei, X. Shi, A. LaLonde, H. Wang, L. Chen and G. J. Snyder, Nature, 2011, 473, 66 CrossRef CAS PubMed.
- K. F. Hsu, S. Loo, F. Guo, W. Chen, J. S. Dyck, C. Uher, T. Hogan, E. K. Polychroniadis and M. G. Kanatzidis, Science, 2004, 303, 818 CrossRef CAS PubMed.
- K. Biswas, J. He, Q. Zhang, G. Wang, C. Uher, V. P. Dravid and M. G. Kanatzidis, Nat. Chem., 2011, 3, 160 CrossRef CAS PubMed.
- B. Poudel, Q. Hao, Y. Ma, Y. Lan, A. Minnich, B. Yu, X. Yan, D. Wang, A. Muto, D. Vashaee, X. Chen, J. Liu, M. S. Dresselhaus, G. Chen and Z. Ren, Science, 2008, 320, 634 CrossRef CAS PubMed.
- L.-D. Zhao, X. Zhang, H. Wu, G. Tan, Y. Pei, Y. Xiao, C. Chang, D. Wu, H. Chi and L. Zheng, et al., J. Am. Chem. Soc., 2016, 138, 2366 CrossRef CAS PubMed.
- P. Popov, P. Fedorov and V. Konyushkin, Dokl. Phys., 2008, 53, 353 CrossRef CAS.
- P. Popov, P. Fedorov and V. Osiko, Phys. Solid State, 2010, 52, 504 CrossRef CAS.
- P. Popov, P. Fedorov, V. Konyushkin, A. Nakladov, S. Kuznetsov, V. Osiko and T. Basiev, in Doklady Physics, vol. 53, Springer, 2008, pp. 413–415 Search PubMed.
- Q. Zhang, Y. Sun, W. Xu and D. Zhu, Adv. Mater., 2014, 26, 6829 CrossRef CAS PubMed.
- Q. Jin, S. Jiang, Y. Zhao, D. Wang, J. Qiu, D.-M. Tang, J. Tan, D.-M. Sun, P.-X. Hou and X.-Q. Chen, et al., Nat. Mater., 2019, 18, 62 CrossRef CAS PubMed.
- D. Parker and D. J. Singh, Phys. Rev. B: Condens. Matter Mater. Phys., 2010, 82, 035204 CrossRef.
- J. N. Kim, M. Kaviany and J.-H. Shim, Phys. Rev. B, 2016, 93, 075119 CrossRef.
- R. Guo, X. Wang, Y. Kuang and B. Huang, Phys. Rev. B: Condens. Matter Mater. Phys., 2015, 92, 115202 CrossRef.
- A. Olvera, N. Moroz, P. Sahoo, P. Ren, T. Bailey, A. Page, C. Uher and P. Poudeu, Energy Environ. Sci., 2017, 10, 1668 RSC.
- W. Xie, X. Tang, Y. Yan, Q. Zhang and T. M. Tritt, Appl. Phys. Lett., 2009, 94, 102111 CrossRef.
- P. Reiss, J. Bleuse and A. Pron, Nano Lett., 2002, 2, 781 CrossRef CAS.
- M. Gao, S. Kirstein, H. Möhwald, A. L. Rogach, A. Kornowski, A. Eychmüller and H. Weller, J. Phys. Chem. B, 1998, 102, 8360 CrossRef CAS.
- B. Liao, J. Zhou, B. Qiu, M. S. Dresselhaus and G. Chen, Phys. Rev. B: Condens. Matter Mater. Phys., 2015, 91, 235419 CrossRef.
- Y. Zhao, Z. Dai, C. Lian, S. Zeng, G. Li, J. Ni and S. Meng, Phys. Rev. Mater., 2017, 1, 065401 CrossRef.
- W. Li, J. Carrete, N. A. Katcho and N. Mingo, Comput. Phys. Commun., 2014, 185, 1747 CrossRef CAS.
- P. Vogt, P. De Padova, C. Quaresima, J. Avila, E. Frantzeskakis, M. C. Asensio, A. Resta, B. Ealet and G. Le Lay, Phys. Rev. Lett., 2012, 108, 155501 CrossRef PubMed.
- G. Kresse and J. Furthmüller, Phys. Rev. B: Condens. Matter Mater. Phys., 1996, 54, 11169 CrossRef CAS PubMed.
- A. Togo, F. Oba and I. Tanaka, Phys. Rev. B: Condens. Matter Mater. Phys., 2008, 78, 134106 CrossRef.
- G. Kresse and D. Joubert, Phys. Rev. B: Condens. Matter Mater. Phys., 1999, 59, 1758 CrossRef CAS.
- J. P. Perdew, A. Ruzsinszky, G. I. Csonka, O. A. Vydrov, G. E. Scuseria, L. A. Constantin, X. Zhou and K. Burke, Phys. Rev. Lett., 2008, 100, 136406 CrossRef PubMed.
- G. K. Madsen and D. J. Singh, Comput. Phys. Commun., 2006, 175, 67 CrossRef CAS.
- X. Yang, Y. Zhao, Z. Dai, M. Zulfiqar, J. Zhu and J. Ni, Phys. Lett. A, 2017, 381, 3514 CrossRef CAS.
- Y. Ding and Y. Wang, Appl. Surf. Sci., 2017, 396, 1164 CrossRef CAS.
- W. Li and N. Mingo, Phys. Rev. B: Condens. Matter Mater. Phys., 2014, 90, 094302 CrossRef.
- A. Haloui, Y. Feutelais and B. Legendre, J. Alloys Compd., 1997, 260, 179 CrossRef CAS.
- A. Štajn, R. Žikić, B. Ognjanović, Z. Saičić, S. Z. Pavlović, M. Kostić and V. M. Petrović, Comp. Biochem. Physiol., Part C: Pharmacol., Toxicol. Endocrinol., 1997, 117, 167 Search PubMed.
- R. Sharma and Y. Chang, J. Phase Equilib., 1989, 10, 334 CAS.
- R. Sharma and Y. Chang, J. Phase Equilib., 1996, 17, 155 CrossRef CAS.
- C. Okoye, Phys. B, 2003, 337, 1 CrossRef CAS.
- E. Deligoz, K. Colakoglu and Y. Ciftci, Phys. B, 2006, 373, 124 CrossRef CAS.
- O. Zakharov, A. Rubio, X. Blase, M. L. Cohen and S. G. Louie, Phys. Rev. B: Condens. Matter Mater. Phys., 1994, 50, 10780 CrossRef CAS PubMed.
- P. K. Sarswat, S. Sarkar, G. Yi and M. L. Free, J. Phys. Chem. C, 2017, 121, 18263 CrossRef CAS.
- T. Nakashima and Y. Umakoshi, Philos. Mag. Lett., 1992, 66, 317 CrossRef CAS.
- B. Peng, H. Zhang, H. Shao, Y. Xu, X. Zhang and H. Zhu, RSC Adv., 2016, 6, 5767 RSC.
- L. Lindsay, D. Broido and T. Reinecke, Phys. Rev. Lett., 2013, 111, 025901 CrossRef CAS PubMed.
- A. Jain and A. J. McGaughey, Sci. Rep., 2015, 5, 8501 CrossRef CAS PubMed.
- D. K. Efetov and P. Kim, Phys. Rev. Lett., 2010, 105, 256805 CrossRef PubMed.
- B. Mortazavi, O. Rahaman, T. Rabczuk and L. F. C. Pereira, Carbon, 2016, 106, 1 CrossRef CAS.
- B. Peng, H. Zhang, H. Shao, Y. Xu, R. Zhang, H. Lu, D. W. Zhang and H. Zhu, ACS Appl. Mater. Interfaces, 2016, 8, 20977 CrossRef CAS PubMed.
- W. Li and N. Mingo, Phys. Rev. B: Condens. Matter Mater. Phys., 2014, 89, 184304 CrossRef.
- S. Sarkar, P. K. Sarswat, S. Saini, P. Mele and M. L. Free, Sci. Rep., 2019, 9, 8180 CrossRef PubMed.
- W. Li and N. Mingo, Phys. Rev. B: Condens. Matter Mater. Phys., 2015, 91, 144304 CrossRef.
- X. Yang, Z. Dai, Y. Zhao, J. Liu and S. Meng, J. Phys.: Condens. Matter, 2018, 30, 425401 CrossRef PubMed.
- X. Tan, W. Liu, H. Liu, J. Shi, X. Tang and C. Uher, Phys. Rev. B: Condens. Matter Mater. Phys., 2012, 85, 205212 CrossRef.
- H. Wang, J.-F. Li, M. Zou and T. Sui, Appl. Phys. Lett., 2008, 93, 202106 CrossRef.
- D. Morelli, V. Jovovic and J. Heremans, Phys. Rev. Lett., 2008, 101, 035901 CrossRef CAS PubMed.
- K. Kurosaki, A. Kosuga, H. Muta, M. Uno and S. Yamanaka, Appl. Phys. Lett., 2005, 87, 061919 CrossRef.
- G. Joshi, R. He, M. Engber, G. Samsonidze, T. Pantha, E. Dahal, K. Dahal, J. Yang, Y. Lan and B. Kozinsky, et al., Energy Environ. Sci., 2014, 7, 4070 RSC.
- M.-L. Liu, I.-W. Chen, F.-Q. Huang and L.-D. Chen, Adv. Mater., 2009, 21, 3808 CrossRef CAS.
Footnotes |
| † PACS numbers: 65.40.-b, 66.70.-f, 63.20.-e, 72.20.-i. |
| ‡ Electronic supplementary information (ESI) available. See DOI: 10.1039/c9ra04748d |
| This journal is © The Royal Society of Chemistry 2019 |

