 Open Access Article
The β-cyclodextrin-modified nanosized ZSM-5 zeolite as a carrier for curcumin
Shahin
Amani
,
Amir
Bagheri Garmarudi
 *,
Niloofar
Rahmani
and
Mohammadreza
Khanmohammadi
Department of Chemistry, Faculty of Science, Imam Khomeini International University, Qazvin, Iran
First published on 10th October 2019
Abstract
Herein, the nanosized ZSM-5 zeolite was synthesized based on a fractional factorial experimental design by a hydrothermal method to study the optimum conditions for the synthesis and formation of the ZSM-5 zeolite by employing different conditions. The samples were synthesized without any organic template, and different conditions, such as the molar composition of the synthesis gel and reaction time, were applied in a wide range. Then, the samples were analysed by X-ray diffraction to investigate the formation of the zeolite ZSM-5, and the results were compared to obtain the optimum conditions for its synthesis. The obtained samples were characterized by SEM, FTIR spectroscopy and TGA. Then, the functionalization of nano zeolite ZSM-5 crystals with β-cyclodextrin (β-CD) was investigated. The zeolite surface was first functionalized with amino groups using an amino alkoxysilane. Then, toluene diisocyanate was reacted with the amino-terminated ZSM-5 zeolite crystals and used for the incorporation of β-CD via its remaining isocyanate groups. After this, a drug delivery system (DDS) was prepared based on the cyclodextrin-modified zeolite with the curcumin anticancer drug, and its formation was studied under experimental conditions. The results of in vitro studies show that this drug delivery system has better characteristics than free curcumin in terms of stability and anti-proliferative and anti-inflammatory effects.
Introduction
Multifunctional nanocarriers have now become a major part of the bio-nano-medicine research for the purpose of drug delivery;1 a nanocarrier should act as a carrier for the delivery of objects, deliver its load to the specific target, and release its content at the desired moment with protected activity. These nanostructures have to be carefully designed with structural features useful for the identification, distinction, and treatment of cancer cells. Inorganic porous materials, such as various aluminosilicates, are interesting due to their high loading efficiency and ability of bioactive molecule protection.2 Due to their biological properties and stability in biological environments, zeolites have been recently considered for medical applications.3,4 Zeolites are a family of aluminosilicate minerals. The channels and cavities in their structure have well-defined sizes on the nanoscale.5 This feature makes them shape selective i.e. they block large molecules, whereas allow smaller molecules to pass through; all the pores and channels endow the zeolite particles with a very high internal surface area. Another characteristic is the presence of acidic sites; this feature combined with the large internal surface area and shape selectivity makes zeolites important acid catalysts; the basic building blocks of zeolite are the corner sharing tetrahedral [SiO4]4− and [AlO4]4−. Therefore, the pores and channels enable the encapsulation of small molecules. Zeolites have many applications including industrial, environmental, and biotechnological. Furthermore, numerous examples of medical applications of zeolites, such as in the immobilization of enzymes for biological sensing,6 the imaging of magnetic resonance,7–11 the treatment of wounds, and as a drug delivery system (DDS),12–15 have been reported. The most famous zeolite with an MFI structure is ZSM-5. ZSM-5 zeolites are widely used as catalysts, particularly in acid catalytic reactions, due to the special structure and size of their channels, stable structure and wide ranges of the silicon to aluminum ratio; moreover, due to the presence of aluminum, the framework is negatively charged, which endows the zeolite with ion exchange properties; this allows the absorption and release of charged molecules. Modification of zeolites for their compatibility as potential drug carriers improves their performance. A zeolite modified with cyclodextrin can play the role of two hosts for guest molecules. In this study, we fabricated ZSM-5 zeolites for a drug delivery system by a hydrothermal method. The structure, morphology, biocompatibility, and drug delivery properties of the ZSM-5 zeolites were investigated; moreover, we investigated the use of cyclodextrin (CD) host–guest chemistry as a model system for the functionalization of the zeolite surface. In addition, one of the main features of cyclodextrin molecules is the formation of an inclusion complex with guest hydrophobic molecules in their nano-holes. Cyclodextrin has a hydrophilic cavity in the outer part and a hydrophobic cavity in the inner part. These properties are responsible for its solubility in water and ability to encapsulate hydrophobic parts in its cavities; moreover, the binding of “guest” molecules in the inclusion complexes of cyclodextrin in an aqueous environment is the basis for its pharmaceutical applications. However, more studies are needed to understand the basics of the interaction of cyclodextrin-modified zeolite with a drug molecule such that the loading and the release of the drug can be significantly improved. In this study, curcumin was used as a model drug. Curcumin is a polyphenol yellow compound, which has a low molecular weight and is derived from the rhizome of the plant Curcuma longa that has a wide range of biological applications such as in the treatment of cancer; furthermore, curcumin is widely used as an anti-inflammatory, anti-microbial, anti-oxidant, and anti-parasitic drug as well as a drug against the human immunodeficiency virus.16–20 Despite all these wonderful medicinal properties, curcumin has low solubility in aqueous solutions and undergoes rapid degradation at physiological pH; this leads to its poor bioavailability and low medicinal properties that significantly hinder its effectiveness in the body.21,22 In this regard, various formulations have been created based on the encapsulation of curcumin in the nanoparticles or nano gels of polymers, surfactants, proteins, and phospholipids.23–30 These systems not only improve the drug solubility and stability but also provide medicines for cancer cells in their active form. In this study, beta-cyclodextrin has been chosen for the encapsulation of curcumin because it is a semi-natural product with very low toxicity that increases the drug delivery through biological membranes;31 furthermore, ZSM-5 created by the template-free technique has the advantage of a more sustainable synthetic route, which avoids the use of toxic and expensive organic templates and the formation of harmful gases by the calcination of organic templates at high temperatures.32–34 Eventually, in this context, we have reported the preparation of a drug delivery system (DDS) based on the cyclodextrin-modified ZSM-5 zeolite using the curcumin anticancer drug and demonstrated its efficiency against cancer cells (Fig. 1).Experimental
Preparation of nanosized, template-free ZSM-5 zeolite
Template-free ZSM-5 was synthesized from a synthesis solution prepared by dissolving sodium hydroxide (NaOH ≥ 96.0 wt%) and sodium aluminate (NaAlO2) in deionized water. The mixture was thoroughly mixed, and tetraethylorthosilicate (TEOS, ≥99%, Aldrich) was slowly added to the abovementioned solution under stirring at a high speed. Then, the abovementioned synthesis solution was aged for 12 h at room temperature; after this, it was transferred to a Teflon-lined stainless steel autoclave and hydrothermally treated in an oven at 180 °C. After the hydrothermal treatment, the products were thoroughly washed with deionized water until the pH value of the washing water reached 7–8 and then dried at room temperature.Experimental design
Therefore, the primary gel composition was evaluated in this study. The minimum and maximum factors examined herein are reported in the following table.36
The factors were the molar ratios Na2O/SiO2 (X1), SiO2/Al2O3 (X2), and H2O/SiO2 (X3) and aging time (X4). Each factor was set at two different levels, i.e. low and high, which were coded as (−1) and (+1), respectively. Table 2 shows these factors and levels.
| Factors | Parameter values | |
|---|---|---|
| Low level (−1) | High level (+1) | |
| X1: Na2O/SiO2 | 0.12 | 0.2 |
| X2: SiO2/Al2O3 | 20 | 60 |
| X3: H2O/SiO2 | 25 | 53 |
| X4: aging time | 24 | 72 |
| Y = β0 + β1X1 + β2X2 + … + βKXK + β11X12 + … + βKKXK2 + β12X1X2 + β13X1X3 + … + βK−1XK−1XK + ε | (1) |
| Run | X1 | X2 | X3 | X4 | Y (%) |
|---|---|---|---|---|---|
| 1 | 1 | −1 | 1 | −1 | 53.5 |
| 2 | −1 | 1 | 1 | −1 | 51.2 |
| 3 | 1 | −1 | −1 | 1 | 10 |
| 4 | −1 | 1 | 1 | −1 | 51.2 |
| 5 | 1 | 1 | 1 | 1 | 100 |
| 6 | −1 | −1 | −1 | −1 | 31.9 |
| 7 | −1 | −1 | 1 | 1 | 45.6 |
| 8 | 1 | −1 | 1 | −1 | 53.5 |
| 9 | −1 | 1 | −1 | 1 | 66.3 |
| 10 | 1 | 1 | 1 | 1 | 100 |
| 11 | −1 | −1 | 1 | 1 | 45.6 |
| 12 | −1 | −1 | −1 | −1 | 31.9 |
| 13 | −1 | 1 | −1 | 1 | 66.3 |
| 14 | 1 | 1 | −1 | −1 | 41.3 |
| 15 | 1 | 1 | −1 | −1 | 41.3 |
| 16 | 1 | −1 | −1 | 1 | 10 |
Finally, the ZSM-5 zeolite crystals modified with beta-cyclodextrin were washed with water and dried at room temperature.40
| % CUR release = (released curcumin/CDZ–CUR inclusion complex) × 100. |
Results and discussion
Characterization of the ZSM-5 zeolite
A series of tests were performed with regard to the fractional factorial design. The response Y varied between 100% and 10%. Higher values of Y were obtained during the Run 5 and 9. Moreover, the Run 5 had the highest yield of zeolite.Analysis of variance
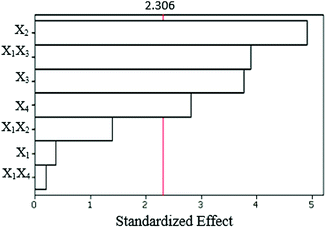
Analysis of variance was used to analyze the effects of experimental factors on the efficiency of ZSM-5. Results of the analysis of variance are shown in Table 4. In this table, the amount of p determines which factors are more effective. If the p value is less than 0.05, the factors are effective. As shown in Table 4, the main effects and two-way interaction terms are important to the process of ZSM-5 synthesis (p < 0.05). Fig. 3 shows the Pareto chart of standardized effects, which demonstrates that all the variables can be important factors. The order of the importance of factors is SiO2/Al2O3 > H2O/SiO2 > aging time ≫ Na2O/SiO2. Interactions between different variables have a significant effect on the zeolite synthesis. The two-way interactions are X1X2, X1X3, and X1X4. The most important two-way interaction variable is X1X3. Note that although X1 has a slight effect on the response, its interaction with X3 is important.| Source | DFa | Seq SSb | Adj SSc | Adj MSd | Fe | Pf |
|---|---|---|---|---|---|---|
| a Degree of freedom. b Sequential sum of squares. c Adjusted sum of squares. d Adjusted mean of squares. e F-Test. f P-Value. | ||||||
| Main effects | 4 | 6453.2 | 5756.7 | 1439.2 | 12.36 | 0.002 |
| 2-Way interactions | 3 | 2219.6 | 2219.6 | 739.9 | 6.36 | 0.016 |
| Residual error | 8 | 931.2 | 931.2 | 116.4 | ||
| Lack of fit | 1 | 931.2 | 931.2 | 931.2 | ||
| Pure error | 7 | 0.0 | 0.0 | 0.0 | ||
| Total | 15 | 9604.1 | ||||
The effect of the main factors
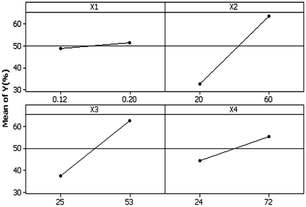
Fig. 4 shows the trends of the main factors. According to this plot, it could be decided which factor at which level would be effective; the mean values shown in the figure were obtained by averaging the responses over all runs. The plot shows that the response Y (relative crystallinity and consequently the efficiency of the formation of zeolite) does not significantly change with an increase in X1 (Na2O/SiO2). However, an increase in the SiO2/Al2O3 molar ratio leads to an increase in ZSM-5 yields.This plot shows that the highest efficiency of zeolite formation is achieved when SiO2/Al2O3 (X2), H2O/SiO2 (X3), and aging time (X4) are at their highest levels.
Estimated regression coefficient for the response Y and model validation
The p values and coefficients of the polynomial model (eqn (1)) are shown in Table 5. According to Table 4, on the basis of the p values, only the main factors and their interactions were effective. As shown in Table 5, the p value for main factors (X2, X3, and X4) is less than 0.05, but the p value for X1 is higher than 0.05. This result is in agreement with the results of the Pareto chart and the table showing the analysis of variance; moreover, X1 is a non-impact factor; thus, it will be removed from the equation, and the squared values of X2, X3, and X4 have p > 0.05. Therefore, they will also be removed from the equation. For the 2-way interactions of X1X3, the p value is less than 0.05, and the p values for X1X2 and X1X4 are higher than 0.05. Thus, the effects of X1X2 and X1X4 on the response are ineffective, and these factors will be removed from the equation. The regression equation is defined as follows:| Y = 47.731 + 13.977X2 + 10.356X3 + 7.744X4 + 10.706X1X3 | (2) |
| Term | Effect | Coef. | SE coef. | T | P |
|---|---|---|---|---|---|
| Constant | 47.731 | 2.749 | 17.37 | 0.000 | |
| X1 | −2.038 | −1.019 | 2.749 | −0.37 | 0.720 |
| X2 | 27.954 | 13.977 | 2.849 | 4.91 | 0.001 |
| X3 | 20.712 | 10.356 | 2.749 | 3.77 | 0.005 |
| X4 | 15.488 | 7.744 | 2.749 | 2.82 | 0.023 |
| X1X2 | 7.954 | 3.977 | 2.849 | 1.40 | 0.200 |
| X1X3 | 21.412 | 10.706 | 2.749 | 3.89 | 0.005 |
| X1X4 | 1.088 | 0.544 | 2.749 | 0.20 | 0.848 |
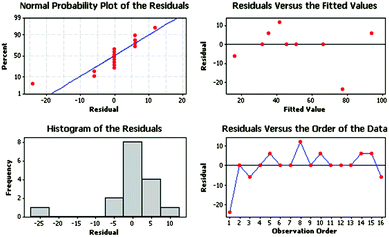
Fig. 5 shows the residual plots for Y in the model (eqn (2)). For the validation of the proposed method, residual plots were obtained. This technique is very useful for measuring the residual distribution. As can be observed in the plot of normal distribution, the residuals of the response are randomly scattered around zero in the residual plots.
The histogram of the residuals shows that their distribution is non-uniform, and it looks like there is an outlier regarding the existence of a small bar far from the rest of the bars, and the residuals (versus order) exhibit no clear pattern.
Response optimization
If there were no significant two-way interactions, the plots of the main effects (according to Fig. 4) would sufficiently describe the best condition for the synthesis of ZSM-5, that is, X1, X2, X3, and X4 should be set to the high level (1), high level (1), high level (1) and high level (1), respectively.However, the interactions were significant (Table 4) in this experiment and could increase or decrease the effect of each factor. Therefore, the other step of the optimization should be the examination of the surface plots of Y. These surface plots are three-dimensional (3D) plots that show the response as a function of two variables, whereas other variables are kept constant. These plots can provide information about the interaction of variables and are also useful for understanding the main effects and interactions. The three-dimensional plots for the response (% Y) (relative crystallinity and consequently the efficiency of the formation of zeolite) obtained from eqn (2) are shown in Fig. 6 and 7. In Fig. 6, the variables that are not in the graph are set at their low level (−1), whereas in Fig. 7, the variables that are not in the graph are set at their high level (1); Fig. 6(a) shows the surface plot of the response % Y (efficiency of the formation of zeolite) as a function of X1 and X2; Fig. 6(b) shows the surface plot of the response % Y as a function of X1 and X3; Fig. 6(c) shows the surface plot of the response % Y as a function of X1 and X4. According to Fig. 6(a–c), the highest value of Y is obtained when the SiO2/Al2O3, H2O/SiO2, and aging time levels are high; as shown in Fig. 7(a–c), the highest value of Y is obtained when the Na2O/SiO2, SiO2/Al2O3, H2O/SiO2, and aging time levels are high. The response Y presents the maximum value 90.30% at the optimal parameters of X1(1), X2(1), X3(1), and X4(1). Pure ZSM-5 can be obtained at the gel composition Na2O/SiO2 = 0.2, SiO2/Al2O3 = 60, and H2O/SiO2 = 53, and aging time = 72 h.
Prediction and confirmation of optimum conditions
Using the optimal conditions obtained from this method, the ZSM-5 nanocrystalline material was synthesized at 180 °C under atmospheric pressure. The typical X-ray diffraction pattern of the sample obtained under optimal conditions demonstrated the formation of the pure MFI phase. Fourier transform infrared (FTIR) absorption spectra were obtained via the KBr pellet technique using the Tensor 27 spectrometer in the range of 4000–400 cm−1 with the resolution of 4 cm−1. The crystal morphology and the size of the ZSM-5 powders obtained under the optimal conditions were investigated by SEM.X-ray diffraction studies
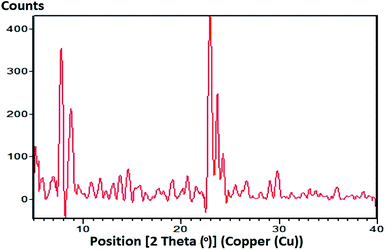
Fig. 8 shows the XRD pattern of the zeolite obtained under optimal conditions, which is in accordance with that reported in ref. 38. The XRD pattern shows peaks in the ranges of 2θ = 7–9° and 23–25°, which correspond to the specific peaks of the ZSM-5 zeolite. This indicates that the synthesized ZSM-5 zeolite powders are ZSM-5 zeolite crystals.Fourier-transform infrared studies
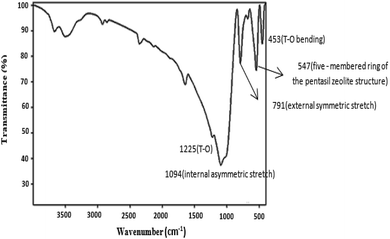
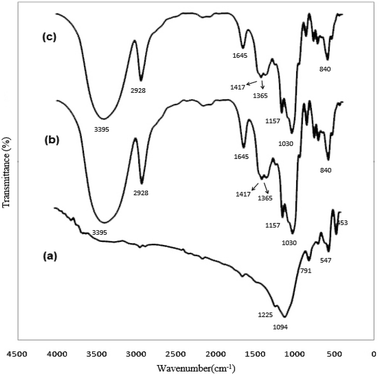
The FTIR spectra of the nanosized ZSM-5 zeolite without organic templates are shown in Fig. 9. Fig. 9 shows an infrared band at 547 cm−1, which has been assigned to the five-membered ring of the pentasil zeolite structure;42,43 the presence of the asymmetric stretching vibration band of the T–O bond (at 1225 cm−1) provides additional evidence for the formation of the nanosized ZSM-5 zeolite, and this band has been assigned to external linkages (between TO4 tetrahedra) and is the structure-sensitive IR band of ZSM-5 zeolite.44 The bands at 791 cm−1 and 1094 cm−1 are assigned to the external symmetric stretching and the internal asymmetric stretching vibrations, respectively. The band at 453 cm−1 is assigned to the T-O bending vibration.Scanning electron microscopy studies
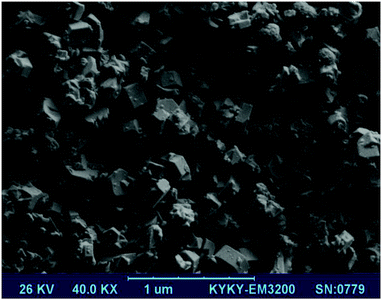
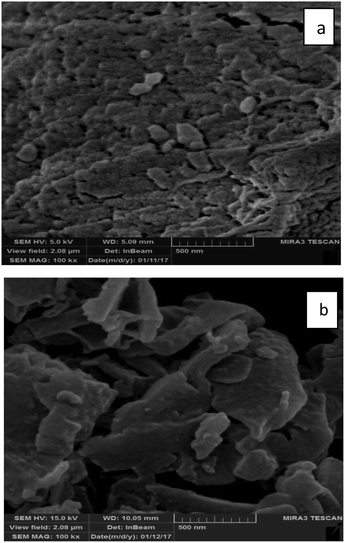
The morphology of the synthesized ZSM-5 zeolite powders was investigated using SEM. Fig. 10 shows the SEM image of the sample synthesized under optimal conditions. In the SEM image (Fig. 10), hexagonal morphology, typical of the ZSM-5 zeolite, is observed.Characterization of the hybrid materials and inclusion complex
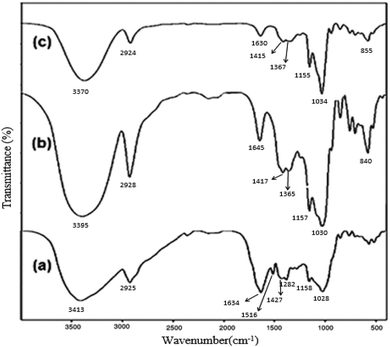
FTIR spectroscopy was also used to ascertain the formation of the CDZ–CUR inclusion complex. CDZ–CUR complexes prepared by methanol reflux appeared as amorphous substances whose colour was lighter than that of curcumin. Fig. 12 shows the FTIR spectra of curcumin, CDZ and the CDZ–CUR complex. The FTIR spectra also confirmed the CDZ–CUR complex formation. Curcumin showed a main peak at 3413 cm−1, assigned to the OH stretch. The bands at 1634 cm−1 were assigned to the stretching vibrations of the benzene ring of CUR, and those at 1516 cm−1 were assigned to the C![[double bond, length as m-dash]](https://www.rsc.org/images/entities/char_e001.gif) O and C
O and C![[double bond, length as m-dash]](https://www.rsc.org/images/entities/char_e001.gif) C vibrations of CUR; moreover, the bands at 1282 cm−1 were attributed to the Ar–O stretching vibrations. The FTIR spectra of the CDZ–CUR complexes were similar to the β-CD spectrum and also contained a number of peaks related to curcumin.42
C vibrations of CUR; moreover, the bands at 1282 cm−1 were attributed to the Ar–O stretching vibrations. The FTIR spectra of the CDZ–CUR complexes were similar to the β-CD spectrum and also contained a number of peaks related to curcumin.42
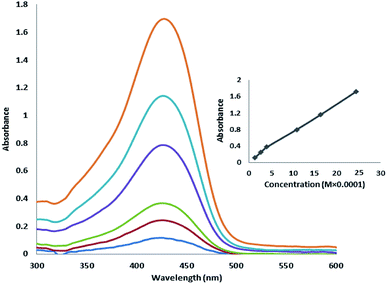
Fig. 15 shows the absorption spectra of curcumin. As shown in Fig. 15, with an increase in the concentration of curcumin, its absorption at the wavelength of 427 nm linearly increased.
Conclusions
In this study, a fractional factorial design method with only sixteen experiments and two runs for each of the eight experiments was used to optimize the experimental conditions for the preparation of nanosized ZSM-5 without an organic template. The effect of synthesis parameters on the efficiency of the formation of ZSM-5 zeolite was studied. Analysis of variance showed that the main effects and their two-way interactions were statistically significant (p < 0.05). The most important main effect was that of the SiO2/Al2O3 molar ratio, and the most important two-way interaction variable was the interaction of the Na2O/SiO2 and H2O/SiO2 molar ratio. It was found that Na2O/SiO2 in the synthesis mixture had the least influence on the ZSM-5 yields. Residual plots were analyzed to validate the model. Optimized response showed that the percent of response was maximum under the optimal conditions of X1(1), X2(1), X3(1), X4(1). Thus, pure ZSM-5 will be achieved at the molar composition of 12Na2O![[thin space (1/6-em)]](https://www.rsc.org/images/entities/char_2009.gif) :
:![[thin space (1/6-em)]](https://www.rsc.org/images/entities/char_2009.gif) 60SiO2
60SiO2![[thin space (1/6-em)]](https://www.rsc.org/images/entities/char_2009.gif) :
:![[thin space (1/6-em)]](https://www.rsc.org/images/entities/char_2009.gif) Al2O3
Al2O3![[thin space (1/6-em)]](https://www.rsc.org/images/entities/char_2009.gif) :
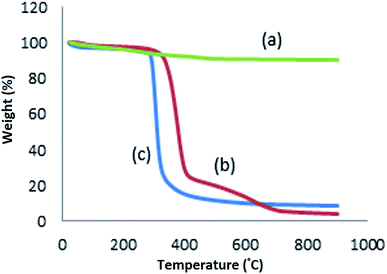
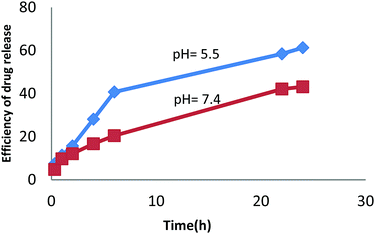
:![[thin space (1/6-em)]](https://www.rsc.org/images/entities/char_2009.gif) 3200H2O. X-ray diffraction pattern, SEM and FTIR results also confirmed the formation of the sample under optimal conditions. Then, the ZSM-5 zeolite obtained under the optimum conditions was functionalized with β-CD, and we demonstrated the possibility of inclusion complexation between CDZ and curcumin using a methanol reflux method. A drug delivery system based on the zeolite modified with beta cyclodextrin-containing curcumin anti-cancer drug was prepared for targeted drug delivery to cancer cells, and its effectiveness was studied under the experimental conditions. Inclusion complex formation was confirmed by FTIR spectroscopy, FESEM, UV-Vis and TGA. The results obtained in the present investigation are significant since the CDZ–CUR complexes have significantly better dissolution and can be further explored for pharmaceutical purposes. Inclusion complex formation resulted in amorphous compounds with improved solubility and dissolution of curcumin. The study of in vitro drug release showed that the efficiency of drug release under acidic conditions was higher than that under neutral conditions. Therefore, the performance of the proposed drug delivery system is higher in a tumor tissue when compared with that in a healthy tissue.
3200H2O. X-ray diffraction pattern, SEM and FTIR results also confirmed the formation of the sample under optimal conditions. Then, the ZSM-5 zeolite obtained under the optimum conditions was functionalized with β-CD, and we demonstrated the possibility of inclusion complexation between CDZ and curcumin using a methanol reflux method. A drug delivery system based on the zeolite modified with beta cyclodextrin-containing curcumin anti-cancer drug was prepared for targeted drug delivery to cancer cells, and its effectiveness was studied under the experimental conditions. Inclusion complex formation was confirmed by FTIR spectroscopy, FESEM, UV-Vis and TGA. The results obtained in the present investigation are significant since the CDZ–CUR complexes have significantly better dissolution and can be further explored for pharmaceutical purposes. Inclusion complex formation resulted in amorphous compounds with improved solubility and dissolution of curcumin. The study of in vitro drug release showed that the efficiency of drug release under acidic conditions was higher than that under neutral conditions. Therefore, the performance of the proposed drug delivery system is higher in a tumor tissue when compared with that in a healthy tissue.
Conflicts of interest
There are no conflicts to declare.References
- M. Gindy and R. Prudhomme, Expert Opin. Drug Delivery, 2009, 6, 865 CrossRef CAS PubMed.
- K. Coti, M. Belowich, M. Liong, M. Ambrogio, Y. Lau, H. Khatib, J. Zink, N. Khashab and J. Stoddart, Nanoscale, 2009, 1, 16 RSC.
- M. Danilczuk, K. Dlugopolska, T. Ruman and D. Pogocki, Mini-Rev. Med. Chem., 2008, 8, 1407 CrossRef CAS.
- D. Fatouros, D. Douroumis, V. Nikolakis, S. Ntais, A. Moschovi, V. Trivedi, B. Khima, M. Roldo, H. Nazar and P. Cox, J. Mater. Chem., 2011, 21, 7789 RSC.
- H. Bekkum, E. Flanigen,P. Jacobs and J. Jansen, Introduction to Zeolite Science and Practice, Elsevier Science, Amsterdam, Netherlands, 2001 Search PubMed.
- A. Corma, V. Fornes and F. Rey, Adv. Mater., 2002, 14, 71 CrossRef CAS.
- C. Platas-Iglesias, L. Vander Elst, W. Zhou, R. Muller, C. Geraldes, T. Maschmeyer and J. Peters, Chem.–Eur. J., 2002, 8, 5121 CrossRef CAS.
- M. Norek, I. Neves and J. Peters, Inorg. Chem., 2007, 46, 6190 CrossRef CAS.
- M. Tsotsalas, K. Kopka, G. Luppi, S. Wagner, M. Law, M. Schafers and L. De Cola, ACS Nano, 2010, 4, 342 CrossRef CAS.
- N. Ndiege, R. Raidoo, M. Schultz and S. Larsen, Langmuir, 2011, 27, 2904 CrossRef CAS.
- H. Zhang, Y. Kim and P. Dutta, Microporous Mesoporous Mater., 2006, 88, 312 CrossRef CAS.
- M. Arruebo, R. Fernandez-Pacheco, S. Irusta, J. Arbiol, M. Ibarra and J. Santamaria, Nanotechnology, 2006, 17, 4057 CrossRef CAS.
- I. Braschi, G. Gatti, G. Paul, C. Gessa, M. Cossi and L. Marchese, Langmuir, 2010, 26, 9524 CrossRef CAS.
- I. Braschi, S. Blasioli, L. Gigli, C. Gessa, A. Alberti and A. Martucci, J. Hazard. Mater., 2010, 178, 218 CrossRef CAS PubMed.
- A. Martucci, L. Pasti, N. Marchetti, A. Cavazzini, F. Dondi and A. Alberti, Microporous Mesoporous Mater., 2012, 148, 174 CrossRef CAS.
- G. Bar-Sela, R. Epelbaum and M. Schaffer, Curr. Med. Chem., 2010, 17, 190 CrossRef CAS.
- J. Jurenka, Altern. Med. Rev., 2009, 14, 141 Search PubMed.
- R. Maheshwari, A. Singh, J. Gaddipati and R. Srimal, Life Sci., 2006, 78, 2081 CrossRef CAS.
- A. Strimpakos and R. Sharma, Antioxid. Redox Signaling, 2008, 10, 511 CrossRef CAS.
- R. Sharma, W. Steward and A. Gescher, Adv. Exp. Med. Biol., 2007, 595, 453 CrossRef.
- Y. Wang, M. Pan, A. Cheng, L. Lin, Y. Ho, C. Hsieh and J. Lin, J. Pharm. Biomed. Anal., 1997, 15, 1867 CrossRef CAS.
- P. Anand, A. B. Kunnumakkara, R. A. Newman and B. B. Aggarwal, Mol. Pharm., 2007, 4, 807 CrossRef CAS.
- S. Bisht, G. Feldmann, S. Soni, R. Ravi, C. Karikar, A. Maitra and A. Maitra, J. Nanobiotechnol., 2007, 5, 3 CrossRef PubMed.
- J. Shaikh, D. D. Ankola, V. Beniwal, D. Singh and M. N. Kumar, Eur. J. Pharm. Sci., 2009, 37, 223 CrossRef CAS.
- H. Tonnesen, Pharmazie, 2002, 57, 820 CAS.
- Z. Wang, M. Leung, T. Kee and D. English, Langmuir, 2010, 26, 5520 CrossRef CAS.
- M. Leung and T. Kee, Langmuir, 2009, 25, 5773 CrossRef CAS.
- H. Ingolfsson, R. Koeppe and O. Andersen, Biochemistry, 2007, 46, 10384 CrossRef CAS.
- K. Maiti, K. Mukherjee, A. Gantait, B. P. Saha and P. K. Mukherjee, Int. J. Pharm., 2007, 330, 155 CrossRef CAS.
- A. Safavy, K. Raisch, S. Mantena, L. Sanford, S. Sham, N. Krishna and J. Bonner, J. Med. Chem., 2007, 50, 6284 CrossRef CAS.
- G. Horvath, T. Premkumar, A. Boztas, E. Lee, S. Jon and K. E. Geckeler, Mol. Pharm., 2008, 5, 358 CrossRef CAS.
- Q. Wu, X. Meng, X. Gao and F. Xiao, Acc. Chem. Res., 2018, 51, 1396 CrossRef CAS.
- H. Li, X. Liu, S. Qi, L. Xu, G. Shi, Y. Ding, X. Yan, Y. Huang and J. Geng, Angew. Chem., Int. Ed., 2017, 56, 14090 CrossRef CAS.
- K. Dey, S. Ghosh and M. Naskar, Ceram. Int., 2013, 39, 2153 CrossRef CAS.
- D. Hu, Q. Xia, X. Lu, X. Luo and Z. Liu, Mater. Res. Bull., 2008, 43, 3553 CrossRef CAS.
- D. Zhang, R. Wang and X. Yang, Microporous Mesoporous Mater., 2009, 126, 8 CrossRef CAS.
- D. Hu, Q. Xia, X. Lu, X. Luo and Z. Liu, Mater. Res. Bull., 2008, 43, 3553 CrossRef CAS.
- Y. Cheng, L. Wang, J. Li, Y. Yang and X. Sun, Mater. Lett., 2005, 59, 3427 CrossRef CAS.
- M. Khanmohammadi, Sh. Amani and A. Bagheri Garmarudi, Anal. Methods, 2016, 8, 2799 RSC.
- A. Szarpak-Jankowska, C. Burgess, L. De Cola and J. Huskens, Chem.–Eur. J., 2013, 19, 14925 CrossRef CAS.
- B. Tang, L. Ma, H. Wang and G. Zhang, J. Agric. Food Chem., 2002, 50, 1355 CrossRef CAS.
- S. Karmakar, N. Banik, S. Patel and S. Ray, Neurosci. Lett., 2006, 407, 53 CrossRef CAS.
- S. Shishodia, H. Amin, R. Lai and B. Aggarwal, Biochem. Pharmacol., 2005, 70, 700 CrossRef CAS.
- G. Sa and T. Das, Cell Div., 2008, 3, 14 CrossRef.
- I. Mallard, L. Stade, S. Ruellan, P. Jacobsen, K. Larsen and S. Fourmentin, Colloids Surf., A, 2015, 482, 50 CrossRef CAS.
- M. Yallapu, M. Jaggi and S. Chauhan, Colloids Surf., B, 2010, 79, 113 CrossRef CAS.
| This journal is © The Royal Society of Chemistry 2019 |


