 Open Access Article
Bismuth trioxide-tailored sintering temperature, microstructure and NTCR characteristics of Mn1.1Co1.5Fe0.4O4 ceramics
Bing Wang ab,
Junhua Wangab,
Aimin Changab and
Jincheng Yao
 *ab
*ab
aKey Laboratory of Functional Materials and Devices for Special Environments of CAS, Xinjiang Key Laboratory of Electronic Information Materials and Devices, Xinjiang Technical Institute of Physics & Chemistry of CAS, 40-1 South Beijing Road, Urumqi, China. E-mail: yaojc@ms.xjb.ac.cn
bUniversity of Chinese Academy of Sciences, Beijing 100049, China
First published on 15th August 2019
Abstract
Mn1.1Co1.5Fe0.4O4 ceramics with tailored sintering temperature, microstructure, and NTCR characteristics were prepared using Bi2O3 sintering additive by a solid-state reaction route. Densification and morphological characterization indicate that bismuth trioxide can play a critical role in the sintering process. The results reveal that the sintering temperature can be decreased significantly from 1200 °C to 1050 °C by using the appropriate content of Bi2O3 additive. The resistivity decreases first and then increases with increasing Bi2O3 content. The obtained B25/50 value and ρ25 ranges were 3647–3697 K, and 800–1075 Ω cm, respectively. Oxygen sorption theory can be used to illustrate the optimal thermal stability (ΔR/R0 = 0.10%). Complex impedance analysis further elucidates that grain boundaries make a dominant contribution to the total resistance. The mechanisms of grain boundary conduction and relaxation behavior are systematically analyzed. These findings open up a window for the further advancement of NTC ceramics at lower sintering temperature.
1. Introduction
With the accelerated development of electronic components for miniaturization and integration, multilayer chip thermistors have been widely used in electronic circuits as they facilitate the integration of different electronic devices. Consequently, the assembly of low temperature co-fired ceramics (LTCC) with discrete sensors, resistors, and inductors into a single monolithic chip component can achieve multifunctional performance and promote miniaturization in the printed circuit board (PCB) during assembly.1–4 For example, Wang et al.5 reported a novel V-modified Li3Mg2NbO6 ceramics with outstanding microwave dielectric properties and can reach densification at 900 °C. Li et al.6 synthesized the In-doped Mg–Cd ferrite at low sintering temperature using Bi2O3 additive. These efforts make these ceramics promising candidates for LTCC applications. Negative temperature coefficient resistors (NTCR) are ceramic semiconductor components whose resistance decreases with increasing temperature. Many material systems have used for NTC ceramics, including stable Mn-based ternary systems, e.g., Mn–Co–Fe–O, Mn–Co–Ni–O, Mn–Cu–Ni–O, and others. Due to the characteristics of fast response, high sensitivity, and low cost, Mn–Co–Fe–O NTC ceramics are promising materials for chip and LTCC applications.7–10 However, the high sintering temperature has been one of the main problems. In previous studies, the sintering temperature of Mn–Co–Fe–O NTC ceramics is typically at and above 1200 °C, which will cause the high production cost and difficult quality control.10–12To date, numerous successful methods for decreasing the sintering temperature have demonstrated with Ni–Zn ferrites and BaTiO3 systems,13–16 but the development of NTC ceramics is in its infancy.17 Therefore, studying the decreasing of the sintering temperature of Mn–Co–Fe–O NTC ceramics is of great importance. Three main methods have been proposed to decrease the sintering temperature: using materials with fine powders, doping with sintering aids, and chemical processing.18–20 Sintering aid by liquid mass transfer mechanism or solution is valuable for decreasing the sintering temperature. For instance, Ye et al.21 using Si as a sintering aid in B4C ceramics and found that the relative density can reach 99% for the formation of liquid Si during sintering.
In previous studies, Bi2O3 has been demonstrated to be a useful sintering aid in some materials. For example, He et al.22 fabricated compact SrBi2Nb2O9−xBi2O3 ceramics and obtained excellent electrical properties, e.g., ρrd = 96.4%, d33 = 18 pC N−1, 2Pr = 17.8 mC cm−2 and Tc = 420 °C. Xu et al.23 synthesized dense NiCuZn ferrite ceramics with small grains and sintered at 875 °C via changing the amount of Bi2O3 and Nb2O5 additives. However, the effects of Bi2O3 addition on the sinterability of NTC ceramics have not studied. In this study, liquid-Bi2O3-tailored sintering temperature, microstructure and NTCR Characteristics of Mn1.1Co1.5Fe0.4O4 ceramics have investigated.
2. Experimental
2.1. Experimental procedures
Analytical grade Co2O3, Mn3O4, and Fe2O3 powders were weighed in their respective stoichiometric ratios to synthesize Mn1.1Co1.5Fe0.4O4 (MCF) ceramics. The mixture of weighed powders, deionized water, and alcohol was ball-milled for 10 h in the Teflon jar using ZrO2 as the grinding medium. The obtained slurry was dried at 85 °C in an oven for 20 h. Then the dried powders were ground in an agate mortar and calcinated at 950 °C for 3 h. Then, x wt% Bi2O3 (where x = 0, 0.05, 0.1, 0.15) additives were added into the calcined powders and ball-milled for 12 h using alcohol as the medium. The as-obtained slurry was dried at 85 °C for 20 h and then ground. Hereafter, the as-obtained powders pressed into the pellet with 10 mm diameter and the thickness about 2 mm at 1.2 MPa. Then the pellet was pressed using cold isostatic pressing (CIP) at 300 MPa for 120 s dwell time. The green bodies were sintered at different temperatures (T = 1200 °C, 1150 °C, 1100 °C, 1050 °C, 1000 °C) for a holding time of 4 h. The silver paste coated on the two opposite sides as the electrode of the sintered discs to investigate the electrical properties. Then the discs were heated to 835 °C for 20 min and quenched to achieve the metallization. Subsequently, ten samples per set for measuring electrical resistance held with a holder in a bath of silicone oil.2.2. Measurements and characterization
The crystal structure of the samples determined by the X-ray diffraction (XRD) (Bruker D8 Advance, Germany) patterns with Cu Kα radiation. The Archimedes technique was used to measure the bulk density to characterize the densification of the samples. The microstructures of the as-sintered samples were examined using a ZEISS SUPRA55VP scanning electron microscope (SEM). The distributions of constituent elements were confirmed using energy dispersive spectroscopy (EDS) (Bruker X-flash5010, Germany). For the electrical properties, the four-terminal method was carried out to measure the electrical resistance using the Agilent 34401A digital multimeter in the range of −75 °C to 55 °C. The aging test conducted at 125 °C for 300 h in the air. The material constant (B value), and the aging coefficient (ΔR/R0) can be calculated using the following equations:
 | (1) |
 | (2) |
The as-sintered ceramics were analyzed using an impedance analyzer (HP41494A). The real (Z′) and imaginary parts (Z′′) of complex impedance can be calculated as:
 | (3) |
 | (4) |
3. Results and discussions
3.1. XRD patterns
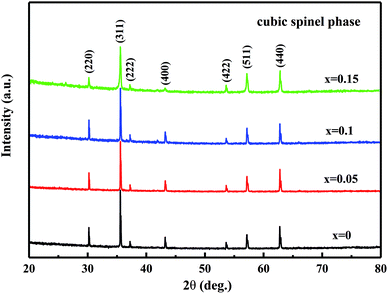
Fig. 1 shows the XRD patterns of the MCF ceramics sintered at 1050 °C for 4 h. The XRD results show that all samples mainly contained the cubic spinel phase and no other peaks or peak drift were observed, indicating that the Bi2O3 addition did not interfere with the phase composition of the MCF ceramics. Due to the bismuth ion has a radius of 1.03 Å (6 coordination), which is larger than that of manganese, iron and cobalt ions, about 0.6 Å, so it's difficult to enter the lattice of the spinel. However, the amount of Bi2O3 is too small, which makes XRD hard to detect. As a result, the XRD patterns have not changed.3.2. Densification and microstructure analysis
Fig. 2 shows the variation tendency of bulk density and sintering temperature of MCF ceramics as a function of Bi2O3 content. As shown in Fig. 2, the bulk density has no apparent changes when the sintering temperatures higher than 1100 °C. Interestingly, the addition of Bi2O3 at 1000 °C and 1050 °C had a rather notable effect on the bulk density of the MCF ceramics, i.e., the bulk density increased with the increased amount of Bi2O3 additive by a large amount. Unfortunately, the maximum bulk density at 1000 °C only reached 4.409 g cm−3, which failed to reach the densification condition. On the contrary, the bulk density considerably increased from 4.457 g cm−3 to 5.074 g cm−3 when the samples sintered at 1050 °C, which can obtain the dense MCF ceramics. Therefore, the 1050 °C selected as the sintering temperature for further study. Besides, the bulk density increased with the addition of Bi2O3 compared to that of the initial value. However, as the Bi2O3 content further increased, the bulk density decreased at a constant temperature. It attributed to the appearance of liquid phase improves the transport rates of grain coarsening, so grain growth mixed with some pores occurred.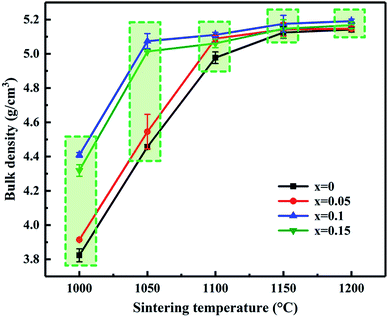 | ||
| Fig. 2 Bulk density and sintering temperature of MCF ceramics as a function of Bi2O3 content (0–0.15 wt%). | ||
Fig. 3 shows the SEM micrographs of MCF ceramics with x wt% Bi2O3 contents (0 ≤ x ≤ 0.15) sintered at 1050 °C. In the sample without Bi2O3 (Fig. 3a), the sintering temperature of 1050 °C did not achieve the densification condition. As such, many pores observed along with heterogeneous grains. As the Bi2O3 content increased from 0 to 0.1 wt% (Fig. 3a and c), some pores disappeared, while the densification rate and grain homogeneity increased by a large amount. This transformation can be attributed to the appearance of a trace amount of liquid layer at the grain boundaries, providing a capillary force and driving force to reduce the interfacial free energy of the system that pulls the grains together which promotes grain densification and homogeneity.24,25 However, as the Bi2O3 content further increased (Fig. 3d), the grain size gradually increased and the homogeneity became poor.
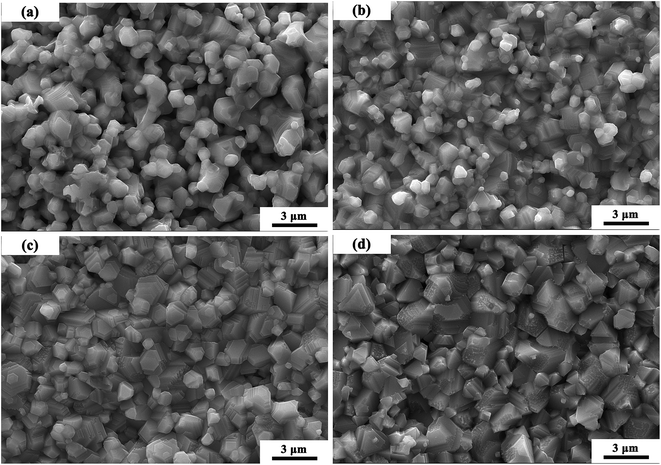 | ||
| Fig. 3 SEM micrographs of MCF ceramics with x wt% Bi2O3 contents (0 ≤ x ≤ 0.15) sintered at 1050 °C: (a) x = 0, (b) x = 0.05, (c) x = 0.10, (d) x = 0.15. | ||
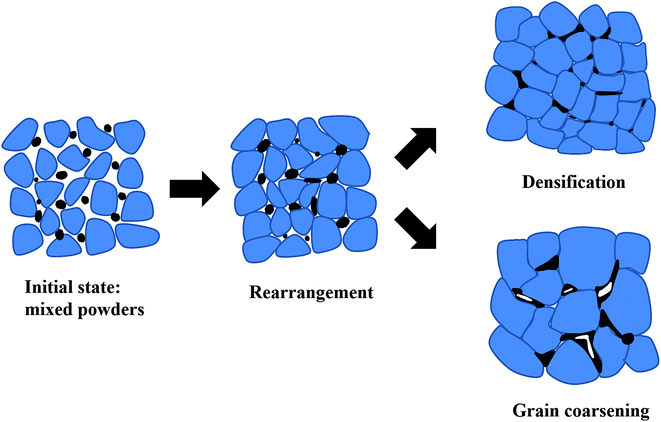
A theoretical model of the microstructure evolutions during the sintering process proposed as depicted in Fig. 4.24,26 In the initial state, it can observe loose small grains mixed with bismuth trioxide additives. As the increase of temperature, Bi2O3 additives begin to soften and turn into the liquid phase. Meanwhile, a rearrangement of particles happened. As the temperature rises further, two different mechanisms started to appear, i.e., densification and grain coarsening in the final stage of the sintering.26 Capillary forces and the driving force to reduce the interfacial free energy of the system, especially, ΔG (liquid–vapor)—create shear and rotational actions of particles diminishing the pores by transitioning from loose packing to close packing. Hence, dense microstructures may occur.27 Besides, the appearance of the liquid phase can improve the transport rates of grain coarsening, so grain growth mixed with some pores may happen. At this stage, the amount of additive and sintering temperature are crucial for densification and grain coarsening.28,29
SEI and elemental maps were obtained to determine the distribution of the constituent elements in the samples. In this sample, the Mn, Co, Fe, and Bi distributions were homogeneous, while those of O were heterogeneous. Some oxygen-deficient regions were observed at the grain boundaries. Representative SEI and elemental maps of the MCF samples with 0.15 wt% Bi2O3 sintered at 1050 °C are shown in Fig. 5.
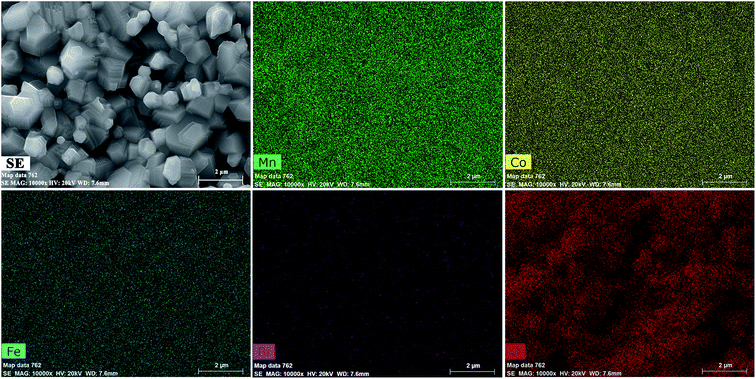 | ||
| Fig. 5 SEI and maps of elements Mn, Co, Fe, Bi, and O for MCF samples with 0.15 wt% Bi2O3 sintered at 1050 °C. | ||
3.3. Electrical properties
Fig. 6 shows the specific resistance (ρ)–temperature (T) dependence relationship from −75 °C to 55 °C of the MCF ceramics sintered at 1050 °C. The specific resistance of each sample each sample decreased exponentially with increasing temperature, corresponding to typical NTC characteristics.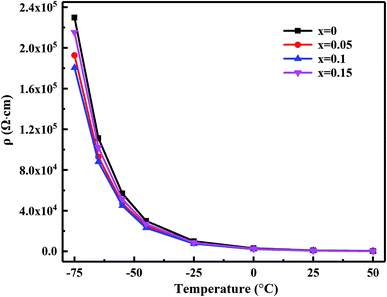 | ||
| Fig. 6 Plots of the ρ vs. T for the MCF ceramics with x wt% Bi2O3 contents (0 ≤ x ≤ 0.15) sintered at 1050 °C. | ||
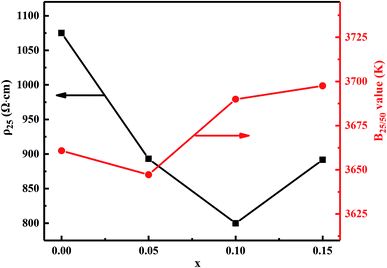
Fig. 7 shows the material constant B25/50 and resistivity ρ25 as a function of Bi2O3 content for MCF ceramics. The obtained ρ25 and B25/50 range from 800 to 1075 Ω cm and 3647 to 3697 K, respectively. Also, the specific resistance decreased upon addition of Bi2O3 from 0 to 0.1 wt%. When the Bi2O3 content increased to 0.15 wt%, however, an increase in specific resistance occurred. Since the resistivity of Bi2O3 is 106 Ω cm or more, the electrical resistivity of the sintered body is considered to increase as the Bi2O3 content increases. However, the electrical resistivity of the sintered body decreased upon addition of Bi2O3 from 0 to 0.1 wt%. This can be attributed to the following two reasons: (1) it is well known that the electrons move through the shortest contact point between the oxide particles. Therefore, the increased densification reduces the electron transport distance between the Mn3+ and Mn4+. In other words, conduction caused by the hopping electrons between Mn3+ and Mn4+ is easier on octahedral and, thus, a decrease in the resistivity; (2) due to bismuth oxide has relatively low ionization energy, upon addition of Bi2O3 from 0 to 0.1 wt%, the ionization energy decreased, which increased the concentration of carriers capable of accepting or donating electrons during transfer and, thereby, decreasing the resistivity. Besides, it also can notice that B25/50 constant decreases first and then increases as the Bi2O3 increases. It mainly results from the variation in activation energy causes the change of jumping resistance between Mn3+ and Mn4+ ions.
Fig. 8 shows the relative resistance drift ΔR/R0 as a function of the Bi2O3 content for MCF ceramics after the aging test at 125 °C for 300 h. The as-obtained ceramics exhibited excellent thermal stability. The appropriate content of Bi2O3 strongly decreased the resistance drift from 2.47 to 0.10%. The minimum resistance drift (ΔR/R0 = 0.10%) obtained with the 0.1 wt% Bi2O3 addition. In contrast, when the Bi2O3 content increased to 0.15 wt%, an increase in electrical drift was observed. It illustrated by the following reason.
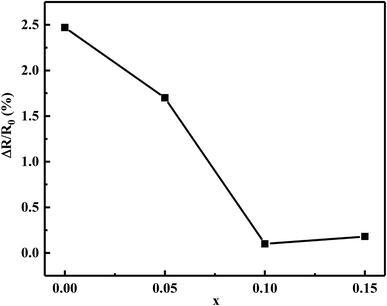 | ||
| Fig. 8 The relative resistance drift ΔR/R0 of Bi2O3 content (0–0.15 wt%) for the MCF ceramics after the aging test at 125 °C for 300 h. | ||
Based on the densification and SEM analysis above, upon the addition of Bi2O3 from 0 to 0.1 wt%, the increased densification and optimized microstructure stabilized the configurations of the cation distribution. It inhibits the oxidation and diffusion of the cationic vacancies between the grains and the grain boundaries, leading to a decreasing of resistivity drift. However, 0.15 wt% Bi2O3 content resulted in grain coarsening and decreased densification, more atmospheric oxygen sorption has appeared following the defect reaction equation:
 | (5) |
Thus, oxygen sorption leads to the Mn2+ at tetrahedral sites are easily oxidized to Mn3+. As a result, the configurations of the cation distribution become less stable and easier for migration, which results in the increasing of the resistivity drift. The phenomenon of resistivity drift during the aging test is very consistent with other studies.30,31
To further clarify the contribution of the grain and grain boundary to the conduction characteristic of MCF ceramics, the AC impedance spectroscopy was engaged in this paper.32–34 Fig. 9 shows the simplified equivalent circuit and Nyquist plots for MCF ceramics measured at room temperature with the frequencies range from 100 Hz to 4 MHz. Generally, since the mean relaxation time of grain and grain boundaries differ from each other, two semicircular arcs with different radii can usually be observed in polycrystalline ceramics. In the impedance plane plot, the intercept of the Z′′ axis in high-frequency represents the grain resistance (Rb), and the low-frequency one depicts the grain boundaries resistance (Rgb).32,35 In electrically inhomogeneous ceramics with high grain boundary resistance, however, the impedance plane may not exhibit contributions from grains of the sample. In this paper, for instance, the grain response at high-frequency is hard to observe thoroughly. Only one depressed semicircle in low-frequency observed, which attributed to the contribution of the grain boundaries. It suggests the total impedance of MCF ceramics predominated by grain boundary resistance. It is consistent with other studies.33 Moreover, as Bi2O3 increased from 0 to 0.15 wt%, the variation of grain boundaries resistance (Rgb) decreased first and then increased, which is similar to the variation of resistivity and can attribute to the oxygen vacancies formed by oxygen adsorption (eqn (5)). It is consistent with elemental mapping (Fig. 5).
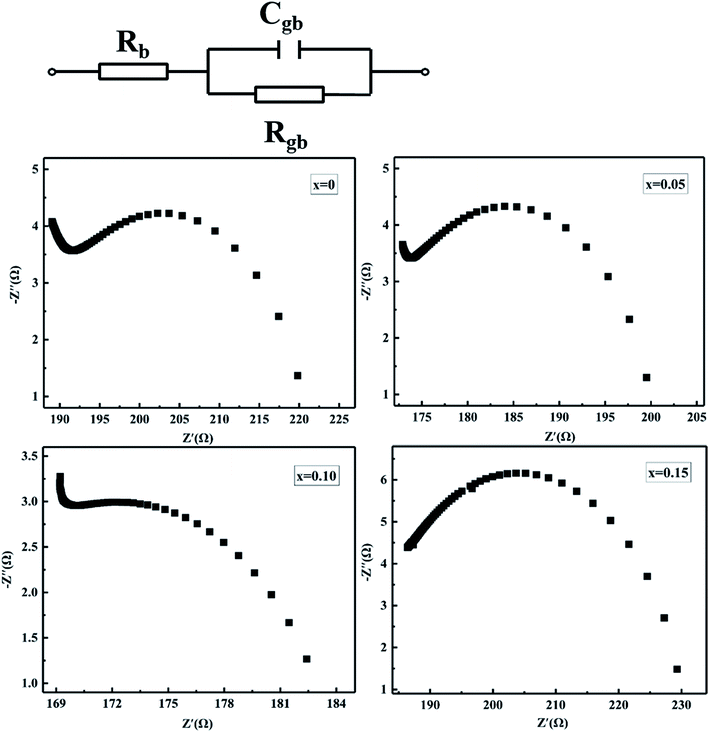 | ||
| Fig. 9 Simplified equivalent circuit and impedance plots of MCF ceramics with x wt% Bi2O3 contents (0 ≤ x ≤ 0.15). | ||
Fig. 10 shows the relation of the real part of the impedance (Z′) with frequency. It observed that Z′ decreases gradually with the increases in frequency means the increased ac conductivity. Further, as Bi2O3 increased from 0 to 0.15 wt%, Z′ decreases first and then increases, which corresponds to the variation of the microstructure and densification. Similar results reported by Zhang et al.36 Fig. 11 presents the relation of the imaginary part (Z′′) with frequency. It has observed that Z′′ increases firstly and then decreases, a maximum value appears when the relaxation frequency reached. It indicates that the single relaxation process, which corresponds to the grain boundaries relaxation process.37,38 Relaxation behavior induced by the space charge effect in the sample. When it's below the relaxation frequency, the imaginary part, Z′′, is mainly dominated by a long-range motion of charge carriers. Further, above the relaxation frequency, charge carriers are trapped in the potential wells. The imaginary component of the impedance essentially predominated by short-range hopping of charge carriers in potential wells. It's consistent with the impedance data reported in other studies.34 Thus, it further confirmed that the resistivity is mainly affected by the relaxation process of grain boundaries.
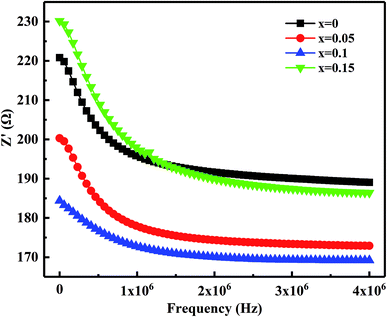 | ||
| Fig. 10 Variation of the real part of the impedance (Z′) with frequency for MCF ceramics with x wt% Bi2O3 contents (0 ≤ x ≤ 0.15). | ||
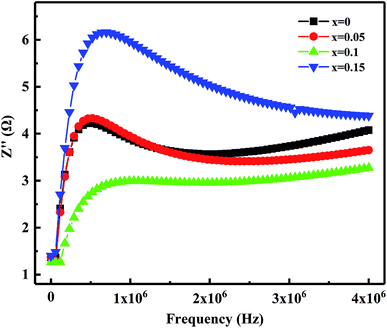 | ||
| Fig. 11 Variation of the imaginary part of the impedance (Z′′) with frequency of MCF ceramics with x wt% Bi2O3 contents (0 ≤ x ≤ 0.15). | ||
4. Conclusions
In this paper, the effects of Bi2O3 additive on the sintering temperature, microstructure, and NTCR characteristics of Mn1.1Co1.5Fe0.4O4 ceramics were systematically investigated. Liquid bismuth trioxide was demonstrated to be an effective agent during sintering of the MCF ceramics. The sintering temperature of the MCF ceramics decreased from 1200 °C to 1050 °C by a large amount. Densification and microstructure evolution is mainly due to two different mechanisms in the final stage of sintering. The resistivity decreases first and then increases with increasing Bi2O3 content. Furthermore, the aging test showed that the 0.1 wt% Bi2O3 sample exhibited the lowest resistance drift (ΔR/R0 = 0.10%), which can be explained by oxygen sorption. The grain boundary conduction and relaxation behavior have attributed to the oxygen absorption and space charge, respectively. Consequently, it demonstrated that the Bi2O3 additive is favorable for preparing high-performance NTC ceramics at lower sintering temperatures.Conflicts of interest
There are no conflicts to declare.Acknowledgements
This work was supported by the National Key Research and Development Program of China (Grant No. 2017YFB0406405).References
- K. C. Feng, P. Y. Chen, C. S. Tu, C. S. Chen, R. R. Chien, C. C. Chiang and W. S. Chang, J. Alloys Compd., 2019, 782, 1094–1102 CrossRef CAS.
- C. Kai, C. Li, H. Xiang, Y. Tang, Y. Sun and L. Fang, J. Am. Ceram. Soc., 2019, 102, 362–371 CrossRef CAS.
- Y. Liang, M. Ma, F. Zhang, F. Liu, Z. Liu, D. Wang and Y. Li, Sensors, 2019, 19, 1189 CrossRef PubMed.
- W. Yang, X. Tang, H. Zhang and H. Su, Ceram. Int., 2016, 42, 14609–14613 CrossRef CAS.
- G. Wang, H. Zhang, X. Huang, F. Xu, G. Gan, Y. Yang, D. Wen, J. Li, C. Liu and L. Jin, Ceram. Int., 2018, 44, 19295–19300 CrossRef CAS.
- J. Li, D. Wen, Q. Li, T. Qiu, G. Gan and H. Zhang, Ceram. Int., 2018, 44, 678–682 CrossRef CAS.
- M. Suzuki, J. Phys. Chem. Solids, 1980, 41, 1253–1260 CrossRef CAS.
- C. Zhao, B. Wang, P. Yang, L. Winnubst and C. Chen, J. Eur. Ceram. Soc., 2008, 28, 35–40 CrossRef CAS.
- A. Feteira, J. Am. Ceram. Soc., 2009, 92, 967–983 CrossRef CAS.
- H. Zhang, A. Chang and C. Peng, Microelectron. Eng., 2011, 88, 2934–2940 CrossRef CAS.
- X. Liu, J. H. Wang, Z. H. Hu, J. C. Yao and A. M. Chang, J. Mater. Sci.: Mater. Electron., 2017, 28, 7243–7247 CrossRef CAS.
- M. N. Muralidharan, P. R. Rohini, E. K. Sunny, K. R. Dayas and A. Seema, Ceram. Int., 2012, 38, 6481–6486 CrossRef CAS.
- M. Kong, S. Jiang, T. Xie and H. Zhang, Microelectron. Eng., 2009, 86, 2320–2323 CrossRef CAS.
- R. Lebourgeois, S. Duguey, J. P. Ganne and J. M. Heintz, J. Magn. Magn. Mater., 2007, 312, 328–330 CrossRef CAS.
- W. Ling, H. Zhang, Y. He, Y. Wu, K. Yang, Y. Li and S. Li, J. Magn. Magn. Mater., 2010, 322, 819–823 CrossRef CAS.
- X. Kuang, G. Carotenuto and L. Nicolais, Adv. Perform. Mater., 1997, 4, 257–274 CrossRef CAS.
- T. Reimann, J. Topfer, S. Barth, H. Bartsch and J. Muller, Int. J. Appl. Ceram. Technol., 2013, 10, 428–434 CrossRef CAS.
- K. W. Tay, Y. P. Fu, J. F. Huang and H. C. Huang, Ceram. Int., 2011, 37, 1025–1031 CrossRef CAS.
- Y. Song, Q. Sun, Y. Lu, X. Liu and F. Wang, J. Alloys Compd., 2012, 536, 150–154 CrossRef CAS.
- M. R. Tohidifar, Ceram. Int., 2018, 44, 3699–3706 CrossRef CAS.
- F. Ye, Z. Hou, H. Zhang and L. Liu, J. Am. Ceram. Soc., 2010, 93, 2956–2959 CrossRef CAS.
- X. He, R. Chu, Z. Xu, Z. Yao and J. Hao, RSC Adv., 2018, 8, 15613–15620 RSC.
- F. Xu, D. Zhang, G. Wang, H. Zhang, Y. Yang, Y. Liao, L. Jin, Y. Rao, J. Li, F. Xie and G. Gan, J. Alloys Compd., 2019, 776, 954–959 CrossRef CAS.
- R. M. German, P. Suri and S. J. Park, J. Mater. Sci., 2008, 44, 1–39 CrossRef.
- F. Xie, L. Jia, F. Xu, J. Li, G. Gan and H. Zhang, Ceram. Int., 2018, 44, 13122–13128 CrossRef CAS.
- F. Xu, Y. Liao, D. Zhang, T. Zhou, J. Li, G. Gan and H. Zhang, Inorg. Chem., 2017, 56, 4512–4520 CrossRef PubMed.
- A. R. Uhl, P. Fuchs, A. Rieger and F. Pianezzi, et al., Prog. Photovolt. Res. Appl., 2015, 23, 1110–1119 CrossRef CAS.
- G. Wang, H. Zhang, C. Liu, H. Su, L. Jia, J. Li, X. Huang and G. Gan, J. Electron. Mater., 2018, 47, 4672–4677 CrossRef CAS.
- X. Wang, Y. Li, Z. Chen, H. Zhang, H. Su, G. Wang, Y. Liao and Z. Zhong, J. Alloys Compd., 2019, 797, 566–572 CrossRef CAS.
- D. F. Li, S. X. Zhao, K. Xiong, H. Q. Bao and C. W. Nan, J. Alloys Compd., 2014, 582, 283–288 CrossRef CAS.
- C. J. Ma, Y. F. Liu, Y. N. Lu, H. Gao, H. Qian and J. X. Ding, Mater. Sci. Eng., B, 2014, 188, 66–71 CrossRef CAS.
- S. G. Song, Z. Ling and F. Placido, Mater. Res. Bull., 2005, 40, 1081–1093 CrossRef CAS.
- Z. Song, S. Zhang, H. Liu, H. Hao, M. Cao, Q. Li, Q. Wang, Z. Yao, Z. Wang, M. T. Lanagan and J. Jones, J. Am. Ceram. Soc., 2015, 98, 3212–3222 CrossRef CAS.
- Z. Peng, X. Zeng, F. Cao and X. Yang, J. Alloys Compd., 2017, 695, 626–631 CrossRef CAS.
- J. X. Wang, H. Zhang, X. Sun, Y. Liu and Z. C. Li, J. Mater. Sci.: Mater. Electron., 2016, 27, 11902–11908 CrossRef CAS.
- H. Zhang, T. Liu, L. Zhao, H. Jiang and A. Chang, J. Mater. Sci.: Mater. Electron., 2017, 28, 14195–14201 CrossRef CAS.
- K. Lily, K. Kumari, K. Prasad and K. L. Yadav, J. Mater. Sci., 2007, 42, 6252–6259 CrossRef CAS.
- B. Zhang, Q. Zhao, A. Chang, J. Yao, P. Zhao, F. Guan and W. Kong, J. Alloys Compd., 2012, 512, 132–139 CrossRef CAS.
| This journal is © The Royal Society of Chemistry 2019 |

