 Open Access Article
Creative Commons Attribution 3.0 Unported Licence
Highly efficient biodegradation of reactive blue 19 under the activation of tea residue by a newly screened mixed bacterial flora DDMY2†
Xuehui Xie *ab,
Xiulin Zhenga,
Chengzhi Yua,
Qingyun Zhanga,
Yiqin Wanga,
Junhao Conga,
Na Liuc,
Zhenjiang Hed,
Bo Yang*a and
Jianshe Liuab
aState Environmental Protection Engineering Center for Pollution Treatment and Control in Textile Industry, College of Environmental Science and Engineering, Donghua University, 2999# North Renmin Road, Songjiang District, Shanghai 201620, China. E-mail: xiexuehui@dhu.edu.cn; xiulinzxl@163.com; hyywsdklts@163.com; zqyfqyy@163.com; 18321195601@163.com; junhaocong@163.com; yangbo@dhu.edu.cn; liujianshe@dhu.edu.cn; Fax: +86-21-67792522
bShanghai Institute of Pollution Control and Ecological Security, Shanghai 200092, P. R. China
cSchool of Environment and Surveying Engineering, Suzhou University, Suzhou, Anhui 234000, China. E-mail: liuna900301@163.com
dSchool of Metallurgy and Environment, Central South University, Changsha 410083, P. R. China. E-mail: hzjcsu@csu.edu.cn
First published on 9th August 2019
Abstract
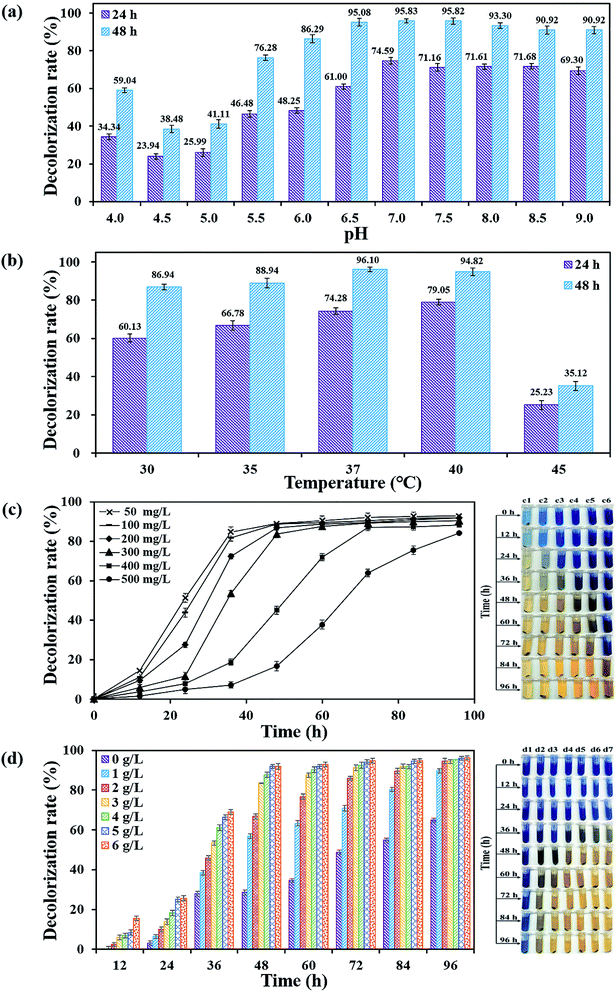
In this study, a newly screened mixed bacterial flora DDMY2 had high decolorization capacity for anthraquinone dye reactive blue 19 (RB19) and the decolorization efficiency of 300 mg L−1 RB19 could reach up to 98% within 48 h in the presence of tea residue. Results indicated that RB19 could be efficiently decolorized by flora DDMY2 in wide ranges of pH values (5.0–9.0), temperatures (30–40 °C) and initial dye concentrations (50–500 mg L−1) under the activation of tea residue. Concentration of tea residue had been proved to significantly impact the decolorization performance. UV-vis spectrophotometry, Fourier transform infrared spectrometry and liquid chromatography/time-of-flight/mass spectrometry analysis showed three identified degradation products and the possible degradation pathway of RB19 was speculated. High-throughput sequencing analysis revealed the community structures of bacterial flora before and after domestication by tea residue. Based on the result, it was inferred that unclassified_o_Pseudomonadales, Brevibacillus, Stenotrophomonas and Bordetella activated by tea residue were responsible for the excellent decolorization performance. Results of this research deepen our understanding of the biodegradation process of anthraquinone dyes by bacterial flora and broaden the knowledge of utilizing tea residue as a bioactivator in biological treatment.
1. Introduction
Synthetic dyes are widely used in various industries, such as textiles, paper printing, cosmetics, plastics, food and leather.1 Among them, textile industries mainly have desizing, washing, bleaching, drying and other processes,2 which produce a large amount of effluent containing complex and refractory dyes. These dyes are discharged into water bodies, which can reduce the light penetration and oxygen transfer, resulting in changes to photosynthesis and aquatic ecosystems.3 Dyes are usually physically and chemically stable in the natural environment and therefore they are highly recalcitrant and harmful to living things.4Given the refractory dye-containing wastewater, numerous physical and chemical treatment methods have positive effects on the removal of such wastewater. However, high cost and secondary pollution have greatly constrained these processes.5 Alternatively, biological treatment methods have been paid more attention, which have advantages of low cost, simple operation and environmental friendliness.6,7 At present, a vast literature on biological treatments using bacteria, fungi and algae have been reported to efficiently decolorize azo dyes.8–10 Unfortunately, the study on biodecolorization of anthraquinone dyes is still insufficient and the effect is undesirable. For instance, Holkar et al.11 isolated a strain of Escherichia sp. F NCIM 5545, which just decolorized 50 mg L−1 reactive blue 19.
Herein, tea residue as a domestic waste biomass, was employed to boost the decolorization performance of anthraquinone dye reactive blue 19 (RB19) by a newly screened mixed bacterial flora DDMY2. The impacts of several parameters (namely, pH, temperature, initial dye concentration and tea residue concentration) on decolorization were systematically investigated. UV-Vis spectrophotometry, Fourier transform infrared spectrometry (FTIR) and liquid chromatography/time-of-flight/mass spectrometry (LC-TOF-MS) were used to detect the biodegradation products of RB19. In addition, high-throughput sequencing revealed the microbial community structures of initial flora DDMY2 (not domesticated by tea residue) and flora DDMY2 (domesticated by tea residue for 12 months). The possible functional bacterial groups activated by tea residue were also speculated. These findings can provide new insights and extend the knowledge of biodegradation towards anthraquinone dyes. Moreover, this study can enlarge the utilization of waste biomass tea residue in industrial wastewater treatment.
2. Materials and methods
2.1. Chemicals and culture medium
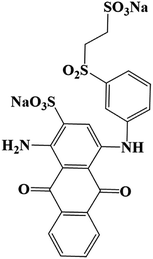
Commercial grade reactive blue 19 (CAS No. 2580-78-1, MW 626.54, λmax = 596 nm) was purchased from Sigma-Aldrich (USA). All other chemicals and reagents were of analytical grade, except for dichloromethane (HPLC level). The culture medium (CM medium) consisted of NH4Cl (0.20 g L−1), Na2SO4 (0.50 g L−1), KH2PO4 (2.66 g L−1) provided from Sinopharm Chemical Reagent (Shanghai) Co., Ltd. and yeast extract (3.00 g L−1) obtained from Sangon Biotech (Shanghai) Co., Ltd. Tea residue was made from West Lake Longjing tea (Hangzhou, China) which was repeatedly brewed at 80 °C until tea soup became colorless. The culture medium and tea residue were sterilized under the condition of 121 °C, 0.12 MPa for 20 min.2.2. Screening of RB19 decolorizing bacterial flora DDMY2
RB19 decolorizing bacterial flora DDMY2 was screened from activated sludge taken from Songjiang sewage treatment plant (Songjiang, Shanghai, China). Through continuously increasing the dye concentration in the CM medium, activated sludge suspension (10%, v/v) was used to decolorize 300 mg L−1 RB19 until the decolorization rate reached more than 70% (ESI† Text S1). The obtained dye decolorizing bacterial flora was named as DDMY2.2.3. Experiments on enhancement effect of tea residue
In order to investigate the enhancement effect of tea residue, eight groups were carried out and they were dye + distilled water (DD), dye + medium (DM), dye + distilled water + flora DDMY2 (DDM), dye + medium + flora DDMY2 (DMF), medium (M), dye + medium + tea residue (DMT), dye + distilled water + flora DDMY2 + tea residue (DDFT), dye + medium + flora DDMY2 + tea residue (DMFT), respectively. The inoculation of flora DDMY2 was 10% (v/v) and the culture was incubated at 37 °C under static condition. After regular intervals for 24 h, aliquots (2 mL) were collected and centrifuged at 6200 × g for 10 min. Subsequently, the obtained supernatant was analyzed by UV-vis spectrophotometer (IMPLEN, German). Decolorization rates were measured according to the method described by Xie et al.122.4. Decolorization assay
The capacity of decolorizing RB19 by bacterial flora DDMY2 at varying conditions was assessed. The culture media were amended/incubated with different pH values (4.0–9.0), temperatures (30–45 °C) and initial dye concentrations (50–500 mg L−1), respectively. Different concentrations of tea residue had also been chosen (0–6 g L−1) to investigate the enhancement effect. If not specified, concentration of tea residue and RB19 are respective 3 g L−1 and 300 mg L−1. The inoculation, culture conditions and the method for determination of decolorization rates were the same as those in Section 2.3.2.5. Biodegradation products analysis
The culture medium containing RB19 and its decolorizing solution were harvested and centrifuged at 6200 × g for 10 min to obtain the supernatant. Afterwards, the supernatant was scanned through UV-vis spectrophotometry. FTIR analysis was performed to determine the changes in functional groups of dye before and after decolorization. The preparation steps are shown in ESI† Text S2. Prepared samples were measured on NICOLET 6700 spectrophotometer (Thermo, America) in the mid-IR region of 600–4000 cm−1 with 16-scan speed at room temperature. Besides, the biodegradation products after decolorization were also analyzed by liquid chromatography/time-of-flight/mass spectrometry (LC-TOF-MS, Agilent QTOF6520, USA). The test information is shown in ESI† Text S3.2.6. High-throughput sequencing analysis
Microbial community structures of initial flora DDMY2 (not domesticated by tea residue, sample initial-DDMY2) and flora DDMY2 (domesticated by tea residue for 12 months) were investigated via high-throughput sequencing method reported by Xie et al.12 The specific experimental procedures are mentioned in ESI† Text S4 and all sequences had been deposited in the NCBI GenBank with accession no. SRP132025.2.7. Statistical analysis
All experiments and measurements were conducted in triplicate. All data were shown as the means ± standard deviations. The Student “t” test or one-way analysis of variance (ANOVA) was used to evaluated significant differences of two levels of a single factor or more than two levels of a single factor, respectively. The level p-value ≤ 0.05 was regarded to be statistically significant and the level p-value ≤ 0.01 was considered to be highly significant.3. Results and discussion
3.1. Decolorization performance of flora DDMY2
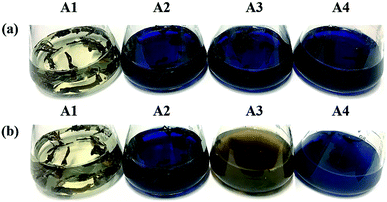
It took 150 generations (12 months) to possess the decolorizing bacterial flora DDMY2 through the method of dye gradient pressure domestication. The obtained flora DDMY2 had efficient decolorization performance of RB19 (300 mg L−1) and its efficiency reached up to 98% with tea residue after 48 h. From Fig. 1, it was obvious that the dark blue colored dye changed to light yellow-brown in the presence of flora DDMY2 and tea residue (group A3), speculating RB19 was decolorized which might be caused by either adsorption or degradation. Comparing group A1 (medium + tea residue) with group A2 (RB19 + medium + tea residue), both of them showed no significant color change (p-value = 0.241) and the color removal of group A2 after 48 h was only 2.52 ± 0.56%, indicating the adsorption of tea residue could be negligible. The group A4 with heat-inactivated flora DDMY2 (inactivated in a high-pressure steam sterilization pot at 121 °C, 0.12 MPa for 20 min), medium, tea residue and RB19 was just 6.54 ± 1.09% of decolorization after 48 h. Thus, the contribution of abiotic process (e.g. chemical degradation and adsorption of heat-inactivated flora DDMY2) for RB19 removal can be excluded.13 Summing up the above, the decolorization of RB19 was attributed to the biodegradation by flora DDMY2 with tea residue.3.2. Enhancement effect of tea residue
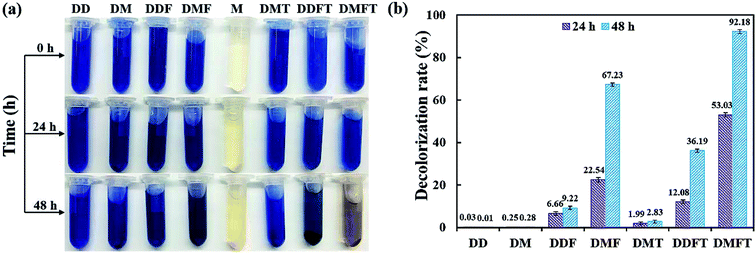
The confirmatory study on the enhancement effect of tea residue towards RB19 decolorization by flora DDMY2 was carried out. From Fig. 2a, it showed that only the group DMFT (dye + medium + flora DDMY2 + tea residue) was notably decolorized from dark blue to light orange, followed by group DMF (dye + medium + flora DDMY2), which was lightly decolorized to light blue. The difference between these two groups was due to the addition of tea residue (p-value = 0.003). Combined with Fig. 2b, group DMFT had the highest decolorization rate of 92.18 ± 0.98% after 48 h, followed by group DMF (67.23 ± 0.82%). The 24.95% increase demonstrated tea residue played a vital role in boosting decolorization and had a strong enhancement effect. Decolorization rates of group DDF (dye + distilled water + flora DDMY2) and group DDFT (dye + distilled water + flora DDMY2 + tea residue) were 9.22 ± 0.79% and 36.19 ± 0.75%, respectively. It proved that flora DDMY2 could be also promoted by tea residue without any other nutrients (p-value = 0.002), but the effect was limited. Compared with group DMF (dye + medium + flora DDMY2), group DM (dye + medium) had the decolorization rate of 0.28 ± 0.07%, suggesting decolorization required the action of flora DDMY2 and it made a highly significant contribution (p-value < 0.01). In addition, group DMT (dye + medium + tea residue) was only with decolorization rate of 2.83 ± 0.58%, manifesting tea residue could not be used as adsorbent to remove RB19 as described in Section 3.1. This finding was different from existing research that tea residue was used as adsorbent to remove dyes.14,15 Based on our previous work, through single factor and orthogonal experimental analysis of common substances in tea residue, epigallocatechin gallate was deciphered to be the key active component which was responsible for the enhancement effect on the decolorization performance by activating the functional bacteria.163.3. Effects of physico–chemical parameters on decolorization performance of DDMY2
3.4. Analysis of biodegradation products
The UV-vis spectra full-wavelength scanning results of the decolorizing solution during the decolorization process were collected. Fig. 4a showed that from 0 h to 48 h, a peak centered at 596 nm decreased, which was the characteristic absorption peak representing RB19. Especially, at 48 h, the characteristic peak intensity almost completely disappeared. Simultaneously, two new absorption peaks centered at 465 nm and 485 nm appeared and amplified gradually. Finally, they reached the highest intensity at 48 h. After another 48 h, the newly generated peaks centered at 465 nm and 485 nm began to decrease, demonstrating these intermediates were further degraded by flora DDMY2. Xu et al.32 reported that bacteria degraded dyes into intermediates which were further transformed into final products.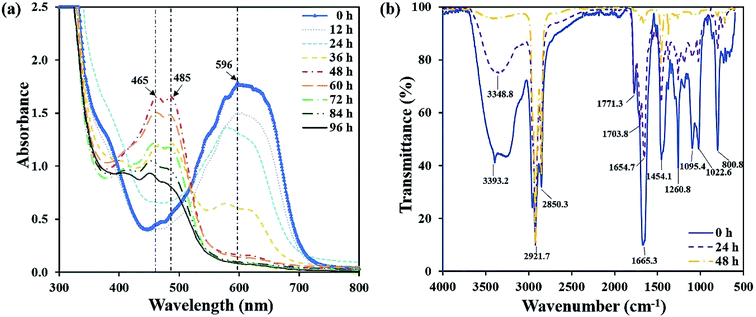 | ||
| Fig. 4 UV-vis spectra full-wavelength scanning of the decolorization process (a), and FTIR spectra at different time of the decolorization process (b). | ||
The FTIR spectra of RB19 differed significantly before and after decolorization, which indicated there was biodegradation in the decolorization process (Fig. 4b). The spectrum of 0 h showed the prominent absorption peak at 3393.2 cm−1 for stretching vibration of N–H on –NH2, which was the primary amino group in RB19.33 As decolorization proceeded, the peak 3393.2 cm−1 decreased significantly and disappeared completely after 48 h, indicating that the primary amino group –NH2 converted to secondary amino group –NH. The peaks at 2921.7 cm−1 and 2850.3 cm−1 represented the symmetry and asymmetry of C–H on alkane (–CH2–) stretching vibration and their intensity became higher after 48 h. The peak 1665.3 cm−1 was the C![[double bond, length as m-dash]](https://www.rsc.org/images/entities/char_e001.gif) O stretching vibration, which represented the vibration of the carbonyl group in the anthraquinone structure of RB19. It decreased gradually over time, indicating the anthraquinone group was degraded in this process. The peak 1454.1 cm−1 was the deformation vibration of C–H on –CH2. The peak at 1260.8 cm−1 represented C–N stretching vibration on the benzene ring. The peaks at 1095.4 cm−1 and 1022.6 cm−1 represented S
O stretching vibration, which represented the vibration of the carbonyl group in the anthraquinone structure of RB19. It decreased gradually over time, indicating the anthraquinone group was degraded in this process. The peak 1454.1 cm−1 was the deformation vibration of C–H on –CH2. The peak at 1260.8 cm−1 represented C–N stretching vibration on the benzene ring. The peaks at 1095.4 cm−1 and 1022.6 cm−1 represented S![[double bond, length as m-dash]](https://www.rsc.org/images/entities/char_e001.gif) O stretching vibration,34 which came from the sulfoxide group of RB19. These decreased and absent absorption peaks revealed bonds between anthraquinone ring and benzene ring were broken and RB19 had been decomposed by flora DDMY2, thereby greatly improved the biodegradability, which was beneficial for further treatment.
O stretching vibration,34 which came from the sulfoxide group of RB19. These decreased and absent absorption peaks revealed bonds between anthraquinone ring and benzene ring were broken and RB19 had been decomposed by flora DDMY2, thereby greatly improved the biodegradability, which was beneficial for further treatment.
The products came from flora DDMY2 decolorizing RB19 for 48 h were analyzed by LC-TOF-MS. From these results, a total of three major metabolites were identified in the positive and negative ion modes. The first product was detected in positive ion mode, presenting the peak retention time (14.629 min) and the mass-to-charge ratio (m/z 102.1200) (Fig. S1a–c†). Compared the mass spectrum with the NIST library, it was confirmed to be hexan-1-amine with a matching degree of 85.89% (Table 1), which was decomposed from RB19 by the biochemical action of flora DDMY2. The amines came from RB19 decolorization were also found by Vasconcelos et al.35 In the negative ion mode, the separation effect was obvious and there were four distinct ion peaks which were detected mainly concentrated in 9–10 min (Fig. S1d†). The peaks retention time of 10.020 min and 9.458 min (Fig. S1e and f†) corresponded to m/z 156.9900 and 194.9500, respectively (Fig. S1g and h†). The former was identified as benzenesulfonate ion with a matching degree of 90.01% and the latter was regarded as 3,6-dihydroxyphthalic acid with a matching degree of 83.50% (Table 1), which was formed by the quinone ring opening. Products of similar structures were often reported, such as dibutyl phthalate and 2,6-di-tert-butyl-4 methyl-phenol were detected by Castillo and Barcelo.36
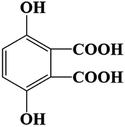
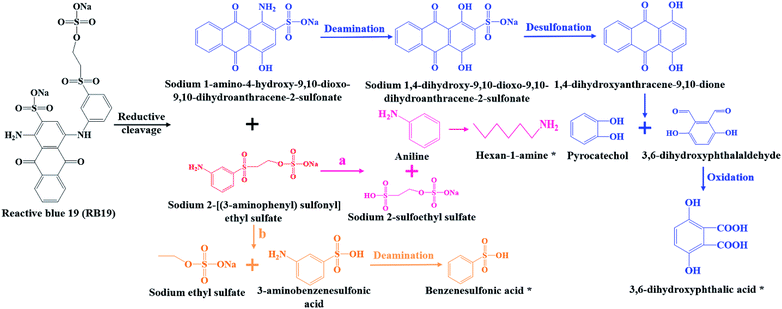
Combined UV-Vis, FTIR and LC-TOF-MS analysis results, the chemical transformation process of RB19 by flora DDMY2 under the activation of tea residue was deduced in Fig. 5. The dye RB19 was directly hydrolyzed into sodium 1-amino-4-hydroxy-9,10-dioxo-9,10-dihydroanthracene-2-sulfonateand and sodium 2-[(3-aminophenyl) sulfonyl] ethyl sulfate. The former was determinated by Bilal et al.37 in photo-assisted catalytic degradation of RB19. The latter was also revealed by Fanchiang and Tseng38 in degradation of RB19. Subsequently, the amino group of sodium 1-amino-4-hydroxy-9,10-dioxo-9,10-dihydroanthracene-2-sulfonateand transformed into hydroxy group by hydrolysis or aromatic substitution to form sodium 1,4-dihydroxy-9,10-dioxo-9,10-dihydroanthracene-2-sulfonate, which was certified by McCallum et al.39 Then, the 1,4-dihydroxyanthracene-9,10-dione formed by desulfonation, which was detected by Ghazalian et al.40 in visible light photocatalytic degradation of RB19. With the process going on, the quinone ring further opened and formed pyrocatechol and 3,6-dihydroxyphthalaldehyde. The pyrocatechol was shown in the electro-Fenton process for degradation of RB19.41 The 3,6-dihydroxyphthalaldehyde was oxidized to 3,6-dihydroxyphthalic acid which had been detected in this study. For sodium 2-[(3-aminophenyl) sulfonyl] ethyl sulfate, it could be seen that there might be two possible metabolic pathways. In one way, sodium 2-[(3-aminophenyl) sulfonyl] ethyl sulfate was hydrolyzed into aniline and sodium 2-sulfoethyl sulfate, where aniline was found by He et al.42 in mineralization of RB19 by ozonation combined with sonolysis. The benzene ring of aniline was further opened and converted to hexan-1-amine found in this work. In the other way, sodium 2-[(3-aminophenyl) sulfonyl] ethyl sulfate might be hydrolyzed into 3-aminobenzenesulfonic acid and sodium ethyl sulfate. Subsequently, 3-aminobenzenesulfonic acid was transformed into benzenesulfonic acid by deamination, which was discovered in this research. The whole degradation pathway of RB19 by flora DDMY2 under the activation of tea residue was firstly described in this paper.
3.5. Microbial community structure analysis
High-throughput sequencing analysis was used to reveal the microbial community structures of sample intial-DDMY2 and sample DDMY2, which produced 40![[thin space (1/6-em)]](https://www.rsc.org/images/entities/char_2009.gif) 066 and 38
066 and 38![[thin space (1/6-em)]](https://www.rsc.org/images/entities/char_2009.gif) 685 sequence tags, respectively. Of these produced sequence tags, 34
685 sequence tags, respectively. Of these produced sequence tags, 34![[thin space (1/6-em)]](https://www.rsc.org/images/entities/char_2009.gif) 628 reads were randomly selected for further study. In addition, a total of 24 and 33 OTUs were individually obtained from initial-DDMY2 and DDMY2 with clustering at a 3% dissimilarity level. The rarefaction curve can be used to compare the richness, uniformity or diversity of samples and indicate whether the reads of samples are reasonable. In this study, the Sobs rarefaction curves became relatively flat with the increase of sequences (Fig. S2a†), indicating the results were reasonable and exact.43 Based on the Shannon rarefaction curves (Fig. S2b†), sample DDMY2 had the higher community diversity.
628 reads were randomly selected for further study. In addition, a total of 24 and 33 OTUs were individually obtained from initial-DDMY2 and DDMY2 with clustering at a 3% dissimilarity level. The rarefaction curve can be used to compare the richness, uniformity or diversity of samples and indicate whether the reads of samples are reasonable. In this study, the Sobs rarefaction curves became relatively flat with the increase of sequences (Fig. S2a†), indicating the results were reasonable and exact.43 Based on the Shannon rarefaction curves (Fig. S2b†), sample DDMY2 had the higher community diversity.
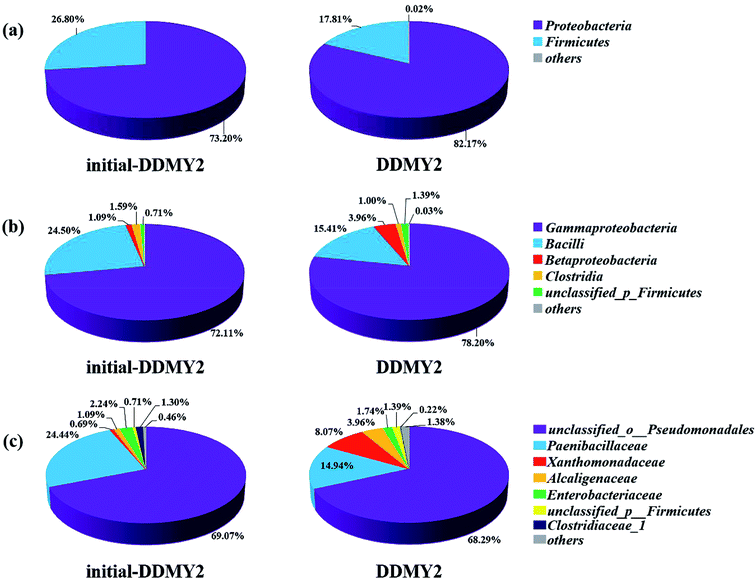
In order to further analyze the community composition of sample initial-DDMY2 and sample DDMY2 at different taxonomic levels, sequences were divided into different taxonomic classifications through RDP classifier. On classification of phylum level (Fig. 6a), two phyla Proteobacteria and Firmicutes were detected separately in two samples, which were frequently discovered in the dye biodegradation systems.44,45 Proteobacteria was richer than Firmicutes in two samples and the proportion of Proteobacteria increased under the activation of tea residue, indicating Proteobacteria might be enriched by tea residue and played vital roles in RB19 biodegradation. On the class level (Fig. 6b), Gammaproteobacteria (72.11% and 78.20%, respectively) was the absolutely dominant class in sample initial-DDMY2 and sample DDMY2, followed by Bacilli (24.50% and 15.41%, respectively), Betaproteobacteria (1.09% and 3.96%, respectively), etc. Gammaproteobacteria was widely presented in the hydrolytic acidification process of dyeing wastewater treatment.46 Bacilli and Betaproteobacteria were also reported to exist in simulated printing wastewater reactors.43 Further analysis was carried out to reveal the microbial community abundance on the family level (Fig. 6c). The unclassified_o_Pseudomonadales was the predominant family in initial-DDMY2 and DDMY2, which occupied 69.07% and 68.29%, respectively. The proportions were nearly no change. However, the classes with greater abundance variation in initial-DDMY2 and DDMY2 were Paenibacillaceae (24.44% and 14.94%, respectively) and Xanthomonadaceae (0.69% and 8.07%, respectively).
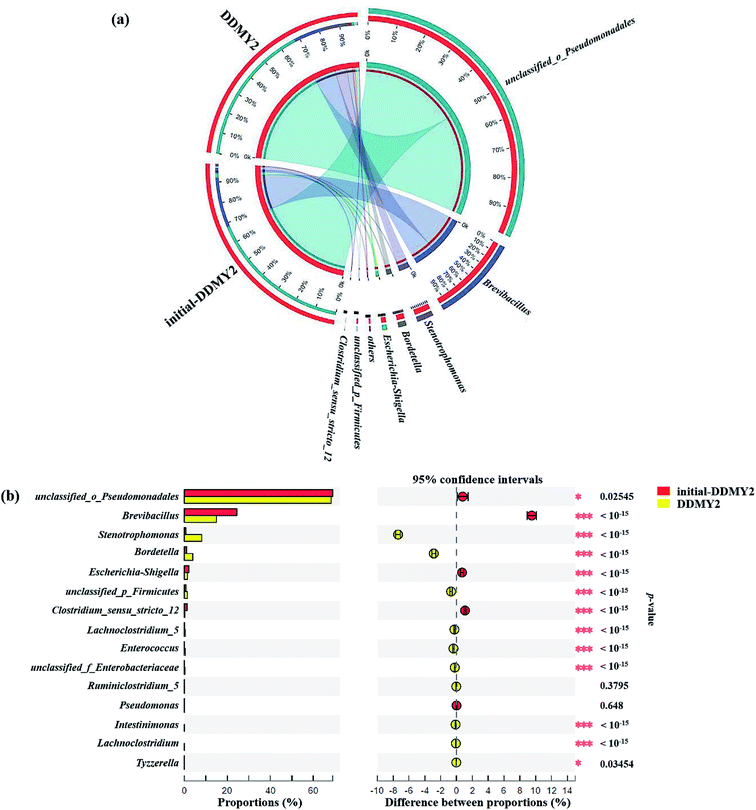
The Circos map showed the profiles of genus in sample initial-DDMY2 and sample DDMY2. As shown in Fig. 7a, seven genera accounting for more than 1% were detected. Among them, unclassified_o_Pseudomonadales made up the largest proportions (69.07% and 68.29%, respectively) of the total effective sequences in sample initial-DDMY2 and sample DDMY2, followed by Brevibacillus (24.44% and 14.94%, respectively), Stenotrophomonas (0.69% and 8.07%, respectively) and Bordetella (1.09% and 3.96%, respectively). It has been found that the consortium of bacteria, including Brevibacillus, was used to decolorize textile industry effluent.47 What's more, Stenotrophomonas had also been reported to have the ability to decolorize azo dye Xylene Fast Yellow 2G.48 In order to more intuitively observe the changes in the proportions of genera belonging to sample initial-DDMY2 and sample DDMY2, the Fisher' exact test bar plot was shown in Fig. 7b. Compared initial-DDMY2 with DDMY2, the percentages of unclassified_o_Pseudomonadales, Brevibacillus, Escherichia–Shigella, Clostridium_sensu_stricto_12 and Pseudomonas in sample DDMY2 decreased. The decreasing amplitudes of them were not significant (except for Brevibacillus), and unclassified_o_Pseudomonadales and Brevibacillus might play a certain role in decolorization because of their lager proportions. However, Stenotrophomonas and Bordetella increased remarkably (increased by 7.38% and 2.87%, respectively), which related to the enhancement effect of tea residue. The remaining eight genera only showed a slight increase. Hence, it was speculated that unclassified_o_Pseudomonadales, Brevibacillus, Stenotrophomonas and Bordetella might be mainly responsible for decolorizing RB19 by DDMY2 under activation of tea residue.
4. Conclusions
Bacterial flora DDMY2 possessed high decolorization performance towards RB19 under the activation of tea residue. Flora DDMY2 activated by tea residue could efficiently decolorize RB19 under conditions with wide ranges of pH values, temperatures and initial dye concentrations. Concentration of tea residue also had significant effect on decolorization performance. UV-vis, FTIR and LC-TOF-MS results indicated RB19 was degraded into small organics and the possible degradation pathway was speculated. High-throughput sequencing results revealed the changes in the community structures of initial-DDMY2 and DDMY2, of which unclassified_o_Pseudomonadales, Brevibacillus, Stenotrophomonas and Bordetella might be activated by tea residue. These findings could provide new insights of biodegradation process of anthraquinone dyes by bacterial flora, and broaden our knowledge of utilization of tea residue in the treatment of industrial dyeing wastewater.Conflicts of interest
There are no conflicts to declare.Acknowledgements
The authors acknowledge the financial support by the Fundamental Research Funds for the Central Universities (2232018G-11, 2232019D3-22), the National Key Research and Development Program of China (Grant No. 2016YFC0400501), the Graduate Student Innovation Fund of Donghua University (CUSF-DH-D-2019078), Anhui Provincial Natural Science Foundation (1808085QE176), the scientific research program of Anhui Provincial Education Department (KJ2018A0444) and the Suzhou University Startup Foundation for Doctor (2016jb04), the “Chenguang Program” supported by Shanghai Education Development Foundation and Shanghai Municipal Education Commission (No. 16CG40). This work was partially supported by Shanghai Leading Academic Discipline Project (B604).References
- J. H. Franco, B. F. da Silva, R. V. Oliveira, G. Meireles, D. P. de Oliveira, A. A. de Castro, T. C. Ramalho and M. V. B. Zanoni, Sci. Total Environ., 2018, 613, 1093–1103 CrossRef PubMed.
- A. B. dos Santos, F. J. Cervantes and J. B. van Lier, Bioresour. Technol., 2007, 98, 2369–2385 CrossRef CAS PubMed.
- Q. Zhang, X. Xie, Y. Liu, X. Zheng, Y. Wang, J. Cong, C. Yu, N. Liu, J. Liu and W. Sand, Bioresour. Technol., 2019, 280, 430–440 CrossRef CAS PubMed.
- N. d. C. Lima Beluci, G. A. Pisano Mateus, C. S. Miyashiro, N. C. Homem, R. G. Gomes, M. R. Fagundes-Klen, R. Bergamasco and A. M. Salcedo Vieira, Sci. Total Environ., 2019, 664, 222–229 CrossRef PubMed.
- C. Wu, Y. Zhou, X. Sun and L. Fu, Environ. Sci. Pollut. Res., 2018, 25, 8315–8329 CrossRef CAS PubMed.
- T. Ito, Y. Adachi, Y. Yamanashi and Y. Shimada, Water Res., 2016, 100, 458–465 CrossRef CAS PubMed.
- K. Vikrant, B. S. Giri, N. Raza, K. Roy, K.-H. Kim, B. N. Rai and R. S. Singh, Bioresour. Technol., 2018, 253, 355–367 CrossRef CAS PubMed.
- A. Ghosh, M. G. Dastidar and T. R. Sreekrishnan, Int. Biodeterior. Biodegrad., 2017, 119, 448–460 CrossRef CAS.
- E. J. R. Almeida and C. R. Corso, Int. J. Environ. Sci. Technol., 2019, 16, 1319–1328 CrossRef CAS.
- K. Behl, S. Sinha, M. Sharma, R. Singh, M. Joshi, A. Bhatnagar and S. Nigam, Chem. Eng. J., 2019, 364, 552–561 CrossRef CAS.
- C. R. Holkar, A. B. Pandit and D. V. Pinjari, Bioresour. Technol., 2014, 173, 342–351 CrossRef CAS PubMed.
- X. Xie, N. Liu, J. Ping, Q. Zhang, X. Zheng and J. Liu, Chemosphere, 2018, 201, 578–585 CrossRef CAS PubMed.
- Y.-N. Liu, F. Zhang, J. Li, D.-B. Li, D.-F. Liu, W. W. Li and H.-Q. Yu, Environ. Sci. Technol., 2017, 51, 8616–8623 CrossRef CAS PubMed.
- B. Naraghi, F. Zabihi, M. R. Narooie, M. Saeidi and H. Biglari, Electronic Physician, 2017, 9, 4312–4321 CrossRef PubMed.
- C. S. Patil, D. B. Gunjal, V. M. Naik, N. S. Harale, S. D. Jagadale, A. N. Kadam, P. S. Patil, G. B. Kolekar and A. H. Gore, J. Cleaner Prod., 2019, 206, 407–418 CrossRef CAS.
- X. Zheng, X. Xie, C. Yu, Q. Zhang, Y. Wang, J. Cong, N. Liu, Z. He, B. Yang and J. Liu, Chemosphere, 2019, 233, 110–119 CrossRef CAS PubMed.
- S. Sang, J. D. Lambert, C.-T. Ho and C. S. Yang, Pharmacol. Res., 2011, 64, 87–99 CrossRef CAS PubMed.
- C.-C. Chen, C.-Y. Chen, C.-Y. Cheng, P.-Y. Teng and Y.-C. Chung, J. Hazard. Mater., 2011, 196, 166–172 CrossRef CAS PubMed.
- A. U. Chaudhari, D. Paul, D. Dhotre and K. M. Kodam, Water Res., 2017, 122, 603–613 CrossRef CAS PubMed.
- K. Rybczynska-Tkaczyk, A. Swiecilo, K. A. Szychowski and T. Kornillowicz-Kowalska, Ecotoxicol. Environ. Saf., 2018, 147, 776–787 CrossRef CAS PubMed.
- E. Rahimi, Y. D. Shahamat, B. Kamarehei, A. Zafarzadeh and M. R. Khani, Int. J. Environ. Sci. Technol., 2018, 15, 1941–1948 CrossRef CAS.
- C. Zhang, H. Diao, F. Lu, X. Bie, Y. Wang and Z. Lu, Bioresour. Technol., 2012, 126, 80–86 CrossRef CAS PubMed.
- S. Hussain, Z. Maqbool, S. Ali, T. Yasmeen, M. Imran, F. Mahmood and F. Abbas, Ecotoxicol. Environ. Saf., 2013, 98, 331–338 CrossRef CAS PubMed.
- H. Wang, J. Q. Su, X. W. Zheng, Y. Tian, X. J. Xiong and T. L. Zheng, Int. Biodeterior. Biodegrad., 2009, 63, 395–399 CrossRef CAS.
- F. Mahmood, M. Shahid, S. Hussain, T. Shahzad, M. Tahir, M. Ijaz, A. Hussain, K. Mahmood, M. Imran and S. A. K. Babar, Bioresour. Technol., 2017, 235, 176–184 CrossRef CAS PubMed.
- Z. Wang, Q. Yin, M. Gu, K. He and G. Wu, J. Hazard. Mater., 2018, 357, 226–234 CrossRef CAS PubMed.
- C. R. Holkar, A. J. Jadhav, D. V. Pinjari, N. M. Mahamuni and A. B. Pandit, J. Environ. Manage., 2016, 182, 351–366 CrossRef CAS PubMed.
- R. Liu, X. Lu, Q. Tian, B. Yang and J. Chen, Desalination, 2011, 271, 287–294 CrossRef CAS.
- J. Krishnan, A. A. Kishore, A. Suresh, B. Madhumeetha and D. G. Prakash, Int. Biodeterior. Biodegrad., 2017, 119, 16–27 CrossRef CAS.
- L. Fu, Y.-N. Bai, Y.-Z. Lu, J. Ding, D. Zhou and R. J. Zeng, J. Hazard. Mater., 2019, 364, 264–271 CrossRef CAS PubMed.
- C. R. Holkar, H. Arora, D. Halder and D. V. Pinjari, Int. Biodeterior. Biodegrad., 2018, 133, 194–201 CrossRef CAS.
- M. Xu, X. Zhong, W. Cao, J. Guo, Y. Cen and G. Sun, Microbiology., 2005, 32, 5–9 CAS.
- Z. Khan, K. Jain, A. Soni and D. Madamwar, Int. Biodeterior. Biodegrad., 2014, 94, 167–175 CrossRef CAS.
- N. Liu, X. Xie, B. Yang, Q. Zhang, C. Yu, X. Zheng, L. Xu, R. Li and J. Liu, Environ. Sci. Pollut. Res., 2017, 24, 252–263 CrossRef CAS PubMed.
- V. M. Vasconcelos, F. L. Migliorini, J. R. Steter, M. R. Baldan, N. G. Ferreira and M. R. d. V. Lanza, J. Environ. Chem. Eng., 2016, 4, 3900–3909 CrossRef CAS.
- M. Castillo and D. Barcelo, Anal. Chim. Acta, 2001, 426, 253–264 CrossRef CAS.
- M. Bilal, T. Rasheed, H. M. N. Iqbal, C. Li, H. Wang, H. Hu, W. Wang and X. Zhang, Chem. Eng. Res. Des., 2018, 129, 384–390 CrossRef CAS.
- J.-M. Fanchiang and D.-H. Tseng, Chemosphere, 2009, 77, 214–221 CrossRef CAS PubMed.
- J. E. B. McCallum, S. A. Madison, S. Alkan, R. L. Depinto and R. U. R. Wahl, Environ. Sci. Technol., 2000, 34, 5157–5164 CrossRef CAS.
- E. Ghazalian, N. Ghasemi and A. R. Amani-Ghadim, J. Mol. Catal. A: Chem., 2017, 426, 257–270 CrossRef CAS.
- Z. He, C. Gao, M. Qian, Y. Shi, J. Chen and S. Song, Ind. Eng. Chem. Res., 2014, 53, 3435–3447 CrossRef CAS.
- Z. He, L. Lin, S. Song, M. Xia, L. Xu, H. Ying and J. Chen, Sep. Purif. Technol., 2008, 62, 376–381 CrossRef CAS.
- X. Xie, N. Liu, B. Yang, C. Yu, Q. Zhang, X. Zheng, L. Xu, R. Li and J. Liu, Int. Biodeterior. Biodegrad., 2016, 111, 14–21 CrossRef CAS.
- K. H. Balapure, K. Jain, S. Chattaraj, N. S. Bhatt and D. Madamwar, J. Hazard. Mater., 2014, 279, 85–95 CrossRef CAS PubMed.
- F. Pan, Y. Yu, A. Xu, D. Xia, Y. Sun, Z. Cai, W. Liu and J. Fu, J. Hazard. Mater., 2017, 340, 36–46 CrossRef CAS PubMed.
- Q. Yang, J. Wang, H. Wang, X. Chen, S. Ren, X. Li, Y. Xu, H. Zhang and X. Li, Bioresour. Technol., 2012, 117, 155–163 CrossRef CAS PubMed.
- M. B. Kurade, T. R. Waghmode, J.-Q. Xiong, S. P. Govindwar and B.-H. Jeon, J. Cleaner Prod., 2019, 213, 884–891 CrossRef CAS.
- W. Feng, P. Song, Y. Zhang and Z. Dong, in Advances in Applied Biotechnology, VOL II, ed. T. C. Zhang and M. Nakajima, 2015, vol. 333, pp. 109–116 Search PubMed.
Footnote |
| † Electronic supplementary information (ESI) available. See DOI: 10.1039/c9ra04507d |
| This journal is © The Royal Society of Chemistry 2019 |

