DOI:
10.1039/C9RA04429A
(Paper)
RSC Adv., 2019,
9, 28439-28450
Fast response–recovery time toward acetone by a sensor prepared with Pd doped WO3 nanosheets†
Received
12th June 2019
, Accepted 25th August 2019
First published on 10th September 2019
Abstract
Pd-WO3 nanosheets were synthesized through a one-step hydrothermal method using Na2PdCl4 solution as the palladium source and sodium tungstate as the tungsten source, and were used to detect acetone. After being characterized by TEM, XRD, BET and XPS, it was found that Pd doped on the surface of WO3 nanosheets was mainly present as metal palladium, and the specific surface area increased after doping. In addition, the effect of Pd doping on gas sensing properties was studied. When the Pd-doped amount was 2 at%, sensors fabricated with the composites had the best gas sensing performance. Under a 100 ppm acetone atmosphere, the response time was 1 s and the recovery time was 9 s. The detection limit for acetone was 50 ppb at the optimum working temperature of 300 °C, and the selectivity for acetone was excellent under 100 ppm atmosphere (Sacetone/Sethanol = 5.06). The excellent gas sensing properties of this material are mainly attributed to the high catalytic activity and the catalytic spill-over effect of the Pd nanoparticles, which provided additional active sites for the sensitive materials.
Introduction
As society has developed, the emission of volatile organic compounds (VOCs) such as acetone, formaldehyde and toluene has increased, which seriously endangers human health.1,2 For instance, it was found that some trace VOCs present in human breath are indicators for different diseases. For example, the marker gas for type-1 diabetes is acetone (>1.8 ppm),3 so there is great practical significance and value in developing gas sensors to rapidly monitor acetone gas.4,5 Therefore, it is becoming increasingly important to study various methods and technologies to rapidly detect and monitor VOCs.2,3,6,7
Currently, gas sensors are widely used as cost-effective detection methods, and metal oxide semiconductor (MOS) gas sensor are inexpensive, easily integrated and have long service lives. These advantages arise from the change in conductivity caused by the interaction between gas molecules and the surface of metal oxide semiconductors (MOS).8 WO3 is a typical n-type semiconductor with great potential for the detection of harmful and toxic gases such as acetone, CO, NO2, H2S and NH3.9–11 However, it is difficult for pure WO3 to simultaneously have a fast acetone response–recovery, a low detection limit and a high selectivity. By increasing the specific surface area of the sensing material, modifying its the surface and adjusting its defects, its gas sensing performance can be greatly improved.12–14 Surface modification of materials is an effective method to improve the gas sensing performance of gas sensors, and the morphology also has some influence. Compared with other structures,15–17 nanosheets have many advantages, such as large specific surface areas, abundant surface adsorption centers and unique electronic transmission performance.18 While they have broad application prospects in gas sensors, Pd-WO3 nanosheets composites with fast response–recovery time have rarely been reported for gas sensing applications.
In this paper, Pd-WO3 nanosheets composites were prepared by one-step hydrothermal method. It was found that the sensors fabricated with the composites had a fast response, low detection limit, high selectivity and high sensitivity. This is due to Pd nanoparticles on the surface of the WO3 nanosheets, thus providing more active sites for acetone reaction. The catalytic spill-over effect of precious metal Pd reduced the activation energy required for the reaction and the response–recovery time.
Experimental section
Materials
Sodium tungstate dehydrate (Na2WO4·2H2O, 99.5%), sodium tetrachloropalladate(II) (AR), citric acid (CA, >99.5%), D-(+)-glucose (AR), hydrochloric acid (36–38%, AR) and liquid chemicals (including methanal, methanol, ethanol, aqua ammonia, acetone, toluene, and n-hexane) were purchased from Sinopharm Chemical Reagent Co. Ltd, China. All reagents used in our experiments were of analytical grade and used without further purification.
Synthesis
WO3 and Pd-WO3 nanosheets were synthesized through a hydrothermal method. In this work, a typical process was as follow:19 2 mmol of Na2WO4·2H2O was dissolved in 60 mL of deionized water to prepare a transparent solution, which was defined as solution A. After vigorous stirring, 3 mmol of citric acid and 10 mmol of glucose were added into solution A, which was defined as solution B. After vigorous stirring for 10 min, 3 mL of HCl solution (12 M) was added into solution B. The solution B was vigorous stirred for 30 min and transferred into a 100 mL Teflon-lined autoclave, which was then heated at 120 °C for 24 h. Keep the autoclave at room temperature until it had cooled, the resultant product was filtered, washed with water and anhydrous ethanol for three times. Finally, the product was dried at 60 °C in a vacuum oven for 12 h and annealing in a nitrogen atmosphere at 400 °C for 2 h. Pd-WO3 nanosheets were synthesized through a one-step hydrothermal method. For doping, different molar ratios of Na2WO4·2H2O and Na2PdCl4 (1 wt%) were dissolved in distilled water to get 1, 2, 3, 5 and 8 at% Pd-WO3 nanosheets. Other experimental steps were the same as above.
Characterization
X-ray powder diffraction (XRD) was performed using a Shimadzu XRD-6000 diffractometer with a CuKα1 irradiation over a 2θ range from 10 to 90° to analyze the crystal phases of the samples. The morphologies of the as-obtained products were characterized and analyzed by transmission electron microscope (TEM). High-resolution TEM (HR-TEM) images were obtained using a JEOL JEM-2100 microscopy, operated at an acceleration voltage of 200 kV, to characterize the sizes and crystal structures of WO3 and Pd-WO3 nanosheets. The surface areas were measured on a surface area analyzer (Micromeritics ASAP 2020 V3.00H) and calculated using the Brunauer–Emmett–Teller (BET) equation. X-ray photoelectron spectroscopy (XPS, K-alpha) was used to investigate electron configurations of the surfaces of WO3 and Pd-WO3 nanosheets.
Fabrication and test of the sensor
The as-synthesized products were ground and mixed with H2O, ethylene glycol, and glycerol (1![[thin space (1/6-em)]](https://www.rsc.org/images/entities/char_2009.gif) :2:2 mass ratio) to form a paste. Then, the paste was dropped and spot-coated onto an Al2O3 ceramic plate substrate (area of 8 mm × 10 mm × 0.65 mm), onto which a pair of Au interdigitated electrodes (electrode width of 0.2 mm and gap width of 0.2 mm) had been previously printed. Afterwards, the resulting chip was dried at 120 °C for 2 h, and then heated at 400 °C for another 2 h to anneal under nitrogen atmosphere to ensure all solvents were evaporated. The final sensor was obtained after aging at 200 °C for an additional 24 h. Finally, the gas sensing properties of the sensors were tested by a static measurement system produced by CGS-1TP (Beijing Elite Tech. Co., Ltd., China), which test chamber is 18 L. The measurement was processed by a static process in a test chamber with an ambient relative humidity of about 25% and room temperature near 25 °C. Statistics were performed on the resulting measurements. The sensor device and the measurement system are reported by our previous work.20,21 First, sensors were placed into the chamber and preheated to their operational temperature, then the evaporator was turned on for one minute, and a certain amount of measured VOCs were injected into the test chamber. The upper cover of the test bench was opened after the response reaching a constant value, then the sensor began to recover in air and the sensor response returned to the initial value. The response result of the sensor in this work was defined as S = Ra/Rg (the reducing gas) or Rg/Ra (the oxidizing gas), where Ra and Rg are the resistances of the sensor in air and the target gas, respectively. The response and recovery times were defined as the time required to reach 90% of the total resistance change in adsorption and desorption.22
:2:2 mass ratio) to form a paste. Then, the paste was dropped and spot-coated onto an Al2O3 ceramic plate substrate (area of 8 mm × 10 mm × 0.65 mm), onto which a pair of Au interdigitated electrodes (electrode width of 0.2 mm and gap width of 0.2 mm) had been previously printed. Afterwards, the resulting chip was dried at 120 °C for 2 h, and then heated at 400 °C for another 2 h to anneal under nitrogen atmosphere to ensure all solvents were evaporated. The final sensor was obtained after aging at 200 °C for an additional 24 h. Finally, the gas sensing properties of the sensors were tested by a static measurement system produced by CGS-1TP (Beijing Elite Tech. Co., Ltd., China), which test chamber is 18 L. The measurement was processed by a static process in a test chamber with an ambient relative humidity of about 25% and room temperature near 25 °C. Statistics were performed on the resulting measurements. The sensor device and the measurement system are reported by our previous work.20,21 First, sensors were placed into the chamber and preheated to their operational temperature, then the evaporator was turned on for one minute, and a certain amount of measured VOCs were injected into the test chamber. The upper cover of the test bench was opened after the response reaching a constant value, then the sensor began to recover in air and the sensor response returned to the initial value. The response result of the sensor in this work was defined as S = Ra/Rg (the reducing gas) or Rg/Ra (the oxidizing gas), where Ra and Rg are the resistances of the sensor in air and the target gas, respectively. The response and recovery times were defined as the time required to reach 90% of the total resistance change in adsorption and desorption.22
Results and discussions
Structure and micro-morphology characterization
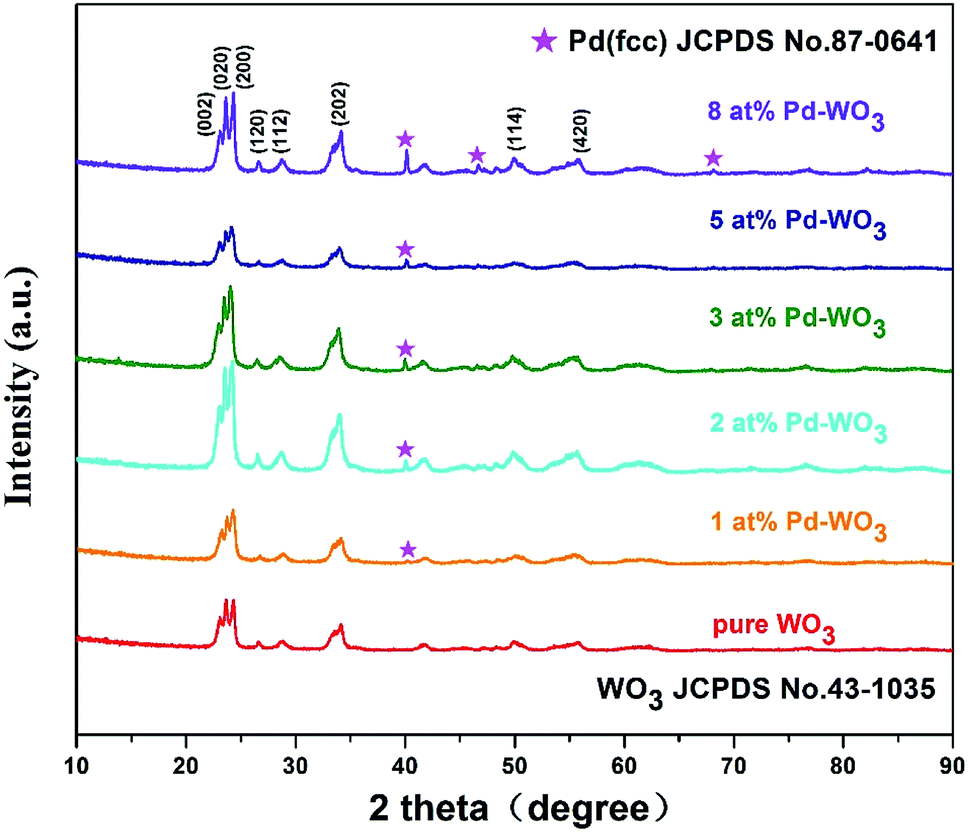
Fig. 1 showed the XRD patterns of the hydrothermally processed product when WO3 was doped with Pd (0, 1, 2, 3, 5 and 8 at%). Strong and sharp diffraction peaks are observed in this figure, which indicates that the samples are highly crystalline. The XRD pattern in Fig. 1 shows that all diffraction peaks in the spectrum of the as-prepared samples can be well indexed to a monoclinic phase of WO3 (JCPDS no. 43-1035; a = 0.7297 nm, b = 0.7539 nm, c = 0.7688 nm, β = 90.91°), corresponding to the following planes: (002), (020), (200), (120), (112), (202), (114) and (420), respectively.23 The clear reflections were assigned to the orthorhombic phase of WO3. Furthermore, peaks of the Pd nanoparticles are also observed in the spectrum, indicating that the Pd was loaded onto the surface of WO3. The XRD pattern of Pd-WO3 nanoparticles confirms that Pd was presented in the metallic (Pd0) state, which was indexed to the face centered cubic structure of Pd (JCPDS no. 87-0641), corresponding to the following planes: (111), (200) and (220), respectively.24–26 The appearance of the palladium diffraction peak indicates that the experimentally doped palladium is supported on the surface of tungsten trioxide.
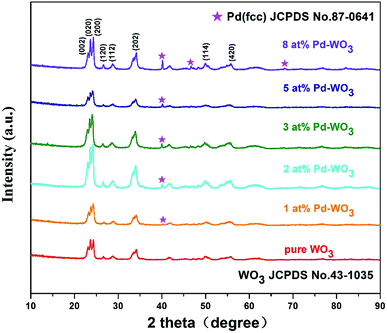 |
| | Fig. 1 XRD patterns of bare WO3 samples with 0 at%, 1 at%, 2 at%, 3 at%, 5 at% and 8 at% Pd doping. | |
Then, the morphology and inner crystal structures of the as-synthesized samples were investigated by TEM measurements, and pure WO3 and 2 at% Pd-WO3 were further characterized by TEM and HR-TEM. Fig. 2a–f shows the typical TEM observations of WO3 nanosheets. The low-magnification TEM images (Fig. 2a and b) illustrate that the product primarily possesses a sheet-like morphology according to the shallow contrast, and because the sheet shape of pure WO3 and 2 at% Pd-WO3 is irregular. Fig. 2a indicates a single nanosheets of a dimension within 100 nm and a thickness of about 20 nm. A typical high-resolution TEM image of the WO3 nanosheets is shown in Fig. 2c–f. The clear two-dimensional ordered lattice structure indicates that the acquired WO3 nanosheets are orthorhombic structure. It can be seen from low-magnification TEM images that the doping has no effect on the morphology of WO3. Furthermore, the HR-TEM images shown in Fig. 2c for monoclinic pure WO3 exhibit the lattice spacing of 0.39 nm, which can be attributed to a lattice fringe of the (002) crystal planes of WO3. In Fig. 2d, the lattice spacing values about 0.37, 0.376 and 0.267 nm can be clearly assigned to reflections from the (200), (020) and (202) planes of orthorhombic WO3, respectively.27,28 Moreover, HR-TEM images in Fig. 2e for monoclinic 2 at% Pd-WO3 display a lattice spacing of 0.384 nm, which is attributed to the lattice fringe of the (002) crystal planes of WO3. In Fig. 2f, the space between neighboring lattice planes is 0.267 nm, whereas the space between neighboring lattice planes along other directions are 0.377 and 0.376 nm. These spacings correspond to the (020) and (200) planes of monoclinic WO3, respectively. As shown in Fig. 2g, some aggregated palladium particles are observed, which have lattice spacing values of about 0.23 nm, which almost exactly corresponds to the (111) planes of Pd0 (JCPDS no. 87-0641). This is consistent with the XRD results (Fig. 1).
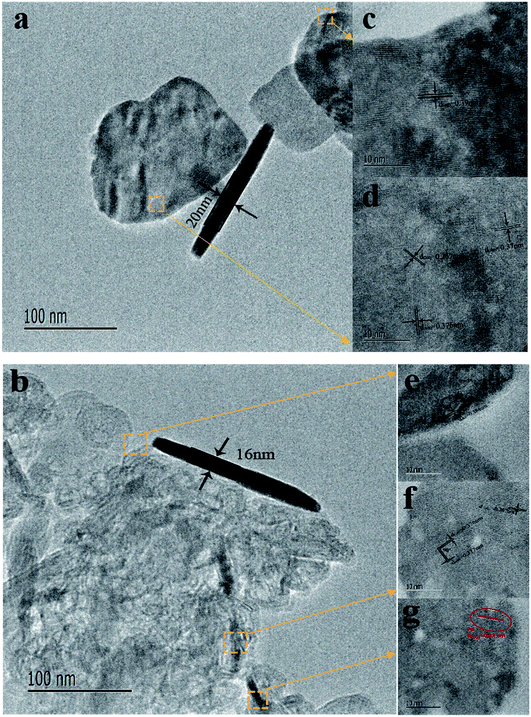 |
| | Fig. 2 Typical TEM images of as-prepared WO3 nanosheets (a) pure WO3 and (b) 2 at% doped Pd; (c–g) HRTEM images corresponding to their individual nanosheets section. | |
Meanwhile, an angle of 90° between the (020) and (200) planes was also observed in the high-resolution TEM images, which are in great agreement with the values of the lattice spacings and planes based on the XRD (Fig. 1). At the same time, palladium doping also has no effect on the crystal structure.
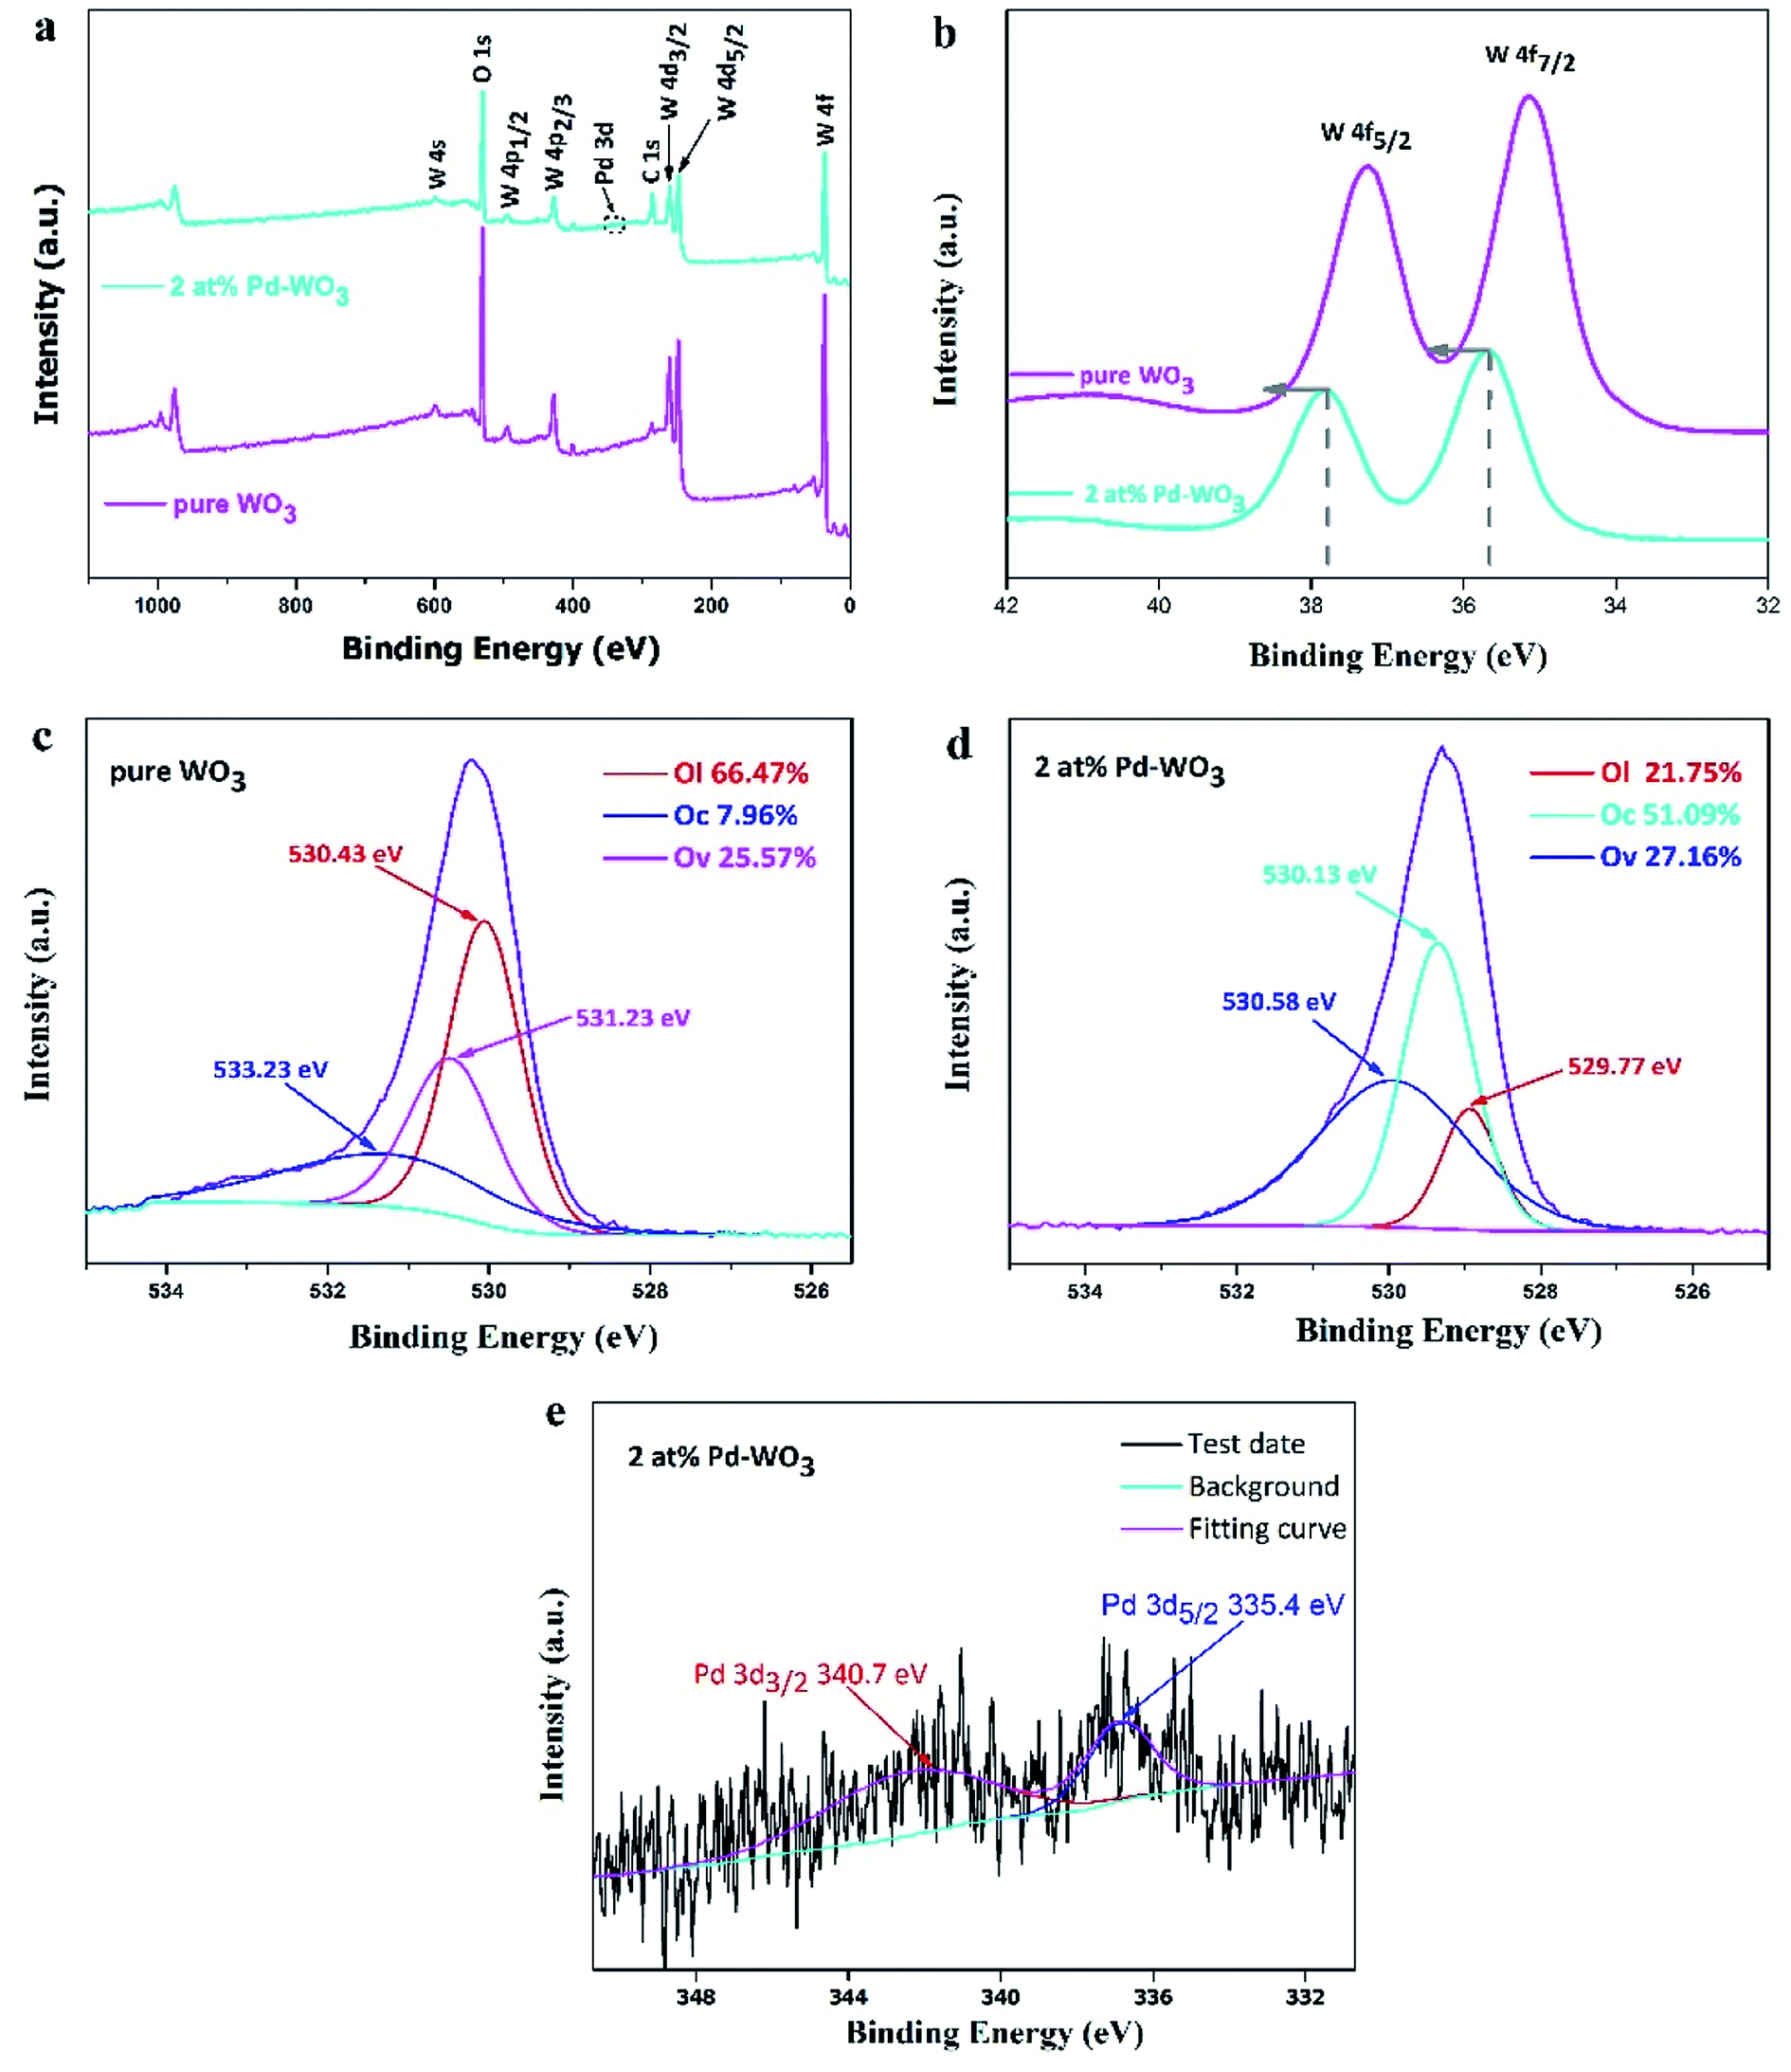
To obtain the surface compositions and chemical states of the as-obtained WO3 nanosheets, X-ray photoelectron spectroscopy (XPS) was used to investigate the elements present, as shown in Fig. 3. The XPS survey spectrum in Fig. 3a showed the presence of W, O and C in the WO3 nanosheets, and peaks for other elements were not observed, demonstrating highly pure WO3 nanosheets. The full-range XPS spectrum of 2 at% Pd-WO3 (Fig. 3a) indicated that W, Pd, O and C were the primary elements in the products, and no impurities were present, which was also confirmed by the XRD results. Fig. 3b–e revealed more specific information on the chemical states of these elements from the high-resolution XPS spectra of W 4f, O 1s and Pd 3d. The W 4f spectrum (Fig. 3b) contained two peaks located at binding energies of 37.8 eV and 35.8 eV in pure WO3, which are related to the presence of W6+ in the WO3 crystal lattice and correspond to W 4f5/2 and W 4f7/2, respectively. In the W 4f spectrum surveyed for 2 at% Pd-WO3 samples (Fig. 3b), two peaks are observed at binding energies of 37.2 eV and 35.2 eV, which correspond to W 4f5/2 and W 4f7/2, respectively.29 As can be seen from Fig. 3b, the W 4f peak shifted towards a higher binding energy after doping, with an offset of 0.6 eV. The 0.6 eV binding energy difference confirms that palladium was doped into the lattice, and the W5+ state existed in the sample, indicating the presence of sub-stoichiometric WO3−x and oxygen vacancies.30–32 O 1s curves of the two samples could be differentiated into three fitted peaks, suggesting the different states of oxygen species on the surface of the samples: OL (lattice oxygen species), OV (oxygen-vacancy) and the OC (surface chemisorbed oxygen species). In the O 1s XPS spectra for pure WO3 (Fig. 3c), the binding energies of 533.23 eV and 530.41 eV are attributed to the surface chemisorbed oxygen species and lattice oxygen in WO3, respectively. In Fig. 3d, the O 1s yields have four peaks at 529.77, 529.99, 530.13 and 530.58 eV.33,34 The first two peaks are attributed to lattice oxygen, while the peak at 530.13 eV ascribes to surface chemisorbed oxygen species. It can be observed from Fig. 3c and d that the relative percentages of OV and OC of the 2 at% Pd-WO3 composite were obviously higher compared with that of as-prepared pure WO3. The Pd 3d core level XPS spectrum in Fig. 3e indicates two peaks at 340.7 eV and 335.4 eV, which respectively correspond to Pd 3d3/2 and Pd 3d5/2. The difference in the splitting energy between the two peaks is 5.3 eV, which again shows the presence of metallic palladium (Pd0).35 However, no peaks were detected, indicating that the only metallic phase exists in the material. Therefore, it is verified that there is a palladium peak in the diffraction spectrum in Fig. 1, which is consistent with the XRD (Fig. 1).
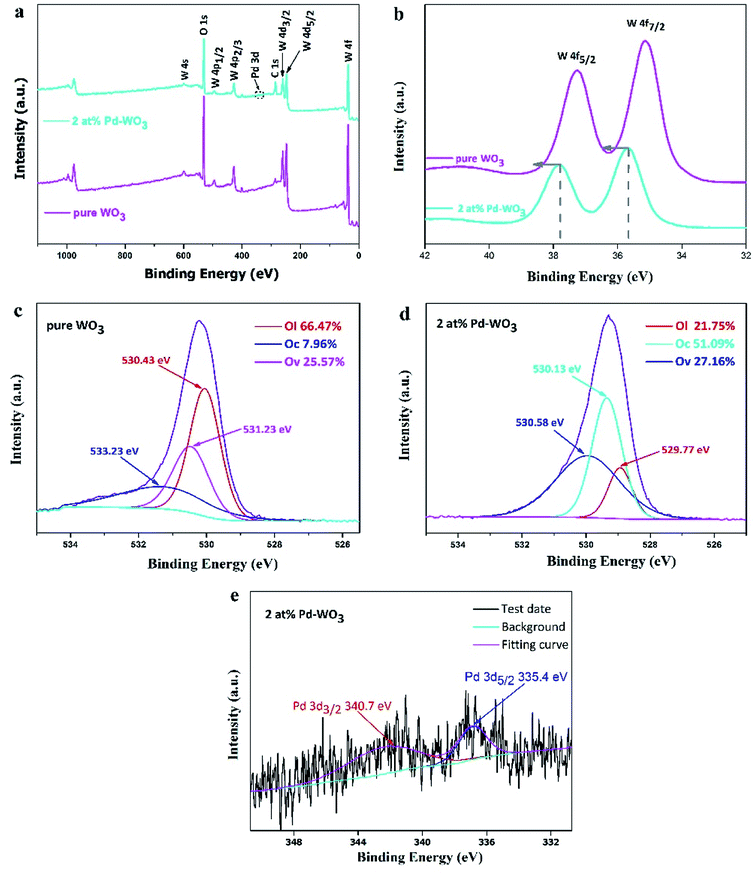 |
| | Fig. 3 Survey scan XPS spectrum of pure WO3 and 2 at% Pd-WO3 nanosheets (a), high resolution XPS spectra of pure WO3 and 2 at% Pd-WO3 nanosheets in the vicinity of W 4f (b), XPS core-level O 1s (inset) spectra of the pure WO3 (c), 2 at% Pd-WO3 (d) and (e) Pd 3d spectra XPS for 2 at% Pd-WO3. | |
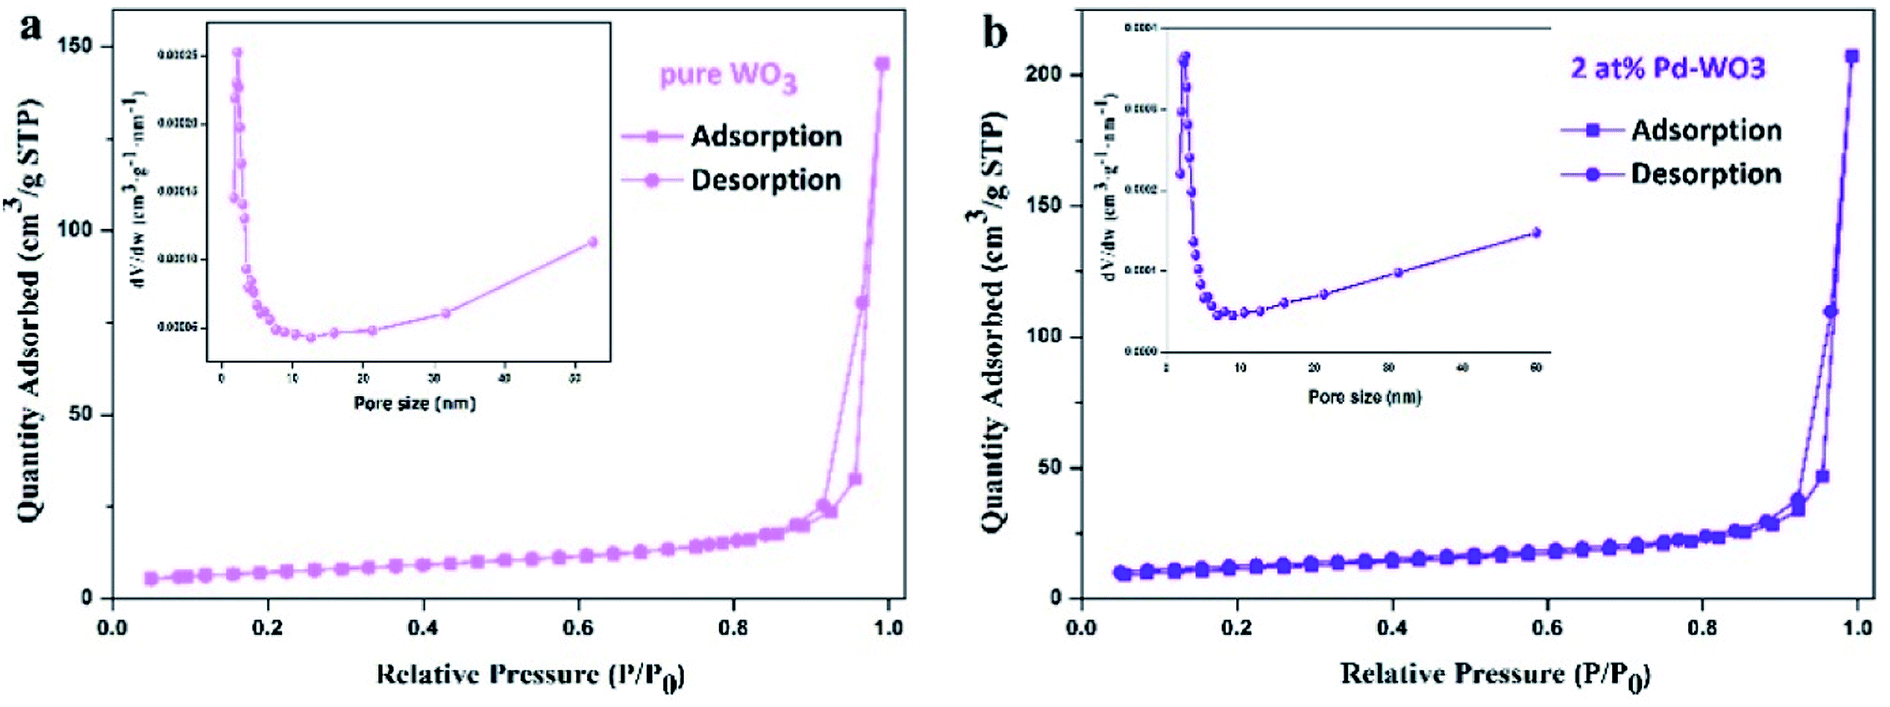
To further study the detailed surface area and pore structures of two-dimensional WO3 nanosheets, nitrogen adsorption and desorption tests were carried out on the samples, and the results are shown in Fig. 4. The pure WO3 and 2 at% Pd-WO3 samples both show a typical type-IV isotherms with a typical H3 type hysteresis loop, indicating that the material is a mesoporous or macro-porous material containing narrow slits formed by a layered structure, as shown in Fig. 4a and b. The BET specific surface area in Fig. 4 was calculated to be 39.47 m2 g−1 for 2 at% Pd-WO3 nanosheets, which is slightly higher than that of pure WO3 (25.69 m2 g−1). In the illustration of Fig. 4a and b, the pore-size distribution curves of the pure WO3 and 2 at% Pd-WO3 samples show that the synthesized products have mesoporous or microporous structures. Fig. 4 shows that, the pure WO3 nanosheets have an average pore width of 32 nm, while the 2 at% Pd-WO3 nanosheets have an average pore width of 33 nm. The 2 at% Pd-WO3 samples obviously exhibited larger surface areas compared with the pure WO3. Accordingly, the main reason for the increase in specific surface area is due to the denser pore size distribution after doping. Meanwhile the increase in the specific surface area provides more active centers for gas sensor reactions, which should increase the sensitivity of samples.
 |
| | Fig. 4 Typical nitrogen adsorption–desorption isotherms and the corresponding pore-size distribution of the pure WO3 nanosheets (a), 2 at% Pd-WO3 nanosheets (b). | |
Gas sensing characteristics
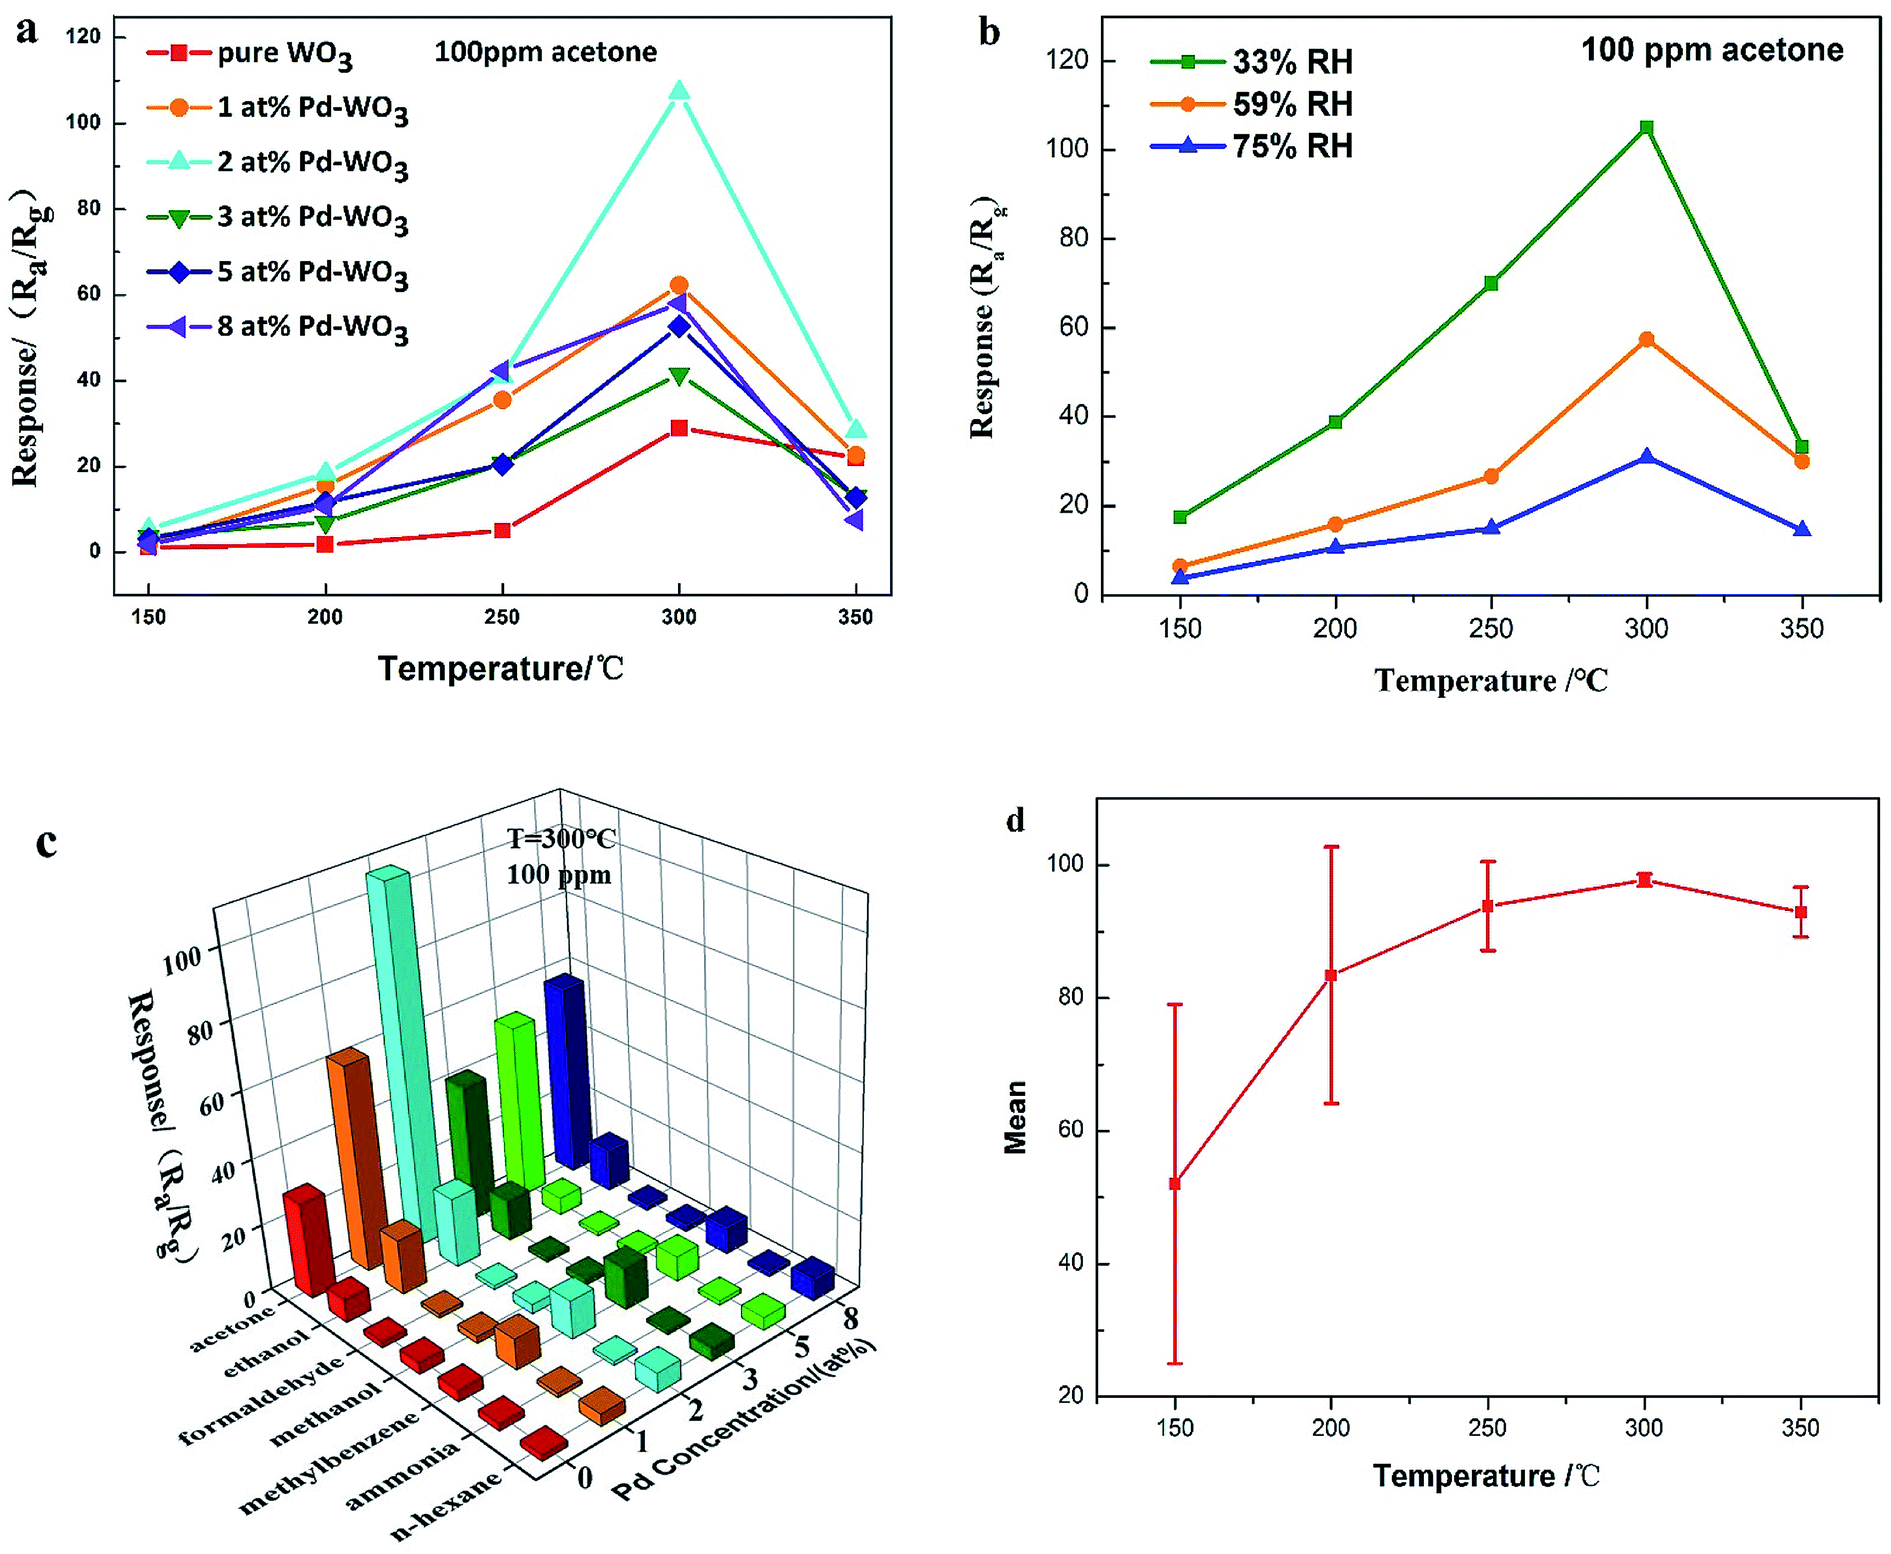
The gas sensing results of the six sensors constructed with the as-produced pure WO3, and 1 at%, 2 at%, 3 at%, 5 at% and 8 at% Pd-WO3 are presented in this section. In this work the baseline resistances for pure and Pd loaded sensors is shown in Fig. S1.† As chemical resistive sensors, the gas sensing performance of these sensors was significantly influenced by the working temperature. The presence of ionized oxygen species (O2−, O− and O2−) on the surfaces of semiconductors is closely related to the temperature, which changes of sensor resistance. Thus, the optimum operating temperature of the as-produced gas sensor using WO3 nanosheets was first determined. The sensing response towards 100 ppm acetone is shown in Fig. 5a, including the working temperature curve of each sensor. From Fig. 5a, as the temperature increased from 150 to 300 °C, the response of pure WO3 and Pd-WO3 nanosheets to 100 ppm acetone vapor increases, and gradually decreased when the temperature further increased from 350 °C. It can be clearly observed that the response after doping is higher than that of pure WO3. These results indicated that both the Pd doping concentration and the working temperature greatly influenced the response property, and the optimum operating of all sensors was 300 °C. As can be seen from the operating temperature curve, the sensor based on 2 at% Pd-WO3 had the highest response among the sensors, with a response of about 107.29 at 300 °C, while it was about 29.472 for pure WO3. The response value of 2 at% Pd-WO3 was more than three times that of pure WO3. The sensitivity value S = (ΔR/Ra) × 100% of Fig. 5a was shown in Fig. S2.† The result showed that the response of Pd-WO3 sensors to 100 ppm acetone vapor increased with the temperature increased from 150 to 300 °C, and gradually decreased when the temperature further increased from 350 °C. The 2 at% Pd-WO3 sensor displayed the best response compared with others, which is consistent with the results of the operating temperature curve in Fig. 5a.
 |
| | Fig. 5 (a) Responses of the sensors are based on pure WO3, 1 at%, 2 at%, 3 at%, 5 at% and 8 at% Pd-WO3 at different working temperature toward 100 ppm acetone; (b) responses curves of the sensor are based on 2 at% Pd-WO3 at 33%, 59%, 75% relative humidity toward 100 ppm acetone; (c) response of the six sensors toward various test gases with a concentration of 100 ppm at their optimal temperatures (300 °C); (d) the error bars of the sensors at different working temperature toward 100 ppm acetone. | |
It is reported that acetone detection has great practical significance.36 Meanwhile, as the environmental factor, the humidity has a great influence on the WO3 sensor performance. According to the humidity control method,37 MgCl2, NaBr, NaCl standard saturated solution were prepared to control the relative humidity (33%, 59%, 75%) in the gas chamber. At the same time, we used 2 at% Pd-WO3 to test the response value toward 100 ppm acetone at different humidity, which was showed in Fig. 5b. Fig. 5b shows that the response of the 2 at% Pd-WO3 sensor decreases as the humidity increases. At the same humidity, the optimum operating temperature of 300 °C has the best response toward 100 ppm acetone.
In addition, a good acetone sensor should be able to identify acetone vapor in the atmosphere, and the selectivity properties of sensors are shown in Fig. 5c. An obvious variation is observed in the response of pure WO3, 1 at%, 2 at%, 3 at%, 5 at% and 8 at% Pd-WO3 sensors toward 100 ppm of acetone, methanol, ethanol, aqua ammonia formaldehyde, toluene, and n-hexane at 300 °C. The 2 at% Pd-WO3 samples displayed enhanced responses for all tested VOCs compared with the pure WO3. Obviously, the 2 at% Pd-WO3 nanosheets displays the best response to acetone (107.29), and negligible cross-responses to ethanol, formaldehyde, methanol, toluene, aqua ammonia and n-hexane. In contrast, the pure WO3 nanosheets sensor showed a lower response and selectivity to all tested VOCs. Fig. 5c shows that both the response value and the selectivity have a greatly improved by doping with palladium. The 2 at% doping amount shows the best selectivity for acetone vapor and the response is more than three times that of pure WO3. Thus, it can be concluded that the Pd-WO3 is a potential sensing material for the detection of various reducing gases, especially acetone. The error bars curve of the sensors were based on pure WO3, 1 at%, 2 at%, 3 at%, 5 at% and 8 at% Pd-WO3 at different working temperature toward 100 ppm acetone, which was shown in the Fig. 5d. From Fig. 5d, as the temperature increased from 150 to 350 °C, the error of the curve became smaller and error of curve was at a minimum at the optimum operating temperature of 300 °C, revealing that the Pd-WO3 sensor possessed good stability at optimum operating temperature. The comparison of acetone sensing performance between this work and previously reported results is showed in Table 1. Obviously, the 2 at% Pd-WO3 sensor displayed good performance, especially its low detection limit and high selectivity.
Table 1 A comparison of the gas-sensing characteristics on various sensing materials toward acetone
| Sensing materials |
Acetone |
Operating temperature |
Response (Ra/Rg) |
Detection limit |
Reference |
| WO3–C3N4 nanosheet |
100 ppm |
340 °C |
35 |
500 ppb |
38 |
| WO3 nanoplates |
200 ppm |
300 °C |
12 |
10 ppm |
39 |
| WO3–NiO nanorods |
200 ppm |
300 °C |
4.4 |
5 ppm |
40 |
| WO3–Cu hollow fibers |
20 ppm |
300 °C |
6.43 |
250 ppb |
41 |
| Ag–WO3 nanosheets |
100 ppm |
340 °C |
12.5 |
500 ppb |
42 |
| La2O3–WO3 nanofibers |
100 ppm |
350 °C |
12.7 |
800 ppb |
43 |
| 2 at% Pd-WO3 nanosheets |
100 ppm |
300 °C |
107.29 |
50 ppb |
This work |
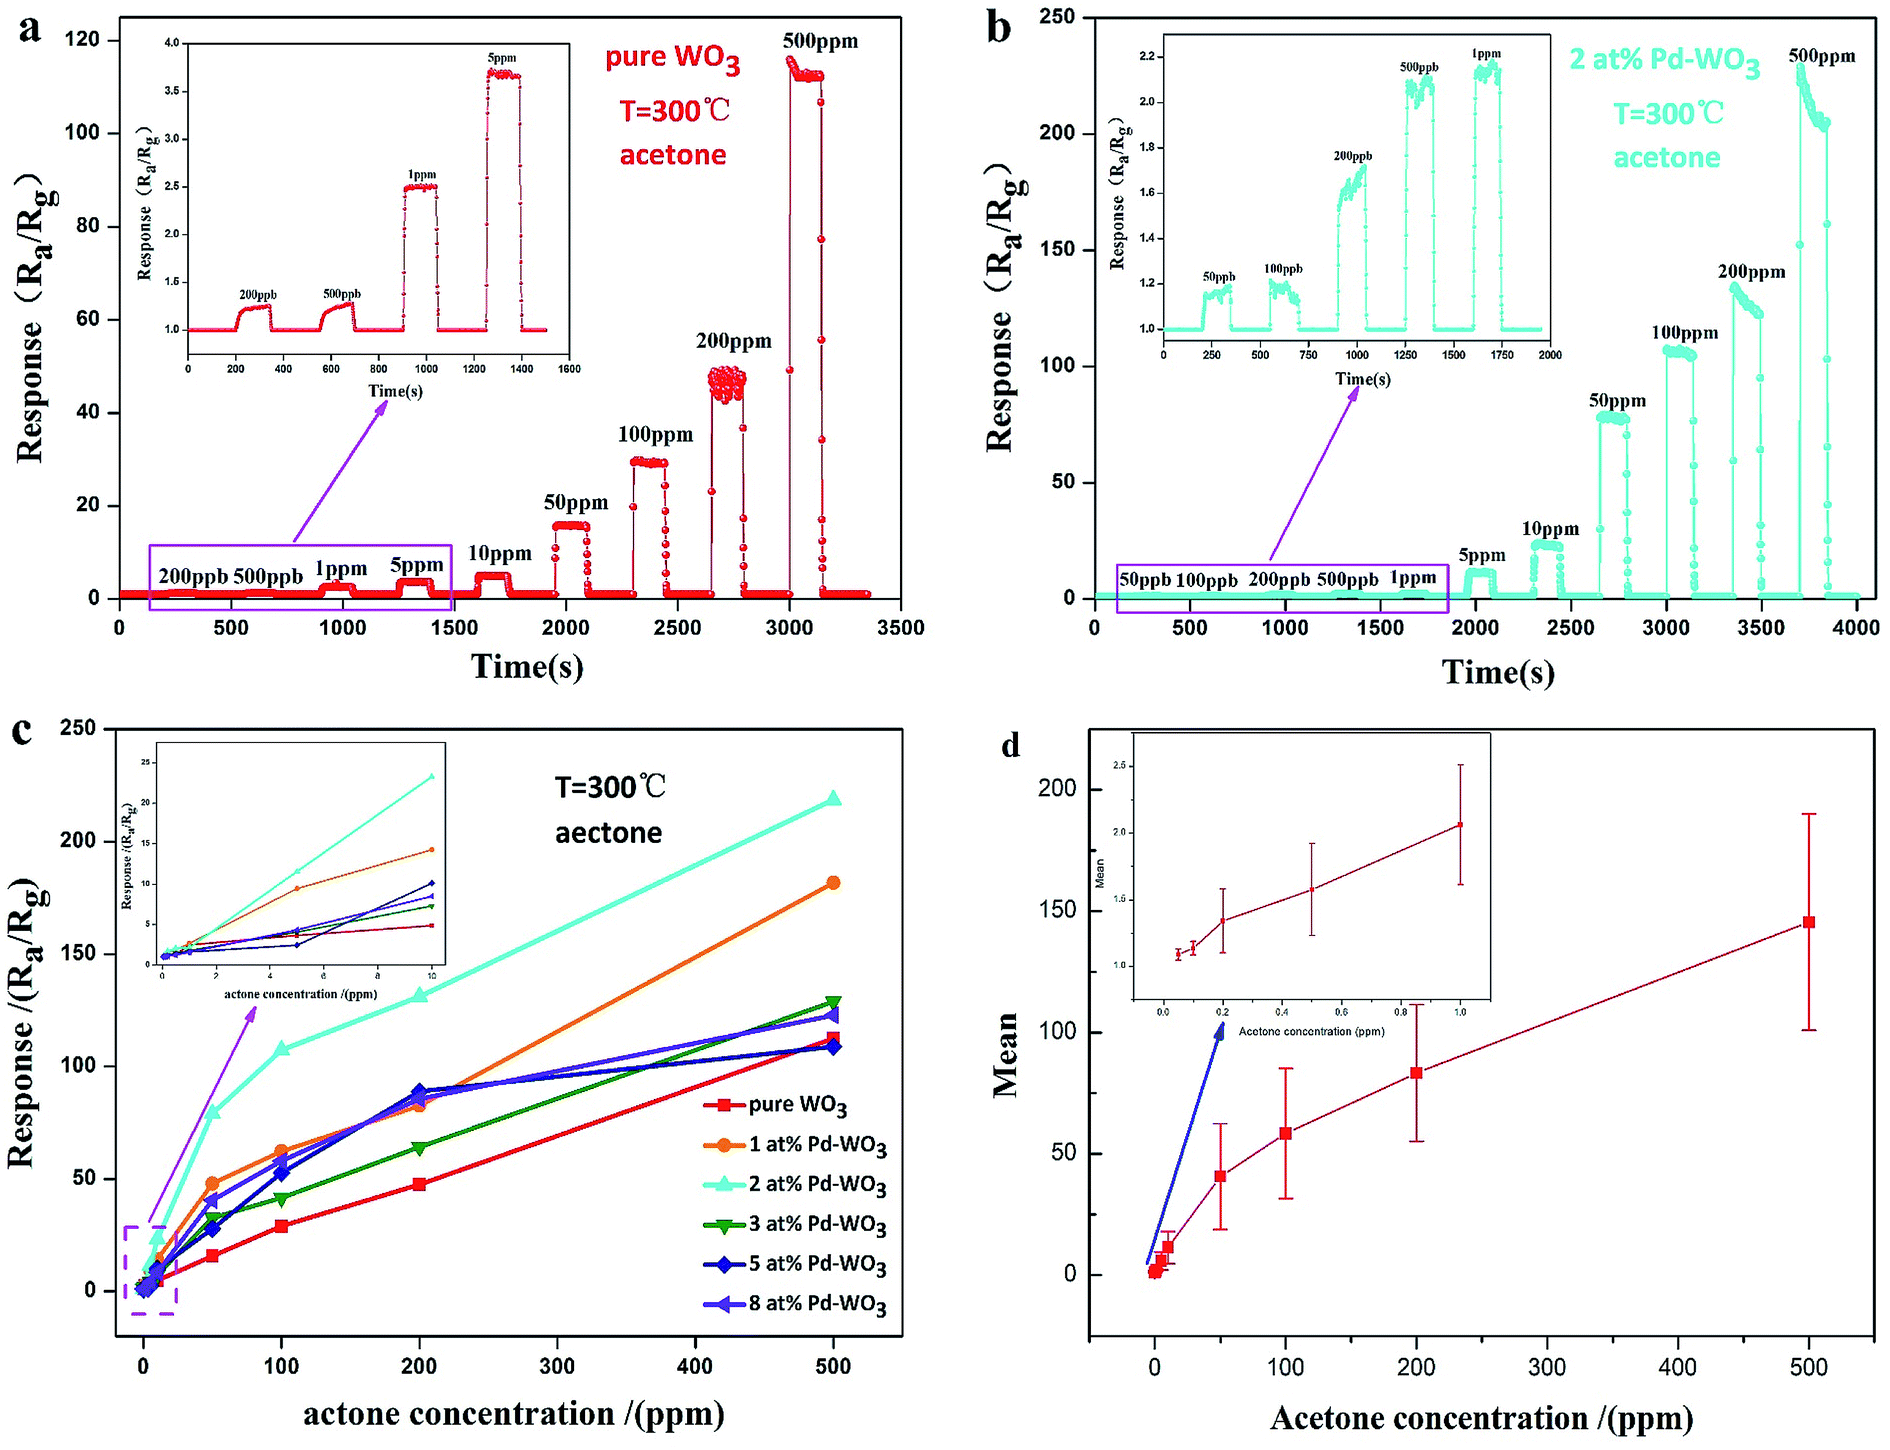
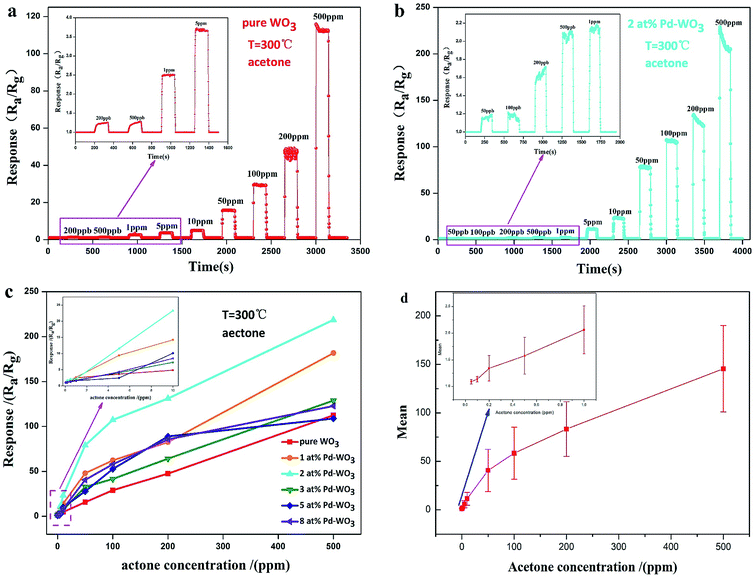
To measure the current detection ability, the dynamic response characteristic of the as-obtained nanosheets sensor toward various concentrations of acetone vapor was tested at 300 °C. The dynamic response–recovery characteristics of the pure WO3 sensor is presented in Fig. 6a with an acetone concentration sequence of 0.2, 0.5, 1, 5, 10, 50, 100, 200 and 500 ppm. The inset shows dynamic response curves with an acetone concentration sequence of 0.2, 0.5, 1 and 5 ppm. The corresponding response value are 1.24, 1.27, 2.5, 3.7, 4.9, 15.8, 29.472, 47.7 and 112.5, respectively. Therefore, the lowest detection limit of the pure WO3 sensor is 200 ppb. Fig. 6b shows the response of 2 at% Pd-WO3 samples to an increasing concentration of acetone at their optimum operating temperature (300 °C). When the concentration of acetone was 0.05, 0.1, 0.2, 0.5, 1, 5, 10, 50, 100, 200 and 500 ppm, the response was 1.16, 1.2, 1.68, 2.08, 2.18, 11.21, 23.59, 78.86, 107.29, 128.52 and 214.62, respectively. Obviously, the latter sensor shows a greatly enhanced detection limit for acetone. In addition, the 2 at% Pd-WO3 sensor has a higher sensitivity and more rapid response to acetone than the pure WO3 sensor at 300 °C. The lowest detection limit of 2 at% Pd-WO3 sensor reached 50 ppb, which it lower than that of pure WO3. The response of pure WO3 and all doped Pd-WO3-based gas sensors for variable acetone concentration from 0.05 to 500 ppm at their optimal operating temperatures are shown in Fig. 6c. The inset of Fig. 6c shows the response to lower-concentrations of acetone between 0.05–10 ppm. In this figure, with the acetone concentration increased, the responses of all sensors were enhanced, which clearly shows that there are significant differences between the responses. Remarkably, the 2 at% Pd-WO3 sensor has a significantly higher response value in the full acetone concentration range than the other, which is consistent with the results of the operating temperature curve in Fig. 5a. The error bars curve of pure WO3, 1 at%, 2 at%, 3 at%, 5 at% and 8 at% Pd-WO3 sensors showed that the error of the sensors increased in acetone increasing concentration at their optimum operating temperature of 300 °C conditions, which was shown in the Fig. 6d.
 |
| | Fig. 6 The dynamical response–recovery curves of the pure WO3 (a) and 2 at% Pd-WO3 (b) sensors to acetone with the increasing concentration at their respective optimal temperature (300 °C). (c) The response of pure WO3, 1 at%, 2 at%, 3 at%, 5 at% and 8 at% Pd-WO3 sensors to acetone increasing concentration at their respective optimal temperature (300 °C); (d) the error bars curve of pure WO3, 1 at%, 2 at%, 3 at%, 5 at% and 8 at% Pd-WO3 sensors to acetone increasing concentration at their optimum operating temperature (300 °C). | |
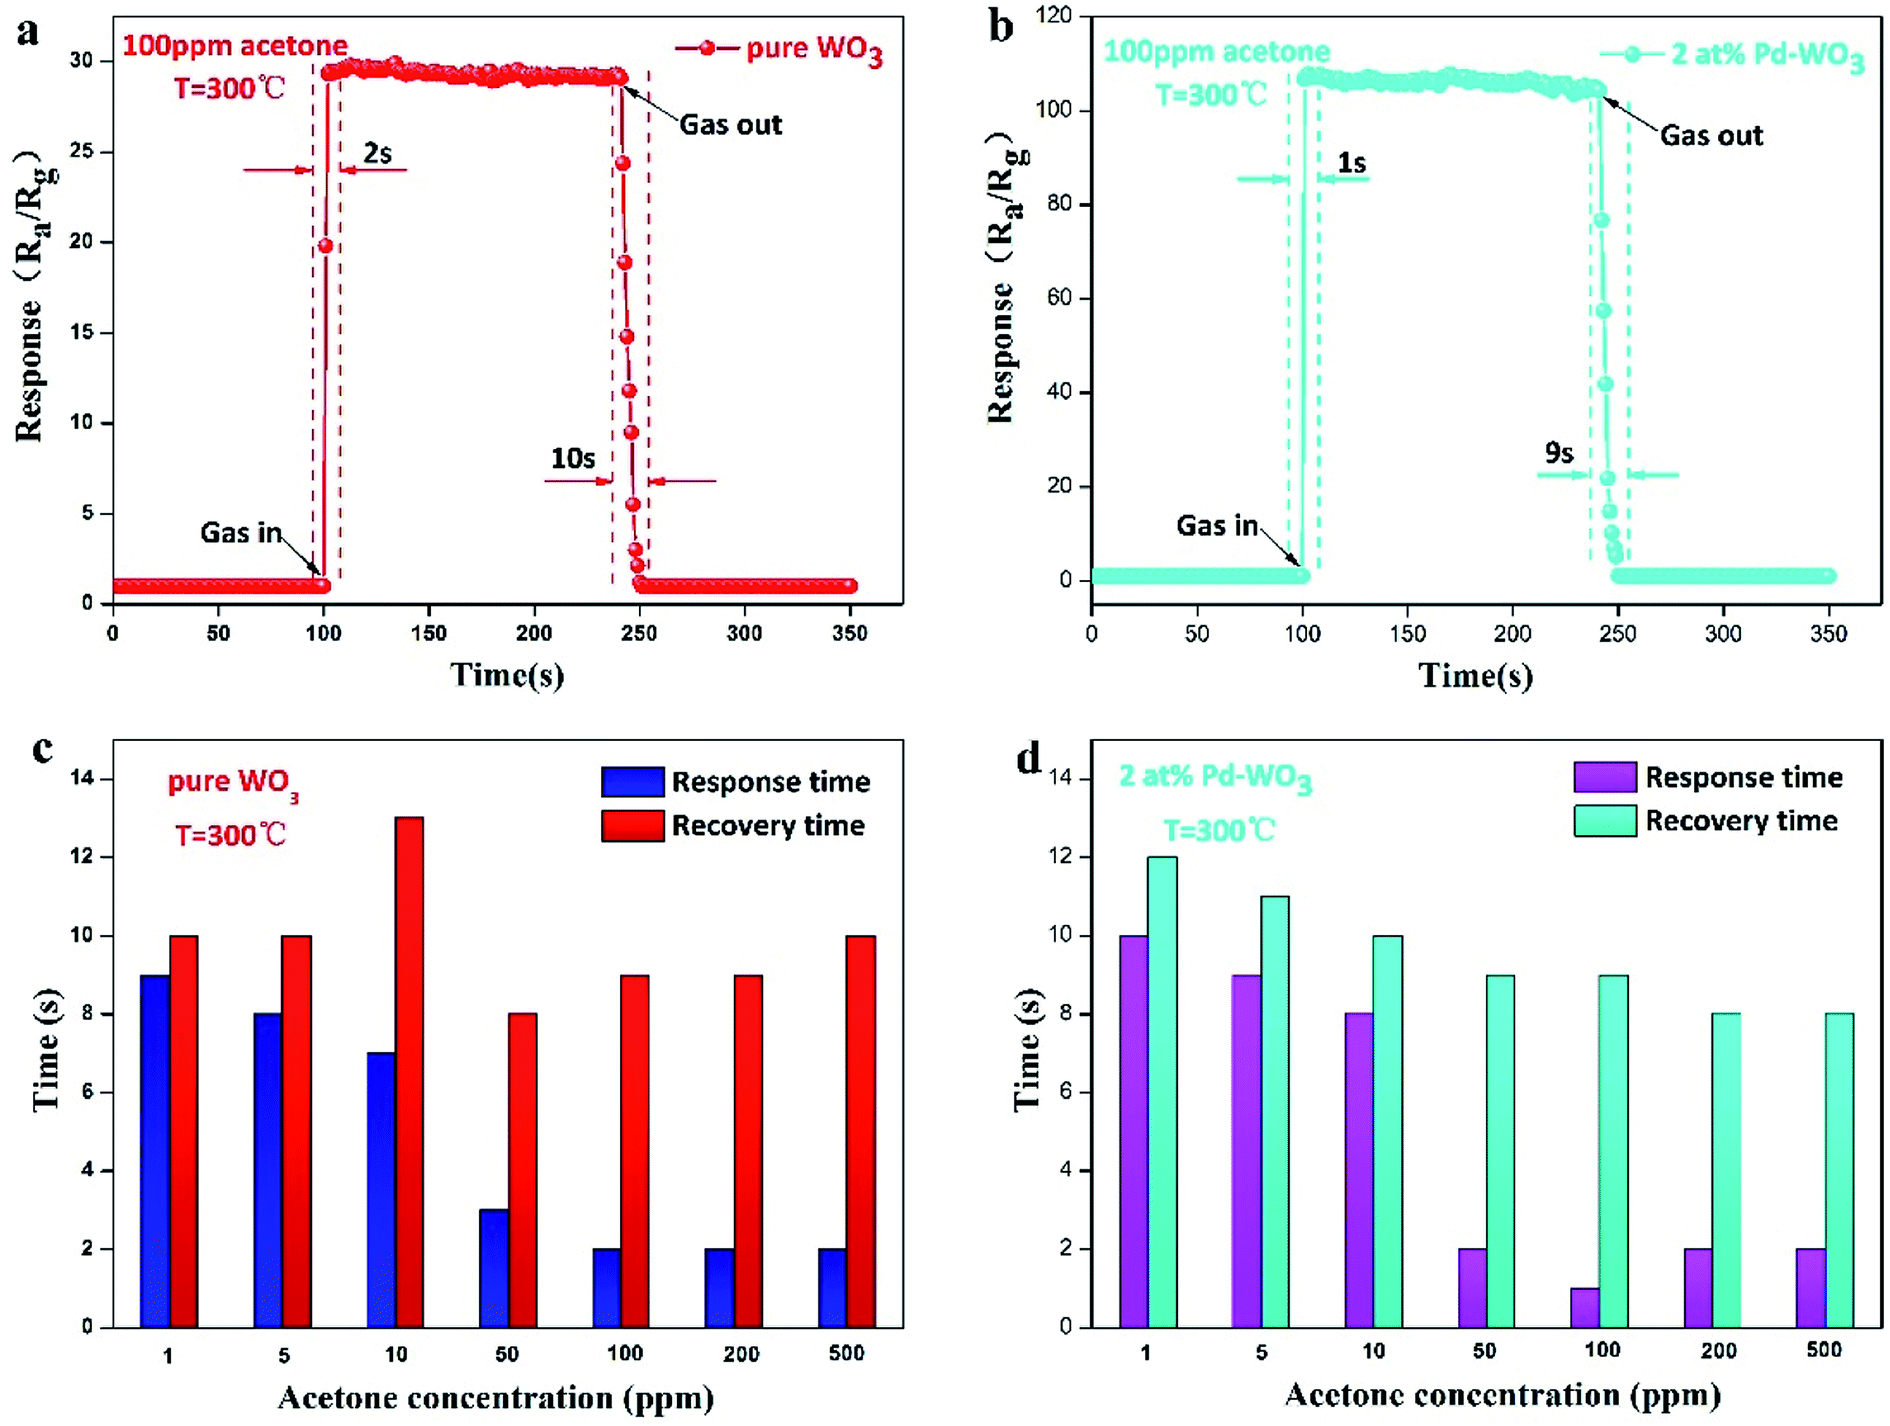
To quickly detect the gas, the response–recovery time of the sensors were explored. The transient dynamic response of the pure WO3 and 2 at% Pd-WO3 sensors in Fig. 7a and b shows that the response–recovery time of pure WO3 and 2 at% Pd-WO3 sensors are relatively fast. The corresponding response–recovery time is 2/10 s and 1/9 s toward 100 ppm acetone at their optimal temperature (300 °C). The response–recovery times of the pure WO3 and 2 at% Pd-WO3 sensors at increasing concentrations of acetone vapor are also displayed in Fig. 8c and d. The response–recovery time of the pure WO3 sensor is 9/10, 8/10, 7/13, 3/8, 2/9, 2/9, and 2/10 s when exposed to acetone gas at 1–500 ppm. In addition, the response–recovery time of the 2 at% Pd-WO3 sensor is 10/12, 9/11, 8/10, 2/9, 1/9, 2/8, and 2/8 s exposed to acetone gas at 1–500 ppm. A comparable investigated of the sensing characteristics of the response–recovery time between the sensors in this work and other previously-reported acetone sensors is given in Table 2. It was evident that the 2 at% Pd-WO3 sensor has a fast response and recovery.
 |
| | Fig. 7 The actual response transient of the pure WO3 (a) and 2 at% Pd-WO3 (b) sensor to 100 ppm acetone vapor at their respective optimal temperature (300 °C), the response time and recovery time of the pure WO3 (c) and 2 at% Pd-WO3 (d) sensor toward acetone increasing concentration at their respective optimal temperature (300 °C). | |
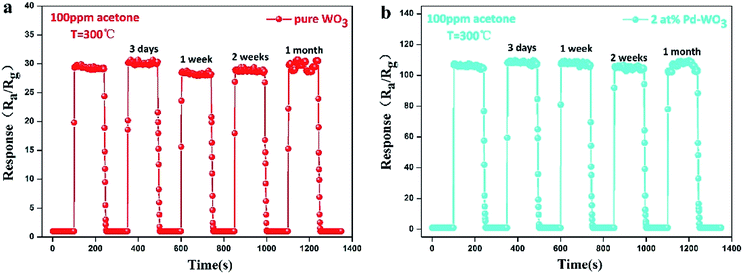 |
| | Fig. 8 The response–recovery curve of pure WO3 (a) and 2 at% Pd-WO3 (b) sensor to 100 ppm acetone at their respective optimal temperature (300 °C) was placed for 3 days, 1 week, 2 weeks, 1 month. | |
Table 2 A comparison of the response–recovery times of sensors based on various sensing materials toward acetone
| Sensing materials |
Acetone |
Operating temperature |
Response time |
Recovery time |
Reference |
| Cactus-like WO3–SnO2 nanocomposite |
600 ppm |
360 °C |
14 s |
16 s |
44 |
| Co3O4/ZnCo2O4 composite hollow nanostructures |
100 ppm |
255 °C |
41 s |
47 s |
45 |
| MoO3–WO3 nanofibers |
100 ppm |
375 °C |
17 s |
50 s |
46 |
| WO3 plate |
200 ppm |
307 °C |
10 s |
26 s |
47 |
| Fe2O3–CuO nanorod |
100 ppm |
240 °C |
149 s |
133 s |
48 |
| Ag–WO3 nanosheets |
100 ppm |
340 °C |
28 s |
38 s |
42 |
| Au–ZnO yolk–shell |
10 ppm |
280 °C |
15 s |
12 s |
49 |
| LaFeO3 |
10 ppm |
200 °C |
21 s |
6 s |
50 |
| Flower-like porous ZnO |
50 ppm |
280 °C |
2 s |
23 s |
51 |
| Triple-shelled ZnO/ZnFe2O4 microspheres |
20 ppm |
140 °C |
5.2 s |
12.8 s |
52 |
| Three-dimensional hierarchical SnO2 |
200 ppm |
325 °C |
— |
— |
53 |
| Hierarchical-out hierarchical Fe2O3 nanorod |
100 ppm |
220 °C |
8 s |
19 s |
54 |
| Bamboo raft-like Co3O4 |
200 ppm |
180 °C |
32 s |
35 s |
55 |
| Pt–In2O3 |
1.56 ppm |
150 °C |
— |
— |
56 |
| Hierarchical Fe2O3 |
100 ppm |
220 °C |
8 s |
19 s |
57 |
| 2 at% Pd-WO3 nanosheets |
100 ppm |
300 °C |
1 s |
9 s |
This work |
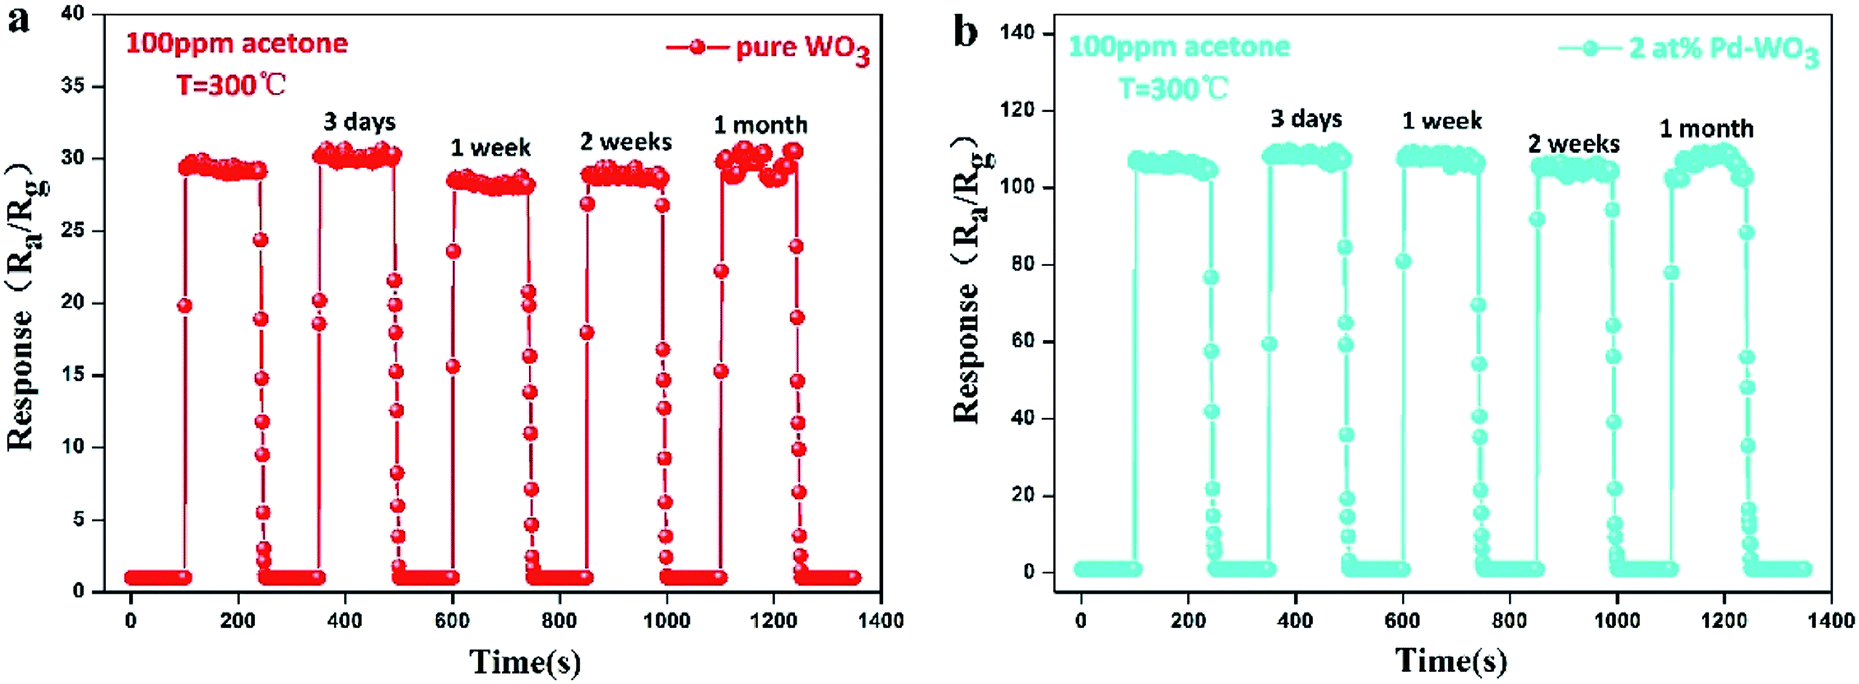
Stability and reproducibility are also vital parameters of gas sensors. To survey the stability and reproducibility of the sensor response, 5 reversible cycles consisting of response and recovery processes for the pure WO3 and 2 at% Pd-WO3 sensor to 100 ppm acetone vapor are displayed in Fig. 8a and b. It was verified that the sensor revealed a relatively invertible characteristic at each cycle. In this figure, the sensors were shown to display excellent stability and reversibility in each cycle. In Fig. 8a, the pure WO3 sensor response toward 100 ppm acetone vapor for each cycle were 29.472, 30.175, 28.08, 29.399, and 30.515, which is less than a five percent change in the response. However, Fig. 8b show that, the 2 at% Pd-WO3 sensor responses toward 100 ppm acetone vapor for each cycle were 107.29, 108.748, 108.502, 106.495 and 108.984, which is less than a two change. Furthermore, the pure WO3 and 2 at% Pd-WO3 sensor stabilities were also inspected for 1 month, as shown in Fig. 8a and b. The sensor response value varied and fluctuated within an extremely narrow range, and deviations in the sensor response values can be regulated lower than 5%. These results demonstrate that the sensor have favorable stabilities when used to detect acetone vapor.
Gas sensing mechanism
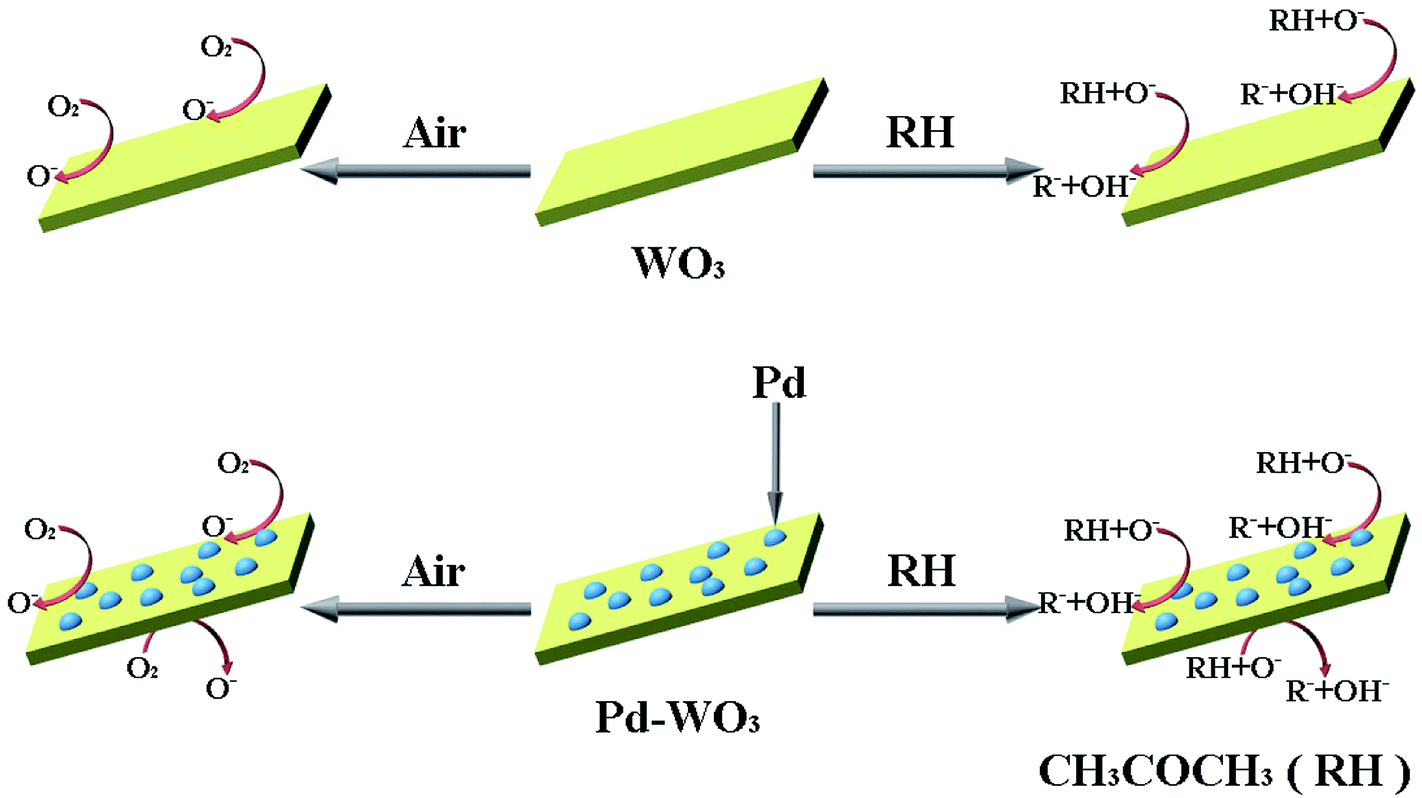
As is known, the sensing of n-type semiconductors occurs via a the surface-controlled mechanism, which is determined by the adjusting of the resistance produced by the desorption and adsorption of acetone gas molecules on the surface of the sensor.58,59 W6+ is an n-type semiconductor that acts as an electron donor when exposed to air, where oxygen molecules capture electrons from the WO3 conduction band and act as electron acceptors. An electron depletion layer and chemisorption of oxygen ions (O2−, O− and O2−) occur on the surface of the sensing material, eqn (1)–(3).58,60,61 When exposed to acetone, acetone molecules react with the adsorbed oxygen ions and are oxidized into intermediate products CH3COCH2− and OH−, eqn (4).62 Electrons are simultaneously released back to the surface of the material via eqn (5)–(8),62 which reduces the resistance and width of the depletion layer (Fig. 9).| | |
CH3COCH3 (gas) + 3O− → CH3COCH2− + OH− + e−
| (4) |
| | |
CH3COCH3 (gas) + OH− → CH3CHO + CH3O−
| (5) |
| | |
CH3COCH3 (gas) + O− → CH3CO+ + CH3O− + e−
| (6) |
 |
| | Fig. 9 Schematic of sensing mechanisms of pure WO3 and Pd-WO3 sensor. | |
The main reasons for the improvement in the gas sensitivity of the Pd-WO3 nanosheets are that the. Pd-WO3 contains a lamellar structure with a large specific surface area, which is conducive to gas diffusion. According to the catalytic spill-over effect, when exposed to air, Pd nanoparticles can dissociate O2 into O−, and then O− overflow adsorbs onto the WO3 surface.63 Then, Pd reduces the activation energy required for the reaction which shortens the response–recovery time and improve the sensitivity. It forms CH3COCH2− when exposed to acetone, which and diffuses to the WO3 surface via the same process and enhances. The sensitivity to acetone gas is in the doped sensor compared with pure WO3. This phenomenon may occur due to the removal of the depletion layer by a spill-over effect, which improves the gas sensitive response. The presence of Pd nanoparticles promotes the transfer and regeneration of the electrons and oxygen species consumed in the acetone gas reaction, and reduces the response recovery time of the sensor. The fast response–recovery time is greatly ascribed to the morphology and structure of materials, which provide more surface-active sites to promote interaction with acetone.64
Conclusions
In this paper, pure WO3 nanosheets and a series of Pd-WO3 nanosheets doped with different amounts of Pd were synthesized through one-step hydrothermal method. The experimental results showed that the gas sensor doped with 2 at% Pd (Pd-WO3) had the best gas sensitivity to acetone and also had a fast response, high sensitivity, high selectivity and low detection limit. Therefore, it has potential application prospects for acetone detection. The 2 at% Pd-WO3 gas sensor had a fast response toward 100 ppm acetone with a sensitivity 3.64 times higher than that of the pure WO3 sensor. Moreover, the sensor has a low detection limit (50 ppb) and excellent selectivity to acetone (Sacetone/Sethanol = 5.06). The excellent gas sensitivity of this material was mainly attributed to the high catalytic activity and overflow effect of the Pd nanoparticles, which provided more active sites for this sensitive material.
Conflicts of interest
There no conflicts to declare.
Acknowledgements
This work was financially supported by the National Natural Science Foundation of China (Grant No. 21471120) and the International Cooperation Project of Hubei Province (2012IHA00201), Educational Commission of Hubei Province of China (T201306).
References
- H. Haick, Y. Y. Broza, P. Mochalski, V. Ruzsanyi and A. Amann, Chem. Soc. Rev., 2014, 43, 1423–1449 RSC.
- A. Amann, B. de Lacy Costello, W. Miekisch, J. Schubert, B. Buszewski, J. Pleil, N. Ratcliffe and T. Risby, J. Breath Res., 2014, 8, 034001 CrossRef PubMed.
- M. Righettoni, A. Tricoli and S. E. Pratsinis, Anal. Chem., 2010, 82, 3581–3587 CrossRef CAS PubMed.
- S. J. Choi, F. Fuchs, R. Demadrille, B. Grevin, B. H. Jang, S. J. Lee, J. H. Lee, H. L. Tuller and I. D. Kim, ACS Appl. Mater. Interfaces, 2014, 6, 9061–9070 CrossRef CAS PubMed.
- B. Buszewski, A. Ulanowska, T. Ligor, N. Denderz and A. Amann, Biomed. Chromatogr., 2009, 23, 551–556 CrossRef CAS PubMed.
- B. Ibrahim, M. Basanta, P. Cadden, D. Singh, D. Douce, A. Woodcock and S. J. Fowler, Thorax, 2011, 66, 804–809 CrossRef PubMed.
- Y. Y. Broza and H. Haick, Nanomedicine, 2013, 8, 785–806 CrossRef CAS PubMed.
- L. L. Wang, D. Chen, K. Jiang and G. Z. Shen, Chem. Soc. Rev., 2017, 46, 6764–6815 RSC.
- Y. H. Zhu, Y. Zhao, J. H. Ma, X. W. Cheng, J. Xie, P. C. Xu, H. Q. Liu, H. P. Liu, H. J. Zhang and M. H. Wu, J. Am. Chem. Soc., 2017, 139, 10365–10373 CrossRef CAS PubMed.
- Y. B. Shen, H. S. Bi, T. T. Li, X. X. Zhong, X. X. Chen, A. F. Fan and D. Z. Wei, Appl. Surf. Sci., 2018, 434, 922–931 CrossRef CAS.
- J. J. Shi, Z. X. Cheng, L. P. Gao, Y. Zhang, J. Q. Xu and H. B. Zhao, Sens. Actuators, B, 2016, 230, 736–745 CrossRef CAS.
- Z. G. Xue, Z. X. Cheng, J. Xu, Q. Xiang, W. H. Wang and J. Q. Xu, ACS Appl. Mater. Interfaces, 2017, 9, 41559–41567 CrossRef CAS PubMed.
- F. L. Meng, N. N. Hou, Z. Jin, B. Sun, W. Q. Li, X. H. Xiao, C. Wang, M. Q. Li and J. H. Liu, Sens. Actuators, B, 2015, 219, 209–217 CrossRef CAS.
- M. Bärtsch and M. Niederberge, ChemPlusChem, 2017, 82, 42–59 CrossRef.
- T. T. Zhou, T. Zhang, J. N. Deng, R. Zhang, Z. Luo and L. L. Wang, Sens. Actuators, B, 2017, 242, 369–377 CrossRef CAS.
- W. T. Koo, S. Yu, S. J. Choi, J. S. Jang, J. Y. Cheong and I. D. Kim, ACS Appl. Mater. Interfaces, 2017, 9, 8201–8210 CrossRef CAS PubMed.
- D. L. Chen, X. X. Hou, T. Li, L. Yin, B. B. Fan, H. L. Wang, X. J. Li, H. L. Xu, H. X. Lu, R. Zhang and J. Sun, Sens. Actuators, B, 2011, 153, 373–381 CrossRef CAS.
- M. ul Haq, Z. Wen, Z. Y. Zhang, S. Khan, Z. Lou, Z. Z. Ye and L. P. Zhu, Sci. Rep., 2018, 8, 1705 CrossRef PubMed.
- X. Zhang, X. Y. Li, H. C. Ye, S. M. Chen, H. X. Jiu, D. B. Liu, Y. Lin, W. Ye, C. M. Wang and Q. Xu, J. Am. Chem. Soc., 2016, 138, 8928–8935 CrossRef PubMed.
- L. Xiao, S. M. Shu and S. T. Liu, Sens. Actuators, B, 2015, 221, 120–126 CrossRef CAS.
- H. Y. Liu, W. Yang, M. X. Wang, L. Xiao and S. T. Liu, Sens. Actuators, B, 2016, 236, 490–498 CrossRef CAS.
- W. Yang, L. Feng, S. H. He, L. Y. Liu and S. T. Liu, ACS Appl. Mater. Interfaces, 2018, 10, 27131–27140 CrossRef CAS PubMed.
- Z. Q. Hua, M. Yuasa, T. Kida, N. Yamazoe and K. Shimanoe, Thin Solid Films, 2013, 548, 677–682 CrossRef CAS.
- P. Rai, J. W. Yoon, C. H. Kwak and J. H. Lee, J. Mater. Chem. A, 2016, 4, 264–269 RSC.
- N. Ma, K. Suematsu, M. Yuasa, T. Kida and K. Shimanoe, ACS Appl. Mater. Interfaces, 2015, 7, 5863–5869 CrossRef CAS PubMed.
- S. H. Xiao, B. Liu, R. Zhou, Z. W. Liu, Q. H. Li and T. H. Wang, Sens. Actuators, B, 2018, 254, 966–972 CrossRef CAS.
- Y. Li, Z. Q. Hua, Y. Wu, Y. Zeng, Z. L. Qiu, X. M. Tian, M. J. Wang and E. P. Li, Sens. Actuators, B, 2018, 265, 249–256 CrossRef CAS.
- F. Li, S. P. Ruan, N. Zhang, Y. Y. Yin, S. J. Guo, Y. Chen, H. E. Zhang and C. N. Li, Sens. Actuators, B, 2018, 265, 355–364 CrossRef CAS.
- J. Morar, F. J. Himpsel, G. Hughes and J. L. Jordan, J. Vac. Sci. Technol., A, 1985, 3, 1477–1480 CrossRef CAS.
- Y. Liu, J. Yu and P. T. Lai, Int. J. Hydrogen Energy, 2014, 39, 10313–10319 CrossRef CAS.
- K. F. Schoch, IEEE Electr. Insul. Mag., 1998, 14, 49 Search PubMed.
- M. Ahsan, T. Tesfamichael, M. Ionescu, J. Bell and N. Motta, Sens. Actuators, B, 2012, 162, 14–21 CrossRef CAS.
- J. Han, D. S. Zhang, P. Maitarad, L. Y. Shi, S. X. Cai, H. R. Li, L. Huang and J. P. Zhang, Catal. Sci. Technol., 2014, 5, 1077–1083 Search PubMed.
- P. Mach and M. Kocian, J. Phys. Chem. C, 2013, 117, 9999–10006 Search PubMed.
- N. Chen, D. Y. Deng, Y. X. Li, X. Liu, X. X. Xing, X. C. Xiao and Y. D. Wang, Sci. Rep., 2017, 7, 7692 CrossRef PubMed.
- M. Righettoni, A. Tricoli, S. Gass, A. Schmid, A. Amann and S. E. Pratsinis, Anal. Chim. Acta, 2012, 738, 69–75 CrossRef CAS PubMed.
- L. Y. Liu, S. M. Shu, G. Z. Zhang and S. T. Liu, ACS Appl. Nano Mater., 2018, 1, 31–37 CrossRef CAS.
- D. Wang, S. M. Huang, H. J. Li, A. Y. Chen, P. Wang, J. Yang, X. Y. Wang and J. H. Yang, Sens. Actuators, B, 2019, 282, 961–971 CrossRef CAS.
- H. L. Zhang, Z. F. Liu, J. Q. Yang, W. Guo, L. J. Zhu and W. J. Zheng, Mater. Res. Bull., 2014, 57, 260–267 CrossRef CAS.
- S. Choi, J. W. Lee, W. S. Lee, C. Lee and W. I. Lee, J. Korean Phys. Soc., 2017, 71, 487–493 CrossRef CAS.
- X. Bai, H. Ji, P. Gao, Y. Zhang and X. Sun, Sens. Actuators, B, 2014, 193, 100–106 CrossRef CAS.
- M. Yin, L. Yu and S. Liu, Mater. Lett., 2017, 186, 66–69 CrossRef CAS.
- C. H. Feng, C. Wang, P. F. Cheng, X. Li, B. Wang, Y. H. Guan, J. Ma, H. Zhang, Y. F. Sun and P. Sun, Sens. Actuators, B, 2015, 221, 434–442 CrossRef CAS.
- L. Zhu, W. Zeng and Y. Li, Mater. Lett., 2018, 231, 5–7 CrossRef CAS.
- F. D. Qu, T. Thomas, B. X. Zhang, X. X. Zhou, S. D. Zhang, S. P. Ruan and M. H. Yang, Sens. Actuators, B, 2018, 273, 1202–1210 CrossRef CAS.
- J. N. Zhang, H. Lu, H. B. Lu, G. Li, J. Z. Gao, Z. B. Yang, Y. H. Tian, M. Zhang, C. L. Wang and Z. He, J. Alloys Compd., 2019, 779, 531–542 CrossRef CAS.
- S. Y. Liu, F. Zhang, H. Li, T. Chen and Y. D. Wang, Sens. Actuators, B, 2012, 162, 259–268 CrossRef CAS.
- S. Park, H. Kheel, G. J. Sun, T. Ko, W. I. Lee and C. Lee, J. Nanomater., 2015, 16, 398 Search PubMed.
- F. B. Gu, H. H. Chen, D. M. Han and Z. H. Wang, RSC Adv., 2016, 6, 29727–29733 RSC.
- H. Zhang, H. W. Qin, C. Y. Gao, G. J. Zhou, Y. P. Chen and J. F. Hu, Sensors, 2018, 18, 1990 CrossRef PubMed.
- X. S. Wang, Y. Li, L. Liu, L. Y. Wang, H. Wang and X. X. Guo, J. Porous Mater., 2016, 24, 463–468 CrossRef.
- X. Z. Song, L. Qiao, K. M. Sun, Z. Q. Tan, W. Ma, X. L. Kang, F. F. Sun, T. Huang and X. F. Wang, Sens. Actuators, B, 2018, 256, 374–382 CrossRef CAS.
- Y. X. Li, Z. Guo, Y. Su, X. B. Jin, X. H. Tang, J. R. Huang, X. J. Huang, M. Q. Li and J. H. Liu, ACS Sens., 2016, 2, 102–110 CrossRef PubMed.
- J. F. Tan and X. T. Huang, Sens. Actuators, B, 2016, 237, 159–166 CrossRef CAS.
- S. M. Wang, J. Cao, W. Cui, L. L. Fan, X. F. Li and D. J. Li, J. Alloys Compd., 2018, 758, 45–53 CrossRef CAS.
- M. Karmaoui, S. G. Leonardi, M. Latino, D. M. Tobaldi, N. Donato, R. C. Pullar, M. P. Seabra, J. A. Labrincha and G. Neri, Sens. Actuators, B, 2016, 230, 697–705 CrossRef CAS.
- H. Wang, L. Yan, S. Li, Y. Li, L. Liu, L. T. Du, H. J. Duan and Y. L. Cheng, Appl. Phys. A, 2018, 124, 212 CrossRef.
- N. Barsan, D. Koziej and W. Weimar, Sens. Actuators, B, 2007, 121, 18–35 CrossRef CAS.
- M. D'Arienzo, L. Armelao, C. M. Mari, S. Polizzi, R. Ruffo, R. Scotti and F. Morazzoni, J. Am. Chem. Soc., 2011, 133, 5296–5304 CrossRef PubMed.
- G. Eranna, B. C. Joshi, D. P. Runthala and R. P. Gupta, Crit. Rev. Solid State Mater. Sci., 2004, 29, 111–188 CrossRef CAS.
- H. Geistlinger, Sens. Actuators, B, 1993, 17, 47–60 CrossRef CAS.
- S. B. Upadhyay, R. K. Mishra and P. P. Sahay, Sens. Actuators, B, 2015, 209, 368–376 CrossRef CAS.
- B. X. Xiao, S. I. Song, P. Wang, Q. Zhao, M. Y. Chuai and M. Z. Zhang, Sens. Actuators, B, 2017, 241, 489–497 CrossRef CAS.
- C. B. Zhai, Q. Zhao, K. K. Gu, D. J. Xing and M. Z. Zhang, J. Alloys Compd., 2019, 784, 660–667 CrossRef CAS.
Footnotes |
| † Electronic supplementary information (ESI) available. See DOI: 10.1039/c9ra04429a |
| ‡ Ke He and Zhao Jin contributed equally to this work. |
|
| This journal is © The Royal Society of Chemistry 2019 |
Click here to see how this site uses Cookies. View our privacy policy here. 
 Open Access Article
 This Open Access Article is licensed under a Creative Commons Attribution-Non Commercial 3.0 Unported Licence
 *a
*a