 Open Access Article
Sulfur-doped graphene quantum dot-based paper sensor for highly sensitive and selective detection of 4-nitrophenol in contaminated water and wastewater†
Nguyen Thi Ngoc Anha,
Pei-Yi Changb and
Ruey-An Doong *ac
*ac
aInstitute of Environmental Engineering, National Chiao Tung University, 1001, University Road, Hsinchu 30010, Taiwan
bCenter for Measurement Standard, Industrial Technology Research Institute (ITRI), 321, Sec. 2, Kuang Fu Road, Hsinchu, 30011, Taiwan
cDepartment of Biomedical Engineering and Environmental Sciences, National Tsing Hua University, 101 Section 2, Kuang-Fu Road, Hsinchu, 30013, Taiwan. E-mail: radoong@mx.nthu.edu.tw
First published on 27th August 2019
Abstract
4-Nitrophenol (4-NP) is a promulgated priority pollutant, which can cause a negative impact on human health. The development of a direct and effective technique for the rapid detection and screening of 4-NP is, therefore, of urgent need. In this study, the blue luminescent sulfur-doped graphene quantum dots (S-GQDs) with a size of 1–5 nm are fabricated using a one-step pyrolysis procedure in the presence of citric acid and 3-mercaptosuccinic acid. The S-GQDs exhibit a strong emission band at 450 nm under the excitation of 330 nm UV light. 4-NP can serve as the fluorescence quencher by the π–π interaction with S-GQD, resulting in the linear decrease in fluorescence intensity after the addition of various 4-NP concentrations ranging from 10 nM to 200 μM. The S-GQDs serve as the sensing probe to enhance the analytical performance on 4-NP detection with the limit of detection values of 0.7 and 3.5 nM in deionized water and wastewater, respectively. The S-GQD based sensing platform can be used to detect 4-NP in different matrices of water and wastewater. In addition, the detected percentages of spiked 4-NP concentrations in the presence of different matrices and interferences are in the range of (98 ± 5)–(108 ± 2)%. Moreover, the S-GQD based paper sensor can rapidly screen 4-NP in wastewater within 1 min. Results obtained in this study clearly demonstrate the superiority of S-GQDs as a promising fluorescence probe for highly sensitive and selective detection of a wide concentration range of 4-NP in deionized water and wastewater.
Introduction
Nitrophenols such as 4-nitrophenol (4-NP) and 2,4-dinitrophenol are among the most recalcitrant organic pollutants in soil and aquatic environments, and can cause serious environmental problems due to their chemical stability and poor biodegradability.1 4-NP is one of the priority pollutants promulgated by the United States Environmental Protection Agency and the lifetime health advisory level is reported to be 60 μg L1.2 Although several Au-based nanomaterials such as Au–Fe3O4 nanostructures3,4 and Pt–Au@reduced graphene oxide (rGO)5 have been developed to decompose 4-NP in aquatic environments, a simple and low-cost analytical method for the rapid and effective monitoring of residual 4-NP in water and wastewater is still of urgent need.The traditional technique for the determination of 4-NP include gas chromatography, capillary electrophoresis, high performance liquid chromatography and electrochemical method.6–9 However, these methods usually need expensive instruments and tedious procedures for analysis. More recently, fluorescence spectrophotometry has been developed for highly sensitive detection of 4-NP.10–12 Yang et al.10 have used BSA Au-nanocrystals as a fluorescence probe to detect 4-NP in deionized water. Several nanomaterials including molecularly imprinting polymer-carbon dots (MIP-CD) and CdTe have also been synthesized as the fluorescence probe for 4-NP detection in deionized water.11,12 However, the sensitivity of these MIP-based sensing probes is not high and the limit of detection (LOD) are usually in the range of 40–60 nM. In addition, only deionized or river water was used as the water matrix and the information on the application of sensing probe to detect 4-NP in the complicated matrix is limited.
Graphene quantum dots (GQDs) is a newly developed fluorescence materials with excellent photoluminescence, good biocompatibility, low toxicity, easy fabrication, and large surface area.13–19 GQDs have recently been used as the sensing materials for the detection of a wide variety of analytes including metal ions, organics, and biomolecules.20–24 Usually the sensitivity of carbon-based quantum dots including carbon dots (CD) and GQDs toward analyte detection is dependent on quantum yield, which is related to the layers of quantum dots and dopants. The layer of GQDs is, in general, <10 layers and has less influence on the quantum yield in comparison with CD. Therefore, doping of graphic carbons with heteroatoms such as P, N, B and S atoms can not only amplify the photoluminescence behavior but also increase the quantum yield, resulting in the enhancement of sensing sensitivity and selectivity.25–29 In particular, doping with sulfur atom is relatively difficult in comparison with other dopants because of its electronegativity.30 Up to now, only limited studies on the fabrication of S-doped GQDs (S-GQDs) have been reported for sensing applications.26,31–33 Li et al.31 have used the top-down electrolysis method to fabricate S-GQDs from graphite for Fe ion detection. However, the particle size distribution of S-GQD is wide and inhomogeneous. Several studies have used 1,3,6-trinitropyrene and different sulfur-containing chemicals as the carbon and sulfur sources, respectively, for the fabrication of S-GQD to detect metal ions including Pb2+ and Ag+.32,33 Up to now, the development of S-GQD based sensing element for the detection of organic chemicals has received less attention.
Our previous work has synthesized Au@S-GQD nanocomposites for the detection of 4-NP using UV-visible absorption spectra. The ratiometric detection based on the change in wavelength ratio between 307 and 530 nm from 4-aminophenol, the reduction product of 4-NP, and surface plasma resonance of Au nanoparticles, respectively, was used to detect 4-NP.34 Although low limit of detection (LOD) in deionized water was obtained, the analytical performance is highly dependent on the size of Au nanoparticle and the reduction efficiency of 4-NP. Therefore, a simple and straightforward method for the rapid and effective detection of 4-NP may thus be needed. However, the use of pure S-GQDs as the fluorescence probe for directly detection of 4-NP has not been yet reported. Moreover, the analytical performance of S-GQD fluorophore toward 4-NP detection in different water and wastewater matrices remains unclear.
Herein, we have developed a simple and cost-effective one-step pyrolysis method for the fabrication of S-GQDs using citric acid and 3-mercaptosuccinic acid as the carbon and sulfur sources, respectively. The as-prepared S-GQDs are then used as the fluorescence probe to effectively detect 4-NP in aqueous solution with complex matrix. Scheme 1 illustrates the possible reaction mechanism of S-GQDs for the detection of 4-NP. The as-synthesized S-GQDs exhibit a distinct fluorescence peak at 450 nm under the excitation of 330 nm UV light at pHs of 5–9, which is highly sensitive and selective toward 4-NP detection. To the best of our knowledge, this is the first report on using fluorescent S-GQDs as the sensing platform for 4-NP detection in a wide variety of wastewaters. Addition of 4-NP effectively quenches the fluorescent intensity by π–π interaction and a dynamic range of 4 orders of magnitude with LOD of 0.7 nM in deionized water and 3.5 nM in wastewater is observed. Moreover, the S-GQD coated paper-based sensing technique has been developed to rapidly screen 4-NP in real wastewater samples within 1 min.
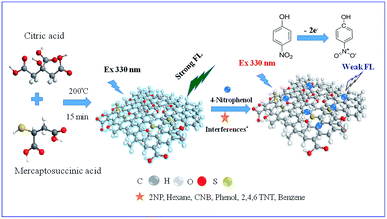 | ||
| Scheme 1 Schematic illustration of the fluorescence sensing of 4-nitrophenol by S-doped GQDs in real wastewater samples with different matrices. | ||
Experimental section
Fabrication of S-GQDs
The S-GQDs was synthesized using one-step pyrolysis method according to our previous report with minor modification.34 Briefly, 2.0 g citric acid (CA) and 27–240 mg of 3-mercaptosuccinic acid (MSA, Sigma-Aldrich) were added into 0.5 mL of ultrapure deionized water (18.2 MΩ cm) to get the MSA/CA ratio of 0.0135–0.12. Then mixture was heated to 200 °C in an oven and maintained for 15 min to produce S-GQDs with strong fluorescence. The S-GQDs with the bright yellow suspension were dialyzed with 1k dialysis bag for 24 h by adding ultrapure deionized water regularly to remove the residual chemicals. The harvested S-GQDs in deionized water were stored at room temperature.Characterization
The optical property including UV-visible and fluorescence spectra of as-synthesized S-GQDs was determined by Hitachi U-4100 UV-VIS-NIR and F-7000 fluorescence spectrophotometers (Tokyo, Japan), respectively. The topography as well as thickness of S-GQDs was investigated using Agilent 5500 scanning probe microscope in tapping mode. The morphology and particle size distribution of S-GQDs were examined using a transmission electron microscope (TEM, JEOL, JEM-ARM200F, Tokyo, Japan) and a high-resolution TEM (HR-TEM, JEOL JEM-2010) at 200 kV. X-ray photoelectron spectroscopy (XPS) was used to characterize the change in chemical species of S-GQDs by an ESCA Ulvac-PHI 1600 photoelectron spectrometer from Physical Electronics using Al Kα radiation photon energy at 1486.6 ± 0.2 eV. X-ray diffraction (XRD) patterns were recorded using a Bruker D8 X-ray diffractometer with Ni filtered Cu Kα radiation (λ = 1.5406 Å). Additionally, Raman spectra of S-GQDs were determined by using Bruker Senterra micro-Raman spectrometer equipped with an Olympus BX 51 microscope and an Andor DU420-OE CCD camera. The Fourier transform infrared (FTIR) spectra of S-GQDs were recorded with a Horiba FT720 spectrophotometer.Detection of 4-NP in deionized water by S-GQDs
The detection of 4-NP by S-GQDs was performed at room temperature based on the fluorescence quenching principle. To understand the concentration effect of S-GQDs on 4-NP detection, different S-GQD concentrations at 0.19 and 0.4 mg mL−1 were tested. As illustrated in Fig. S1 (ESI†), the change in fluorescence of S-GQDs at 0.19 and 0.4 mg mL−1 decreases from 1.0 ± 0.02 to 0.14 ± 0.01 and 0.135 ± 0.007, respectively, when 50 μM 4-NP were added. This result clearly indicates that the S-GQD concentration at 0.19–0.4 mg mL−1 has little influence on the analytical performance of S-GQDs toward 4-NP detection, presumable attributed to the fact that S-GQDs can provide sufficient reaction sites for 4-NP in the tested concentration range. Therefore, 10 μL of 19 mg mL−1 S-GQDs was added into 1 mL of deionized water to get the final S-GQD concentration of 0.19 mg mL−1. Various volumes of 4-NP stock solution were added to the S-GQD solution to get the final concentration of 0.01–200 μM. A total volume of 2 mL was used to determine the analytical performance of S-GQDs. All the mixtures were incubated for 1 min at room temperature and then the fluorescence signal of all the mixtures was measured from 350 to 600 nm after the excitation of 330 nm. The calibration curve of 4-NP was determined by the change in fluorescence intensity before and after the addition of different concentrations of target compound. To evaluate the pH effect, all the solutions were adjusted to pHs 5–9 by 0.1 M HCl or NaOH after the addition of 50 μM 4-NP. Moreover, the selectivity of sensing system was evaluated by adding other 9 nitroaromatic analogues including 2-nitrophenol (2-NP), 1-chloro-4-nitrobenzene (CNB), 2,4-,6-tronitrotoluene (TNT), hexane, and aromatic compounds (benzene, phenol, catechol, hydroquinone, and resorcinol) as the interferences into S-GQD solution and then the quenching effect of fluorescence was investigated after 1 min of incubation. All the experiments were performed in at least triplicate to ensure the quality control. The precision of intra and inter batches were controlled within 5 and 3%, respectively. In addition, the reproducibility of intra and inter samples during day studies was both controlled within 5%.Detection of 4-NP in wastewater samples
To evaluate the feasibility of using S-GQDs as the sensing probe to detect 4-NP in environmentally aqueous samples, standard addition method was used to spike various concentrations of 4-NP into different matrices of water and wastewaters including lake water and 3 effluents from wastewater treatment plants. The lake water was sampled from Cheng-Kung Lake in the campus of National Tsing Hua University (Hsinchu, Taiwan), while effluents from wastewater treatment plants were collected from metal industry, sewage and electroplating factory in Taoyuan City, Taiwan. The physicochemical property of the water and wastewater is shown in Table S1 (ESI†). To remove the suspended solids and impurities in wastewaters, all the solutions were first filtrated by 0.45 μm Millipore filter paper followed by C-18 SPE column.24 After the filtration, various concentrations of 4-NP at 0.05–200 μM were spiked into the real samples and then S-GQDs were added into the solutions. The fluorescence signal of the mixture was then measured immediately to evaluate the matrix effect of environmental samples on 4-NP detection by S-GQDs. Moreover, the traditional UV-visible method was used to determine the recovery of 4-NP in deionized water for comparison.Fabrication of S-GQDs-based paper sensors
The S-GQDs based paper strip was fabricated according to our previously reported results.24 Briefly, the cellulose filter paper with diameter of 125 mm and pore size of 25 μm was cut into 1 × 3.5 cm2 strips. The paper strip was spiked with 0.19 mg mL−1 S-GQDs solution for 10 min and then dried in an oven to form the paper-based sensing probe. The applicability of paper-based sensing probe was evaluated by immersing the paper strip into wastewater spiked with 0.1–500 μM 4-NP for 1 min. To achieve the visual detection on the change in fluorescence intensity, the paper based sensor was then irradiated with a 330 nm UV lamp and the optical image was recorded by a Sony digital camera. Moreover, the specificity of S-GQDs based paper sensor toward 4-NP detection was examined with other aromatic and nitroarene interferences.Results and discussion
Optimization of fabrication of S-GQDs
The fluorescence property as well as analytical performance of S-GQDs is highly dependent on the fabrication conditions. Therefore, the mass ratio of MSA/CA and the pH value during the fabrication of S-GQDs were first optimized. Fig. S2 (ESI†) shows the fluorescence intensity of S-GQDs prepared at various MSA/CA ratios. High fluorescence intensity of S-GQDs at MSA/CA ratio of 0.02 is clearly observed in comparison with other MSA/CA ratios, and, therefore, addition of 40 mg MSA is further used for the preparation of S-GQDs. Moreover, the influence of solution pH at 2–7 on the fabrication of S-GQDs was further explored. Since the original pH value of citric acid is around 2, NaOH pellets were used to adjust the solution pH to 5 and 7 for the fabrication of S-GQDs at MSA/CA ratio of 0.02. As shown in Fig. S3 (ESI†), the maximum fluorescence intensity of the as-prepared S-GQDs decreases when pH increases from 2 to 7. The decrease in fluorescence intensity of S-GQDs upon the increase in solution pH is mainly attributed to the relationship between the solution pH and the pKa of citric acid. The pKa values of triprotic citric acid are 3.13, 4.76 and 6.40, respectively. This means that citric acid is in its molecular form at low solution pH, which is conducive to the fabrication of S-GQD during the pyrolysis at 200 °C. After addition of 50 μM 4-NP, the fluorescence intensity of S-GQDs prepared at pH 2 decreases obviously because of the initially high fluorescence intensity. However, the fluorescence intensity of S-GQDs prepared at pH 5–7 only changes slightly when high concentration of 4-NP at 200 μM is added. This result clearly indicates that pH may influence the analytical performance, and only S-GQDs prepared at pH 2 show excellent ability toward 4-NP detection.The structural characterization of S-GQDs
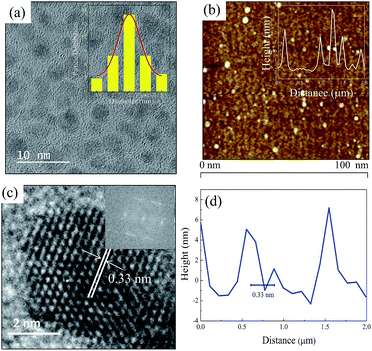
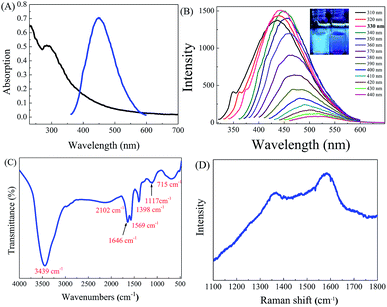
Fig. 1a shows the TEM image and histogram of the as-prepared S-GQDs. The as-prepared S-GQDs are quite homogeneous and uniformly distributed with particle and mean diameters of 1–5 and 3 nm, respectively. The atomic force microscopic image illustrated in Fig. 1b indicates that height profile is in the range of 1.5–4.0 nm with an average size of 3.0 nm, confirming the successful formation of S-GQDs with 3–8 layers in thickness (inset of Fig. 1b). Moreover, the surface roughness shown in the below of Fig. 1b is relatively smooth and uniform, reflecting the successful fabrication of homogeneous S-GQDs. The HRTEM image displays the fringes of carbon lattice of S-GQDs (Fig. 1c). The fast Fourier transform (FFT) pattern also corroborates that the S-GQDs are single crystal (inset Fig. 1c). The lattice spacing in Fig. 1d deciphers the average inter-planar of 0.33 nm, which corresponds to the (002) peak of graphitic carbon. The XRD pattern of S-GQDs (Fig. S4, ESI†) also exhibits a typically broad (002) plane of graphene peak at 24.3° 2θ, clearly indicating the successful fabrication of GQD nanosheets.The optical property of as-prepared S-GQDs was explored by UV-visible and fluorescence spectra. As shown in Fig. 2A, the S-GQDs exhibit UV-visible spectra with an absorption peak at 280 nm. Meanwhile, a shoulder peak at 230 nm, which corresponds to the π–π* transition of sp2 domain, is also observed. The absorption band at 280 nm is attributed to the n–π* transition of carbonyl groups.14 Moreover, the S-GQDs exhibit good fluorescent property and a strong emission wavelength at 450 nm is obtained upon the excitation of 330 nm UV light. To further elucidate the fluorescence property of S-GQDs, the emission spectra of S-GQDs were recorded after the excitation of UV light at 310–440 nm. As illustrated in Fig. 2B, the wavelength peak of S-GQDs red-shifts from 450 to 530 nm with the increase in excitation wavelength. Besides, the emitted fluorescence intensity increases at short wavelength of 310–330 nm and then decreases upon increasing the wavelength from 340 to 440 nm, which is consistent with the previous reports.15,23,24 These obtained optical properties clearly indicate that S-GQDs can produce highest fluorescence intensity at 330 nm, which may exhibit the superior photoluminescence property to detect 4-NP.
The quantum yield of fluorophore plays an important role in fluorescent sensing system. In this study, the fluorescence quantum yield, determined by using fluorescein as the standard fluorophore, is calculated to be 11%, which is satisfactory for sensing application. Dutta Chowdhury and Doong23 has used pyrolysis method to fabricate GQDs using citric acid as the carbon source and found that the quantum yield of as-synthesized GQDs was 10.2%. Several studies have also indicated that the quantum yield of GQD based materials can be enhanced by the introduction of heteroatoms including N, S, and B into GQDs.24,31,35 The relatively high quantum yield of S-GQDs may be possibly ascribed to the existence of S–OH and S![[double bond, length as m-dash]](https://www.rsc.org/images/entities/char_e001.gif) O on the surface of GQDs. The EDS spectrum of as-prepared S-GQDs from TEM image shows that the atomic percentage of C, O and S is 89.7, 6.0 and 4.3 wt%, respectively (Fig. S5, ESI†), and the content of sulfur atom in GQDs (4.3 wt%) is higher than the previous reports.26,31 The doping of anions such as B and S into graphic carbon can serve as the electron trap center to change the electron density of graphic carbon,25,35 resulting in the improvement the electrical features as the electronic band structures are altered to a significant extent.
O on the surface of GQDs. The EDS spectrum of as-prepared S-GQDs from TEM image shows that the atomic percentage of C, O and S is 89.7, 6.0 and 4.3 wt%, respectively (Fig. S5, ESI†), and the content of sulfur atom in GQDs (4.3 wt%) is higher than the previous reports.26,31 The doping of anions such as B and S into graphic carbon can serve as the electron trap center to change the electron density of graphic carbon,25,35 resulting in the improvement the electrical features as the electronic band structures are altered to a significant extent.
The FTIR and Raman spectra were further applied to examine the functional groups and carbon structures of as-prepared S-GQDs. Fig. 2C shows the FTIR spectrum of as-prepared S-GQDs. The S-GQDs exhibit a strong O–H peak at 3439 cm−1, indicating the good hydrophilic property of S-GQDs. A small and broad peak at 2966 cm−1 is the stretching vibration of C–H functional group in graphitic backbone of S-GQDs. Moreover, the small bands at 2102 cm−1 and 1569–1646 cm−1 are also from the bending vibration of C–C and C![[double bond, length as m-dash]](https://www.rsc.org/images/entities/char_e001.gif) C bonds of graphitic backbone, respectively. Several sulfur-containing functional groups from the stretching vibration of S
C bonds of graphitic backbone, respectively. Several sulfur-containing functional groups from the stretching vibration of S![[double bond, length as m-dash]](https://www.rsc.org/images/entities/char_e001.gif) O, C
O, C![[double bond, length as m-dash]](https://www.rsc.org/images/entities/char_e001.gif) S and S–OH functional groups at 1398, 1117 and 715 cm−1, respectively, indicate the successful doping of S atoms onto carbon backbone of S-GQDs.36,37 Moreover, Raman spectrum is also provided in this study to characterize the carbon-based materials. As shown in Fig. 2D, two peaks located at 1360 and 1584 cm−1 are the characteristic peaks of D and G bands, respectively. The ID/IG ratio of 0.94 implies the decrease in defect of sp2 carbon lattice.38
S and S–OH functional groups at 1398, 1117 and 715 cm−1, respectively, indicate the successful doping of S atoms onto carbon backbone of S-GQDs.36,37 Moreover, Raman spectrum is also provided in this study to characterize the carbon-based materials. As shown in Fig. 2D, two peaks located at 1360 and 1584 cm−1 are the characteristic peaks of D and G bands, respectively. The ID/IG ratio of 0.94 implies the decrease in defect of sp2 carbon lattice.38
XPS was further used to identify the chemical species of elements in S-GQDs. The survey scan of XPS spectra shows O 1s, S 1s, S 2s and S 2p peaks at 532, 284, 168 and 162 eV, respectively (Fig. 3A). After peak deconvolution, the C 1s spectrum of S-GQDs (Fig. 3B) exhibits four peaks at 283.9, 284.5, 285.5 and 287.5 eV, which can be assigned as C–C, C![[double bond, length as m-dash]](https://www.rsc.org/images/entities/char_e001.gif) C, C–S and C
C, C–S and C![[double bond, length as m-dash]](https://www.rsc.org/images/entities/char_e001.gif) O functional groups, respectively.26,39 The deconvoluted O 1s spectrum shows the characteristic C–O, C
O functional groups, respectively.26,39 The deconvoluted O 1s spectrum shows the characteristic C–O, C![[double bond, length as m-dash]](https://www.rsc.org/images/entities/char_e001.gif) O, and C–OH/C–O–C peaks at 531.5, 531.9 and 533.5 eV, respectively (Fig. 3C).39,40, 41 Moreover, the S 2p signal of S-GQDs contains two peaks at 161.6 and 168.5 eV, respectively, which are the S 2p3/2 and S 2p1/2 peaks of spin–orbit coupling of S2− or oxidized S species (–SOn−) (Fig. 3D).32,42 These results clearly indicate that S atoms are successfully doped, and can react with the abundant O-containing functional groups for the enhanced detection of 4-NP by S-GQDs.
O, and C–OH/C–O–C peaks at 531.5, 531.9 and 533.5 eV, respectively (Fig. 3C).39,40, 41 Moreover, the S 2p signal of S-GQDs contains two peaks at 161.6 and 168.5 eV, respectively, which are the S 2p3/2 and S 2p1/2 peaks of spin–orbit coupling of S2− or oxidized S species (–SOn−) (Fig. 3D).32,42 These results clearly indicate that S atoms are successfully doped, and can react with the abundant O-containing functional groups for the enhanced detection of 4-NP by S-GQDs.
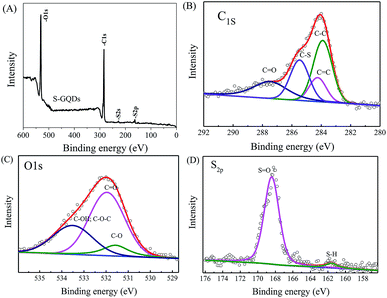 | ||
| Fig. 3 XPS spectra of (A) survey spectra and deconvoluted (B) C 1s, (C) O 1s, and (D) S 2p peaks of as-prepared S-GQDs. | ||
Detection of 4-NP by S-GQDs
The fluorescence intensity of fluorophore is highly dependent on solution pH and, therefore, the effect of pH on the fluorescence intensity of S-GQDs was evaluated. Fig. S6 (ESI†) shows the fluorescence intensity of S-GQDs as a function of pH ranging from 5 to 9. The emitted fluorescence intensity of S-GQDs increases under weakly acidic conditions (pH 5–7) and then reaches the plateau when pH is >7. After addition of 200 μM 4-NP, the fluorescence intensity decreases dramatically, indicating the good quenching effect of 4-NP on the fluorescence emission of S-GQDs. Fig. 4a shows the change in fluorescence intensity of S-GQDs as a function of pH. The fluorescence intensity of S-GQDs increases rapidly from pH 5 to 7 and then slowly reaches the maximum fluorescence intensity at pH 7–9. In addition, the response time of S-GQDs was investigated. As shown in Fig. 4b, the fluorescence intensity decreases dramatically within 1 min and remain constant after 5 min, clearly indicating the rapid response of the developed sensor for the detection of 4-NP. Therefore, pH 7 and reaction time of 1 min are selected in this study for further experiments.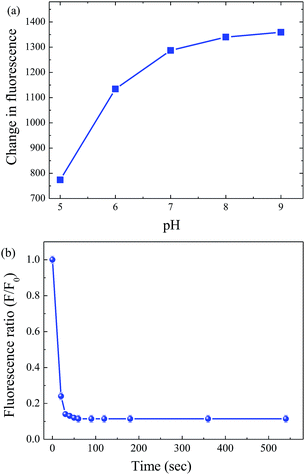 | ||
| Fig. 4 The change in fluorescence intensity of S-GQDs as a function of (a) pH and (b) response time after the addition 200 μM 4-NP. | ||
The analytical performance of S-GQDs toward 4-NP detection was evaluated by adding 4-NP into the solution containing 0.19 mg mL−1 S-GQDs. Fig. 5A shows the fluorescence spectra of S-GQDs in deionized water in the presence of 0.01–200 μM 4-NP. The fluorescence intensity at 450 nm decreases obviously upon the increase in 4-NP concentration. A 94% decrease in fluorescence peak intensity is observed when 4-NP concentration increases from 0 to 200 μM. In addition, the peak wavelength shifts from 450 to 472 nm, which is mainly attributed to the π–π interaction and hydrogen bonding between 4-NP and S-GQDs. Although the maximum peak shifts slightly after the addition of various concentrations of 4-NP, the initial fluorescence intensity of S-GQDs in the absence of 4-NP (F0) is fixed in all the measurements. Therefore, the ratio of maximum peak intensity before and after the addition of 4-NP can be used to detect 4-NP. It is noteworthy that the as-prepared GQDs exhibit less fluorescence quenching effect in comparison with S-GQDs and only 29% decrease in fluorescence intensity are observed at 200 μM 4-NP (Fig. S7, ESI†), clearly showing that the doping with S atoms can enhance the analytical sensitivity toward 4-NP detection.
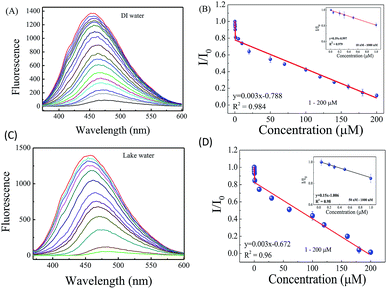 | ||
| Fig. 5 The (A) fluorescence emission spectra of S-GQDs in the presence of 4-NP at 10 nM–200 μM in deionized water, (B) the calibration curve of 4-NP by S-GQDs in deionized water, the (C) fluorescence emission spectra of S-GQDs at 0.05–200 μM 4-NP in lake water, and (D) the calibration curve of 4-NP by S-GQDs in lake water. The insets of Fig. 5B and D are the calibration curves of low concentration of 4-NP in deionized and lake waters, respectively. | ||
Fig. 5B shows the change in fluorescence intensity ratio (F/F0) as a function of 4-NP concentration where F and F0 are the fluorescence intensity of S-GQDs in the presence and absence of 4-NP, respectively. A two-stage linear relationship between the F/F0 and 4-NP concentration is obtained. The F/F0 decreases rapidly in the 4-NP concentration range of 10–1000 nM, and then a linear decrease with a correlation coefficient (r2) of 0.984 is observed when the 4-NP concentration in the deionized water increases from 1 to 200 μM. Moreover, the low 4-NP concentration also exhibits a good linearity with r2 of 0.979 (Inset of Fig. 5B). Several studies have indicated the 2-stage linear behavior when carbon-based quantum dots were used as the sensing elements.27,29,34,43 Tang et al.43 have fabricated rGO/Au based nanosensor to detect 4-NP and a two-linear relationship in the concentration range of 0.05–2.0 μM and 4.0–100 μM was obtained. Ganganboina et al.29 have prepared the N-doped GQD-decorated V2O5 nanosheet for fluorescence detection of cysteine and a two-stage linear response to cysteine in the concentration range of 0.1–15 μM and 15–125 μM was observed because of the heterogeneously surface-mediated reaction. Our previous study34 has indicated that 4-NP can be rapidly adsorbed onto the Au@S-GQD surface by π–π interaction at low 4-NP concentration and then slowly occupy the active sites on the Au@S-GQD surface at high concentration, resulting in the two different linear regions at low and high concentrations when UV-visible ratiometric method was used. In this study, we also found that 4-NP can react with S-GQD by π–π interaction, and subsequently quenches the fluorescence intensity of S-GQDs by a two-stage linear relationship. The LOD, determined by the 3σ/S, where σ is the standard deviation of the lowest signal and S is the slope of linear calibration plot, is 0.7 nM, which is superior to the method using UV-visible ratiometric and other methods.34,43 Since this phenomenon is mainly based on the physically surface-mediated reaction, one LOD value is sufficient to represent the sensitive of the S-GQD based sensing platform.
To further understand the applicability of the developed sensing platform on the detection of 4-NP in real water and wastewater environments, the contaminated lake water collected from NTHU campus was used as the model matrix. As shown in Fig. 5C, the fluorescence intensity of S-GQDs decreases with the increase in 4-NP concentration and around 95% decrease in fluorescence intensity is observed at 200 μM 4-NP in comparison with the pure S-GQDs in the absence of 4-NP. Similar to the sensing behavior in deionized water, the 4-NP detection by S-GQD in lake water exhibits good linear relationship in the concentration ranges of 0.05–1 μM and 1–200 μM with r2 of 0.98 and 0.96, respectively (Fig. 5D). In addition, the LOD of 4-NP detection in lake water is calculated to be 3.5 nM, which is higher than that in deionized water because of the high TOC concentration in lake water. It is also interesting to note that the fluorescence emission of S-GQDs is stable and the intensity remains unchanged after 6 months of storage in air at room temperature (Fig. S8, ESI†). Although the two-stage linearity is obtained in wastewater, the use of the quantitative indicator, F/F0, is still valid to indicate the suitable concentration range for practical application. These results clearly depict that the S-GQD is a stably excellent sensing probe, which can sensitively detect 4-NP in aqueous solutions with various matrices.
Table 1 shows the linear range and LOD value of 4-NP detected by various optical- and electrochemical-based sensing nanomaterials. Several studies have used electroactive nanomaterials as the sensing element for the detection of 4-NP in different water matrices, and the dynamic range of 4-NP is 2–3 orders of magnitude with LOD values of 10–42 nM.6,43,44 In addition, the fluorescence methods using Au nanocrystal as the fluorescence probe have been developed to detect 4-NP in deionized water and a linear range of 0.001–0.5 μM with LOD of 1 nM was observed.10 Moreover, the fluorescence sensors fabricated by MIP and quantum dots have been fabricated for the detection of 4-NP.9,11,12 The dynamic range of MIP-CD-based sensors is in the range of 0.2–50 μM with LOD of 40–60 nM.9,11,12 In this study, a wide dynamic range of 4 orders of magnitude with low LOD values of 0.7–3.5 nM in different matrices of aqueous solution is obtained, which is superior to the most reported data shown in Table 1.
| Method | Probe | Sample matrix | Linear range (μM) | LOD (nM) | Ref. |
|---|---|---|---|---|---|
| Electrochemistry | rGO/Au NPs | Lake water | 0.05–2 | 10 | 43 |
| 4–100 | |||||
| ZnO/GCE | DI water | 1–400 | 20 | 6 | |
| rGO/GCE | Acetate buffer | 50–800 | 42 | 44 | |
| Fluorescence | BSA Au–NCs | DI water | 0.001–0.5 | 1 | 10 |
| MIP-C-dots | DI water | 0.2–50 | 60 | 9 | |
| QD@MIPs | DI water | 0.2–8 | 51 | 12 | |
| CdTe@MIP | DI water | 1–30 | 40 | 11 | |
| UV-visible | Au@S-GQD | DI water | 0.005–1 | 3.5 | 34 |
| 1–50 | |||||
| Food wastewater | 0.01–1.8 | 8.4 | |||
| 1.8–50 | |||||
| Fluorescence | S-GQDs | DI water | 0.01–1.0 | 0.7 | This study |
| 1.0–200 | |||||
| Lake water | 0.05–1.0 | 3.5 | |||
| 1.0–200 |
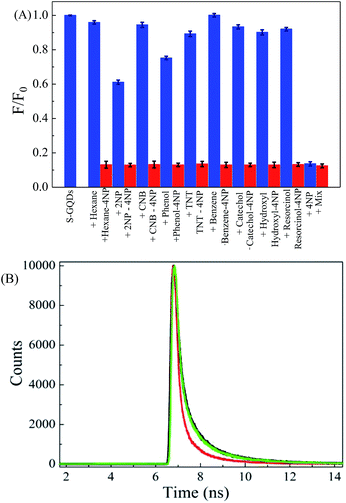
The high selectivity of sensing probe toward target compound detection is always important for the successful application to real samples. Therefore, the selectivity of S-GQD based sensing probe was further evaluated by adding 9 different aromatic compounds and nitroarenes into deionized water. Moreover, concentration of interferences used was 200 μM, which is 4 times higher than that of 4-NP (50 μM). Fig. 6A shows the effect of interference species on the F/F0 ratio of S-GQD in the presence of 4-NP. It is clear that the F/F0 ratio of S-GQDs in the presence of 50 μM 4-NP and most interference species including hexane, CNB, TNT, benzene, catechol, hydroquinone, and resorcinol remains almost unchanged (<10%). Although addition of 200 μM 2-NP and phenol exhibits a relatively obvious decrease in F/F0 ratio (62–76%) in comparison with other interference species, the change in F/F0 is still much lower than that of 4-NP. After mixing each interference with 4-NP in solution, the F/F0 ratios of S-GQDs in all mixtures are in the range of 0.129–0.35, which is almost the same as 4-NP only (F/F0 = 0.125). This result clearly indicates the superior selectivity of S-GQDs toward 4-NP detection. The high selectivity of 4-NP is mainly attributed to the resonance stability and steric effect. It is noteworthy that pKa values of 4-NP and 2-NP are 6.90 and 7.2, respectively,45 which mean that nitrophenol would produce nitrophenolate ions at pH 7.0. The negatively charged O atoms on 4-nitrophenolate ions can be delocalized throughout the benzene ring and become more resonance-stabilized than those of 2-nitrophenolate ions and other aromatic compounds.45,46 In addition, the steric hindrance effect lowers the inductive effect of the nitro group on 2-nitrophenolate ions compared with that of 4-nitrophenolate ions. Therefore, S-GQDs have a high selectivity on 4-NP detection in comparison with other aromatic compounds selected in this study.
The quenching mechanism for 4-NP detection by S-GQDs can be explained by both dynamic quenching and static quenching. Fig. 6B shows the time-resolved fluorescence spectra of S-GQDs in the absence and presence of 50–200 μM 4-NP. The fluorescence decay of S-GQDs in the absence of 4-NP is 7.1 ns and becomes more rapid after the addition of 4-NP. The fluorescence emission is found to decay on a time scale of 7.09 ns at 50 μM 4-NP and then again decreases to 7.01 ns when the concentration of 4-NP increases to 200 μM, showing that the fluorescence quenching mechanism is a dynamic quenching process. The significant quenching may occur via the π–π interaction and hydrogen bonding between 4-NP and S-GQDs. The primary π-bond networks on the surface of S-GQDs play the crucial role in recognizing the target compound without treatment and passivation. Consequently, the fluorescence emission of S-GQDs is slightly red-shifted after addition of high concentration of 4-NP.
Detection of 4-NP in wastewater
To evaluate the reliability and applicability of the developed method, the fluorescence S-GQDs probe was further used for the detection of 4-NP in different real wastewater samples by standard addition method. Moreover, the recovery of 4-NP in deionized water using S-GQD sensing probe and traditional UV-visible method was examined and compared. As illustrated in Table 2, the recovery of low concentration of 10 nM 4-NP by S-GQDs is 110 ± 2% in deionized water. Different from the S-GQD sensing probe, the traditional UV-visible method can only detect 4-NP > 1 μM, and the recoveries of 10 and 50 μM of 4-NP by UV-visible method are 103 ± 7% and 98 ± 5%, respectively. It is noteworthy that the fluorescence S-GQD probe can detect low concentration of 4-NP and the recovery is comparable with the traditional UV-visible method, clearly indicating the superiority of S-GQD as the sensing element for 4-NP detection.| Methods | Added concentration | Detected concentration | Recovery (%) (n = 3) |
|---|---|---|---|
| S-GQD method | 10 nM | 11 nM | 110 ± 2 |
| Traditional UV-visible method | 10 μM | 10.3 μM | 103 ± 7 |
| 50 μM | 48.9 μM | 98 ± 5 |
The real sample study was conducted by selecting three wastewater samples with different matrices including the industrial wastewater treatment plants and contaminated lake water. Table 3 shows the analytical performance of 4-NP using S-GQDs as the fluorescence probe in wastewaters. A total of 36 samples in 4 different categories were analyzed. The 4-NP concentration in all wastewaters are lower than the LOD value, and, therefore, known concentrations of 4-NP were spiked into the wastewater to understand the matrix effect of real samples. The spiked concentrations of 4-NP were in the range of 100 nM–100 μM to cover all the possible contaminated ranges in wastewater. After spiking medium (0.1–1 μM) and high (10–100 μM) concentrations of 4-NP into wastewater, the detected concentrations of 4-NP are close to the spiked ones and the detected percentages of spiked 4-NP are in the range of (98 ± 4)–(108 ± 2)%, clearly depicting that S-GQD is a promising fluorescence probe to effectively monitor a wide range of 4-NP concentration in real wastewater.
| Sample name | Added concentration | Detected concentration | Detected percentage (%) (n = 3) |
|---|---|---|---|
| Metal industrial wastewater | 50 nM | 49 nM | 98 ± 4 |
| 100 nM | 99 nM | 99 ± 3 | |
| 1 μM | 1.07 μM | 107 ± 5 | |
| Electroplating wastewater | 100 nM | 105 nM | 105 ± 4 |
| 500 nM | 490 nM | 98 ± 5 | |
| 10 μM | 10.2 μM | 102 ± 5 | |
| Sewage | 200 nM | 199 nM | 99.5 ± 2 |
| 20 μM | 21 μM | 105 ± 3 | |
| 50 μM | 51.5 μM | 103 ± 5 | |
| Lake water | 1 μM | 1.03 μM | 103 ± 3 |
| 10 μM | 10.8 μM | 108 ± 2 | |
| 100 μM | 102 μM | 102 ± 6 |
Rapid screening of 4-NP using S-GQD paper based sensors
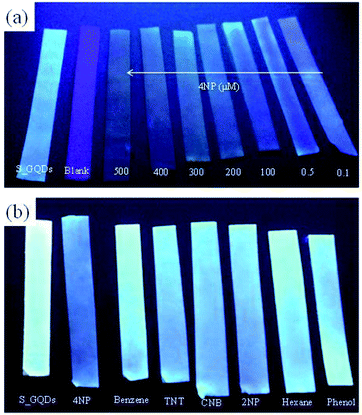
The simplicity of sensing probe is also one of the important parameters to evaluate the applicability of nanosensors. After successful application of S-GQDs to selectively and sensitively detect 4-NP in different matrices of wastewaters, the S-GQD-based paper sensor was fabricated to rapidly screen 4-NP in wastewater according to our previous report.24 The wastewater sample was chosen from metal industry. Fig. 7a illustrates the optical image of S-GQD-based paper sensor after immersing into wastewater spiking with 0.1–500 μM 4-NP for 1 min. In the absence of 4-NP, the paper sensor emits a bright blue fluorescence after the irradiation of 330 nm UV light. In contrast, the fluorescence of S-GQD paper strip turns into faint upon the increase in 4-NP concentration in wastewater, clearly indicating that the developed S-GQD paper strip can serve as a sensing platform for the rapid screening of a wide concentration range of 4-NP in wastewater. Besides, the paper strip based sensing platform shows excellent selectivity toward 4-NP detection. As shown in Fig. 7b, the color of paper strip based sensing probe in the presence of 200 μM interferences including hexane, phenol, TNT, benzene, 2-NP and CNB is similar to that of blank. However, the color of S-GQDs based paper strip changes to blue when 0.5 μM 4-NP is added to the wastewater, clearly depicting the high flexibility of using S-GQD paper-based sensors to rapid detection of 4-NP in real wastewater effluents. The preparation of environmentally benign GQD-based nanomaterials as well the increase in quantum yield is always important for environmental application. In this study, the quantum yield still leaves a room to improve. It is noteworthy that agricultural products such as orange, grape and citron contain plenty of organic constituents like glucose and citric acid as well as small amounts of nitrogen and sulfur, which are ideal raw materials for the preparation of environmentally friendly doped-GQDs. Further study on the fabrication of doped-GQDs with high quantum yield using agricultural products as the starting materials would be a green and novel synthesis route for the preparation of low cost and environmental benign sensing materials for environmental application in water and wastewater.Conclusions
In this study, we have developed a novel and simple synthesis method for the highly sensitive and selective detection of 4-NP in water and wastewater samples with different matrices. The uniformly distributed S-GQDs with diameter of 1–5 nm can stably emit fluorescence at 450 nm to act as the sensing element, and the doping with S atoms enhances the fluorescence quantum yield. 4-Nitrophenol can serves as the fluorescence quencher to extinct the fluorescence intensity by π–π interaction with the graphitic carbon backbone of GQDs, thus making S-GQD a promising sensing element for highly sensitive detection of 4-NP. The S-GQDs display an excellent ability toward 4-NP detection and a dynamic range of 3–4 orders of magnitude with LOD value of 0.7 nM in deionized water and 3.5 nM in wastewater is obtained. Moreover, the S-GQD based sensing platform can be employed for the determination of 4-NP in different matrices of water and wastewater and the detected percentages of (98 ± 4)–(108 ± 2)% are obtained at 4-NP concentration of 0.05–100 μM. Furthermore, S-GQDs paper base sensors demonstrates the applicability to rapid screen of 0.1–500 μM 4-NP in wastewater without obvious matrix interference. In conclusion, our results clearly indicate the superiority of S-doped GQDs to rapidly and efficiently detect 4-NP, which can pave a new way to fabricate GQD-based fluorescence probe to monitor nitroarenes and other contaminants in aqueous solution with a wide variety of matrix effects.Conflicts of interest
There are no conflicts to declare.Acknowledgements
The authors thank the Ministry of Science and Technology (MOST), Taiwan for financial support under grant no. MOST 105-2113-M-009-023-MY3 and 107-2911-I-007-302.References
- V. Inglezakis, S. Malamis, A. Omirkhan, J. Nauruzbayeva, Z. Makhtayeva, T. Seidakhmetov and A. Kudarova, J. Environ. Manage., 2017, 203, 825–830 CrossRef CAS PubMed.
- I. Tapsoba, S. Bourhis, T. Feng and M. Pontie, Electroanalysis, 2009, 21, 1167–1176 CrossRef CAS.
- F. H. Lin and R. A. Doong, J. Phys. Chem. C, 2017, 121, 7844–7853 CrossRef.
- F. H. Lin and R. A. Doong, J. Phys. Chem. C, 2017, 121, 7844–7853 CrossRef.
- J. J. Lv, A. J. Wang, X. H. Ma, R. Y. Xiang, J. R. Chen and J. J. Feng, J. Mater. Chem. A, 2015, 3, 290–296 RSC.
- A. Santhoshkumar, H. P. Kavitha, R. Suresh, J. P. Venila, S. P. Kumar and V. Narayanan, J. Mater. Sci.: Mater. Electron., 2017, 28, 9272–9278 CrossRef CAS.
- Y. Q. Cheng, Y. H. Li, D. Li, B. Zhang, R. F. Hao and S. B. Sang, Int. J. Electrochem. Sci., 2017, 12, 7754–7764 CrossRef CAS.
- A. E. Vilian, S. R. Choe, K. Giribabu, S. C. Jang, C. Roh, Y. S. Huh and Y. K. Han, J. Hazard. Mater., 2017, 333, 54–62 CrossRef CAS PubMed.
- S. Wu, S. Fan, S. Tan, J. Wang and C. P. Li, RSC Adv., 2018, 8, 775–784 RSC.
- X. Yang, J. Wang, D. Su, Q. Xia, F. Chai, C. Wang and F. Qu, Dalton Trans., 2014, 43, 10057–10063 RSC.
- T. Hao, X. Wei, Y. Nie, Y. Xu, Y. Yan and Z. Zhou, Microchim. Acta, 2016, 183, 2197–2203 CrossRef CAS.
- J. Yu, X. Wang, Q. Kang, J. Li, D. Shen and L. Chen, Environ. Sci.: Nano, 2017, 4, 493–502 RSC.
- M. Hassan, E. Haque, K. R. Reddy, A. I. Minett, J. Chen and V. G. Gomes, Nanoscale, 2014, 6, 11988–11994 RSC.
- Y. Yan, Q. Liu, X. Du, J. Qian, H. Mao and K. Wang, Anal. Chim. Acta, 2015, 853, 258–264 CrossRef CAS PubMed.
- A. B. Ganganboina, A. Dutta Chowdhury and R. A. Doong, ACS Sustainable Chem. Eng., 2017, 5, 4930–4940 CrossRef CAS.
- S. Zhu, X. Yan, J. Sun, X.-E. Zhao and X. Wang, Talanta, 2019, 200, 163–168 CrossRef CAS PubMed.
- X. Yan, X. E. Zhao, J. Sun, S. Zhu, C. Lei, R. Li, P. Gong, B. Ling, R. Wang and H. Wang, Sens. Actuators, B, 2018, 263, 27–35 CrossRef CAS.
- X. E. Zhao, C. Lei, Y. Gao, H. Gao, S. Zhu, X. Yang, J. You and H. Wang, Sens. Actuators, B, 2017, 253, 239–246 CrossRef CAS.
- X. Zhao, C. Lei, Y. Wang, F. Qu, S. Zhu, H. Wang and J. M. You, RSC Adv., 2016, 6, 72670–72675 RSC.
- A. Ananthanarayanan, X. Wang, P. Routh, B. Sana, S. Lim, D. H. Kim, K. H. Lim, J. Li and P. Chen, Adv. Funct. Mater., 2014, 24, 3021–3026 CrossRef CAS.
- J. Lu, M. Yan, L. Ge, S. Ge, S. Wang, J. Yan and J. Yu, Biosens. Bioelectron., 2013, 47, 271–277 CrossRef CAS PubMed.
- F. Wang, Z. Gu, W. Lei, W. Wang, X. Xia and Q. Hao, Sens. Actuators, B, 2014, 190, 516–522 CrossRef CAS.
- A. Dutta Chowdhury and R. A. Doong, ACS Appl. Mater. Interfaces, 2016, 8, 21002–21010 CrossRef CAS PubMed.
- N. T. N. Anh, A. D. Chowdhury and R. A. Doong, Sens. Actuators, B, 2017, 252, 1169–1178 CrossRef.
- K. Bindumadhavan, P. Y. Chang and R. A. Doong, Electrochim. Acta, 2017, 243, 282–290 CrossRef CAS.
- X. Li, S. P. Lau, L. Tang, R. Ji and P. Yang, Nanoscale, 2014, 6, 5323–5328 RSC.
- A. Ananthanarayanan, Y. Wang, P. Routh, M. A. Sk, A. Than, M. Lin, J. Zhang, J. Chen, H. Sun and P. Chen, Nanoscale, 2015, 7, 8159–8165 RSC.
- Z. Yan, X. Qu, Q. Niu, C. Tian, C. Fan and B. Ye, Anal. Methods, 2016, 8, 1565–1571 RSC.
- A. B. Ganganboina, A. Dutta Chowdhury and R. A. Doong, ACS Appl. Mater. Interfaces, 2017, 10, 614–624 CrossRef PubMed.
- X. Wang, G. Sun, P. Routh, D. H. Kim, W. Huang and P. Chen, Chem. Soc. Rev., 2014, 43, 7067–7098 RSC.
- S. Li, Y. Li, J. Cao, J. Zhu, L. Fan and X. Li, Anal. Chem., 2014, 86, 10201–10207 CrossRef CAS PubMed.
- S. Bian, C. Shen, H. Hua, L. Zhou, H. Zhu, F. Xi, J. Liu and X. Dong, RSC Adv., 2016, 6, 69977–69983 RSC.
- S. Bian, C. Shen, Y. Qian, J. Liu, F. Xi and X. Dong, Sens. Actuators, B, 2017, 242, 231–237 CrossRef CAS.
- N. T. N. Anh and R. A. Doong, ACS Appl. Nano Mater., 2018, 1, 2153–2163 CrossRef.
- A. B. Ganganboina, A. Dutta Chowdhury and R. A. Doong, ACS Appl. Mater. Interfaces, 2017, 10, 614–624 CrossRef PubMed.
- A. E. Segneanu, I. Gozescu, A. Dabici, P. Sfirloaga and Z. Szabadai, Macro Nano Spectrosc., 2012, 145–164 CAS.
- T. Alizadeh and M. Shokri, Sens. Actuators, B, 2016, 222, 728–734 CrossRef CAS.
- J. C. Vinci, I. M. Ferrer, N. W. Guterry, V. M. Colon, J. F. Destino, F. V. Bright and L. A. Colon, Appl. Spectrosc., 2015, 69, 1082–1090 CrossRef CAS PubMed.
- M. Gholinejad, J. Ahmadi, C. Nájera, M. Seyedhamzeh, F. Zareh and M. K. Zareh, ChemCatChem, 2017, 9, 1442–1449 CrossRef.
- X. Yang, M. Liu, Y. Yin, F. Tang, H. Xu and X. Liao, Sensors, 2018, 18, 964 CrossRef PubMed.
- G. Wang, Q. Guo, D. Chen, Z. Liu, X. Zheng, A. Xu, S. Yang and G. Ding, ACS Appl. Mater. Interfaces, 2018, 10, 5750–5759 CrossRef CAS PubMed.
- N. Qin, Y. Liu, W. Wu, L. Shen, X. Chen, Z. Li and L. Wu, Langmuir, 2015, 31, 1203–1209 CrossRef CAS PubMed.
- Y. Tang, R. Huang, C. Liu, S. Yang, Z. Lu and S. Luo, Anal. Methods, 2013, 5, 5508–5514 RSC.
- P. Wiench, B. Grzyb, Z. Gonzalez, R. Menendez, B. Handke and G. Gryglewicz, J. Electroanal. Chem., 2017, 787, 80–87 CrossRef CAS.
- T. B. Nguyen, C. P. Huang and R. A. Doong, Appl. Catal., B, 2019, 240, 337–347 CrossRef CAS.
- F. H. Lin and R. A. Doong, J. Phys. Chem. C, 2017, 121, 7844–7853 CrossRef.
Footnote |
| † Electronic supplementary information (ESI) available. See DOI: 10.1039/c9ra04414k |
| This journal is © The Royal Society of Chemistry 2019 |

