 Open Access Article
Retracted Article: A versatile strategy for alternately arranging the foam ratio layers of multilayer graphene/thermoplastic polyurethane composite foams towards lightweight and broadband electromagnetic wave absorption
Chaozhi Wang ,
Jiang Li
 * and
Shaoyun Guo
The State Key Laboratory of Polymer Materials Engineering, Polymer Research Institute of Sichuan University, Chengdu 610065, China. E-mail: li_jiang@scu.edu.cn; Fax: +86-28-85466077; Tel: +86-28-85466077
First published on 31st July 2019
Abstract
A broadband electromagnetic wave (EW) absorbing material should possess both wider effective absorption bandwidth and lower minimum reflection loss, depending on good impedance matching between the absorber and air and strong attenuation of EW. In this study, single-layer graphene/thermoplastic polyurethane (TPU) composite foams with different foam ratios and alternating multilayer graphene/TPU composite foams with different numbers of layers were prepared. Not only was the EW-absorbing mechanism of these composite foams examined, but also the relationship between the EW-absorbing properties and the number of layers were investigated. The single-layer sample S-5 with good impedance matching characteristics and S-3 with strong EW attenuation characteristics were selected as the constituent layers to design alternating multilayer graphene/TPU composite foams. Compared to the single-layer sample 4L-C (4L-C is defined as the monolayer sample S-4 with a thickness of 9 mm), the 4L alternating multilayer graphene/TPU composite foams could achieve more than 90% EW absorption in a wide frequency band of 8.5 GHz, and its minimum reflection loss was as low as −37.67 dB, which are very beneficial for its use as a lightweight, flexible electromagnetic wave absorbing material (EWAM) for broadband absorption. More importantly, the absorption of the obtained alternating multilayer composite foams could be simply modulated not only by the absorber thickness, but also by the number of layers to satisfy the applications in different frequency bands.
1. Introduction
Electromagnetic wave (EW) irradiation generated during the use of electronic equipment increasingly causes serious electromagnetic wave pollution and can seriously endanger the ecological environment and human physical and mental health.1–3 Therefore, the research and development of electromagnetic wave-absorbing materials (EWAMs) is of great significance and has aroused great interest in both academic and industrial fields. Polymeric composites, owing to their flexibilities for structure design and property modulation, light weight, and good processability, have been widely used in the design and implementation of EWAMs.4–6Dielectric absorbents, such as carbon nanotubes (CNTs),7–9 carbon fibers (CFs),10,11 and graphene and its derivatives,12–14 due to their light weight, high conductivity, high aspect ratio, good resistance against corrosion, and excellent mechanical properties15–18 have been added into polymer matrixes to achieve EW-absorbing properties. The most important features of these absorbents are their strong absorption capacity (reflection loss, RL) and broad effective absorption bandwidth (EB, RL < −10 dB, for 90% energy absorption).19 To obtain a lower reflection loss, numerous absorbents are generally required. However, employing a large amount of absorbents into polymer matrices will increase the fabrication cost and also is not conducive to the lightening of the EWAMs. Furthermore, the raised dielectric constant caused by the increased absorbent content narrows the effective bandwidth, limiting the use of these materials as EWAMs.20 Therefore, enhancing the EW-absorbing efficiency of EWAMs at the lower absorbent addition rate has been the focus of many researchers.
Methods to cut down the absorbent addition, such as by modification with magnetic fillers21–24 and the employment of multiple absorbents,25–27 have been studied extensively. For example, He et al.28 coupled flaky carbonyl iron (FCI) and reduced graphene oxide nanosheets in a homogenous composite to optimize characteristic impedance matching. Zhou et al.29 designed hierarchical metal–organic framework (MOF)-derived Co/C@V2O3 hollow spheres to endow the composites with large dielectric and magnetic losses. Zhou et al.30 explored porous heterogeneous Fe7Co3/ZnO nanosheets with tunable dielectric loss and magnetic loss for enhanced absorption over a wide frequency range (7.92 GHz). Nevertheless, the complicated preparation processes and high costs restrict the application of these techniques. The distribution of absorbents in the polymer matrix has a significant effect on reducing the content of absorbents and enhancing the EW-absorbing performance.31–34 Therefore, the relationship between the dispersion of absorbents and the EW-absorbing performance has been investigated extensively.35–37 Some researchers have found that preferentially distributed absorbents are good for the absorption of EW radiation.38–42 Gao et al. found that selectively dispersing graphene in porous graphene/TPU composites helps the formation of electrically conductive pathways in cell walls to obtain high dielectric loss. Moreover, the plenty of air contained in cells makes the characteristic impedance of the polymer-based composites close to air, reducing the reflection of electromagnetic waves on the surface of the EWAMs.43
Among various dielectric absorbents, graphene, which has many excellent properties such as light weight, admirable thermal conductivity and satisfactory corrosion resistance, has the potential to be employed in a polymer matrix to obtain EWAMs based on its excellent electrical conductivity and dielectric property, which can contribute to the dissipation of absorbed electromagnetic energy.43–45 However, graphene easily forms a conductive network structure in a polymer matrix due to its large specific surface area and aspect ratio, which prevents electromagnetic waves from propagating the interior of the polymeric composites. Therefore, most publicly reported articles are usually based on modified graphene46,47 or added magnetic absorbing agents, such as carbonyl iron and ferrite,48,49 to obtain matching impedance for realizing efficient EW-absorption. However, to their practical applications are limited due the large amount of additives, high cost, complex preparation process, and long production cycle. If graphene could be selectively distributed in a polymer matrix by means of foaming, the adverse factors during the preparation process could be cleverly eliminated and the fantastic EW-absorbing properties could be realized.43
On account of the merits, such as ease of processing and low cost, structure design has gradually become a widely accepted method to reduce the amount of the absorbent without damaging the EW-absorbing properties.50–53 As a special morphology, the laminar structure with absorbents preferentially distributed in each layer can be regarded as an effective way of reducing the absorbent content.40 Multilayered structure design has a great effect on adjusting impedance matching and enhancing the ability of EWAMs to attenuate electromagnetic waves,39,54,55 thus obtaining high-efficiency EW-absorbance and reducing the addition of absorbents. Particularly, the alternating multilayer structure, as a co-continuous morphology, can lead to EWAMs with excellent EW-absorbing properties.41 For example, Liu et al.56 found that the CoFe2O4/carbonyl iron composite with a double layer could broaden the effective absorption bandwidth to 9.4 GHz. Although researchers have found that the alternating multilayer structure shows great potential in the manufacture of EWAMs, to the best our knowledge, polymer-based composite foams with different foam ratios—obtained by foaming to selectively distribute graphene in a polymer matrix—that are alternately arranged in multilayers to meet the principle of impedance matching and strong attenuation capacity have rarely been studied and the relationship between the EW-absorbing properties and layer number is still ambiguous.
In this study, alternating multilayer EWAMs made by alternately arranging polymer-based composite foams with different foam ratios in the multilayer structure were designed and fabricated. The balance between impedance matching and a strong attenuation capacity was achieved by alternately arranging an impedance matching layer with a high foam ratio and a strong attenuation layer with a low foam ratio. Moreover, these well-defined cell structures containing plenty of air are beneficial for reducing the reflection of EWs on the surface of the EWAMs. Simultaneously, a low-density porous structure contributes to the use of alternating multilayer polymer-based composite foams as lightweight EWAMs. In addition, the multiple reflections of EWs between the layer interfaces facilitate the dissipation of EW energy inside the material. Thermoplastic polyurethane (TPU) was used as the polymer matrix owing to its satisfactory properties, such as flexibility, excellent compressible recovery, weathering, good processability, and low temperature resistance.57–60 Graphene was selected as the dielectric absorbent because of its excellent electrical conductivity, and it can easily form electrically conductive pathways in cell walls to obtain high dielectric loss.43 The effects of the layer number on the EW-absorbing property and the mechanism of the alternating multilayer structure to improve the EW-absorbing properties were investigated.
2. Experimental section
2.1 Materials
All the chemical reagents were commercially available and were used without further purification. A polyester-based TPU elastomer (Elastogran S85A) was obtained from BASF (Germany). Graphene (XTG-P-0762) was supplied by the Deyang Carbonene Co. Ltd (China). N,N′-Dimethyl formamide (DMF) and 1,4-dioxane were purchased from Kelong Reagent Co. Ltd (China).2.2 Specimen preparation
Solution mixing was used to prepare graphene/TPU composites. Here, 2 g of graphene was first added into a beaker with 300 mL of DMF and the mixture was then sonicated (1000 W) for 40 min. Then, 700 mL of the TPU/DMF solution was added to the mixture and was magnetically stirred for 5 h at 25 °C. The resultant solution was integrated with excess deionized water, and the precipitate obtained after filtration was dried at 80 °C for 48 h to wipe off the epibiotic solvent.Graphene/TPU composite foams were obtained by a thermally induced phase separation (TIPS) process.60–64 The as-prepared graphene/TPU composites were dissolved in 1,4-dioxane and stirred for 5 h at 60 °C. The dispersed solutions with different concentrations, shown in Table 1, were poured into an undefiled metal mold with a length and width of 200 mm, and then placed in a low temperature test chamber at a constant temperature of −60 °C for 1 h. The frozen mixture was then transferred into a vacuum freeze dryer (LGJ-10FD, Yaxing Instrument Science and Technology Development Co., Ltd.) for 36 h at 0 °C. The resultant foam was then dried at 80 °C for 24 h to remove the residual 1,4-dioxane. The single-layer graphene/TPU composite foams with different foam ratios (samples S-1, S-2, S-3, S-4, and S-5) were obtained by changing the concentration of the pouring solution. The higher the pouring solution concentration, the larger the volume fraction of the graphene/TPU composite, resulting in a larger constraint effect of the cell wall composed of these composites on the cell growth. Thus, the composite foam obtained by pouring a higher concentration exhibited a smaller cell size and smaller expansion ratio. The alternating multilayer graphene/TPU composite foams with layer numbers of 2, 4, 6, 8, and 10 (samples 2L, 4L, 6L, 8L, and 10L, respectively) were obtained by bonding a plurality of single-layer samples of different foam ratios with commercial glue. Because the foam ratio was regulated by the pouring solution concentration, the foam ratio of the monolayer sample S-4 should be the same as the average foam ratio of the 2L and 4L multilayer samples obtained by alternately arranging samples S-3 and S-5. Therefore, the samples constituting the single-layer contrast sample S-4 with the same average foaming rate as the multilayer samples 2L and 4L were defined as 2L-C and 4L-C with the thicknesses of 7 mm and 9 mm, respectively. The pouring concentration, density, graphene content, electrical conductivity, foam ratio, and porosity of the single-layer graphene/TPU composite foams are presented in Table 1.
| Sample | S-1 | S-2 | S-3 | S-4 | S-5 |
|---|---|---|---|---|---|
| Pouring concentration (g ml−1) | 12 | 10 | 8 | 6 | 4 |
| Density (g cm−3) | 0.24 | 0.20 | 0.16 | 0.14 | 0.09 |
| Graphene content (vol%) | 2.3 | 2.3 | 2.3 | 2.3 | 2.3 |
| Conductivity (10−9 S cm−1) | 602.8 | 268 | 35.8 | 0.56 | 0.17 |
| Foam ratio | 3.3 | 4.0 | 4.9 | 5.6 | 8.6 |
| Porosity | 70% | 75% | 80% | 82% | 88% |
2.3 Characterization and testing
The morphology of the samples was determined using a scanning electron microscope (SEM, JEOL JSM-5900LV) under an accelerating voltage of 20 kV. The samples were cryo-fractured in liquid nitrogen, and the fractured surfaces were coated with a layer of gold in a vacuum chamber prior to visualization by SEM.The expansion ratio ϕ of the foams was calculated using the eqn (1).65
 | (1) |
The porosity P of single-layer foams was calculated using the eqn (2).66
 | (2) |
The electrical resistivities of S-1, S-2, S-3, S-4, and S-5 were obtained using a programmable insulation resistance tester (YD9820A). The sizes of all the samples were 10 mm in length (l), 10 mm in width (w), and 2 mm in thickness (t). A constant voltage of 1 V was applied to the samples, unless otherwise specified. The electrical conductivity, σ, was calculated by the following equation:
 | (3) |
The electromagnetic parameters, complex relative permittivity (εr = ε′ − jε′′) and permeability (μr = μ′ − jμ′′) of the five single-layer graphene/TPU composite foams with different foam ratios, which were processed into a concentric annular shape with an outer diameter of 7 mm, an inner diameter of 3.04 mm, and a fixed thickness of 3 mm, as measured by a vector network analyzer using the coaxial-line method (N5230A, Agilent Technologies Co., LTD) in the range of 2–18 GHz. The electromagnetic wave absorbing properties of all the multilayer samples were calculated according to the transmission line theory described in Section 3.1.
3. Results and discussion
3.1 Theory of EW absorption
Fig. 1 reveals a multilayer model containing n layers of different materials, while a metal plate was used as its reflective backing. The parameter di is the thickness of the ith layer, ηr is the complex intrinsic impedance of the ith layer, γi is the propagation constants of the ith layer (i = 1, 2, 3…, n), and ε0 and μ0 are the permittivity and permeability of the free space, respectively.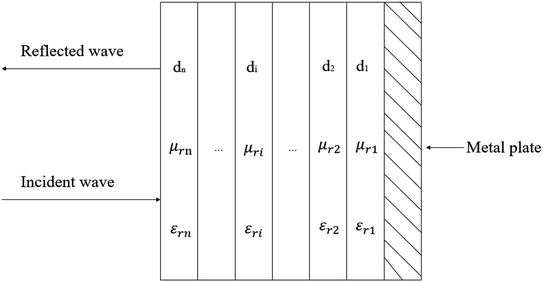 | ||
| Fig. 1 Schematic of a multilayer model with a normally incident wave (di, εri, and μri are the thickness, complex permittivity, and permeability of the ith layer, respectively.). | ||
According to the transmission-line theory,67,68 the wave impedance, Zi, of the ith layer can be calculated using the equation:
 | (4) |
 | (5) |
 | (6) |
Z1 = η1![[thin space (1/6-em)]](https://www.rsc.org/images/entities/char_2009.gif) tanh(γ1d1) tanh(γ1d1)
| (7) |
 | (8) |
In which the input impedance of the EW absorbing layer, Zri, is given by:
 | (9) |
As a result, the EW-absorbing properties of the alternating multilayer composite foams containing n layers of materials with different foam ratios can be calculated using the eqn (4)–(9).
3.2 EW-absorbing properties of single-layer graphene/TPU composite foams
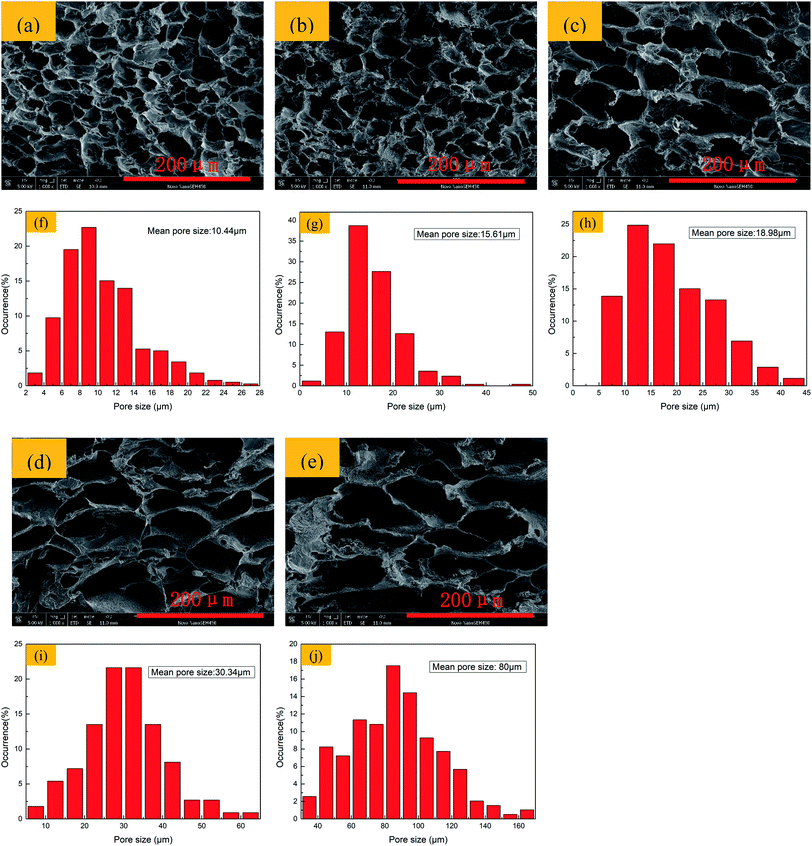
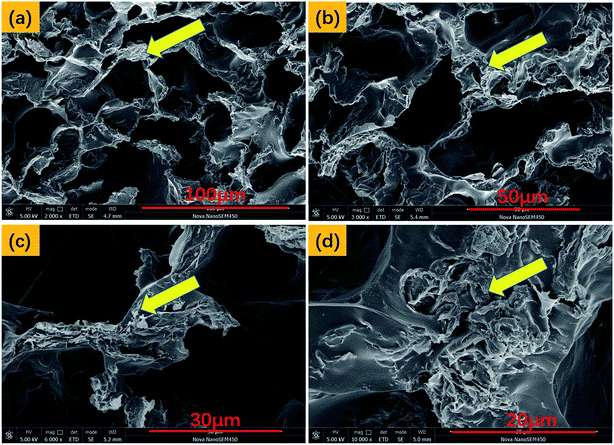
Single-layer graphene/TPU composite foams with the same graphene content but different foam ratios were prepared via the TIPS method. The well-defined closed cells, which can be observed in Fig. 2a–e, gradually changed from spherical to a polygonal shape with the increase in foam ratio. The physical barrier action of graphene on the cell growth causes a deformation of the cell wall.69 In addition, Fig. 2f–j indicate that the mean pore sizes increased with the increment in foam ratio.Fig. 3 shows SEM images of a brittle fracture cross-section of sample S-3 etched by DMF. As illustrated in the figure, after the polymeric matrix TPU was etched by DMF, the selective distribution of graphene sheets along the cell walls can be seen clearly. Compared with the graphene/TPU composite foams without etching in Fig. 2c, it can be seen that the graphene skeleton was encapsulated into the TPU matrix. Owing to this admirable selective distribution of graphene sheets and integrated encapsulation structure, a good three-dimensional (3D) conductive network structure and favorable mechanical properties were simultaneously achieved by the graphene/TPU composite foams.
Fig. 4a–c show the frequency dependence of ε′ and ε′′ and tan![[thin space (1/6-em)]](https://www.rsc.org/images/entities/char_2009.gif) δ of the single-layer samples S-1, S-2, S-3, S-4, and S-5. In Fig. 4a, the ε′ values of all the single-layer samples slightly decreased in the range of 2–18 GHz. Furthermore, the ε′ value of S-3 outclassed the other samples, indicating that a good conductive network was formed by the interaction with the bound charges, which is good for the dissipation of electromagnetic energy. As demonstrated in Fig. 4b, we can observe that the ε′′ values of S-1, S-2, and S-5 are almost constant, while those of S-3 and S-4 are dependent on the frequency. The imaginary part of the permittivity (ε′′) of S-3 was the highest among all single-layer samples, attributed to the conduction current arising from free electrons in the excellent conductive path according to the free electron theory.70 On the basis of the data in Fig. 4c, the tan
δ of the single-layer samples S-1, S-2, S-3, S-4, and S-5. In Fig. 4a, the ε′ values of all the single-layer samples slightly decreased in the range of 2–18 GHz. Furthermore, the ε′ value of S-3 outclassed the other samples, indicating that a good conductive network was formed by the interaction with the bound charges, which is good for the dissipation of electromagnetic energy. As demonstrated in Fig. 4b, we can observe that the ε′′ values of S-1, S-2, and S-5 are almost constant, while those of S-3 and S-4 are dependent on the frequency. The imaginary part of the permittivity (ε′′) of S-3 was the highest among all single-layer samples, attributed to the conduction current arising from free electrons in the excellent conductive path according to the free electron theory.70 On the basis of the data in Fig. 4c, the tan![[thin space (1/6-em)]](https://www.rsc.org/images/entities/char_2009.gif) δ values of S-1, S-2, and S-5 showed a little fluctuation, while those of S-3 and S-4 were significantly higher than those of S-1, S-2, and S-5, suggesting that S-3 and S-4 have a strong dissipation ability for electromagnetic energy.
δ values of S-1, S-2, and S-5 showed a little fluctuation, while those of S-3 and S-4 were significantly higher than those of S-1, S-2, and S-5, suggesting that S-3 and S-4 have a strong dissipation ability for electromagnetic energy.
It is known that the tan![[thin space (1/6-em)]](https://www.rsc.org/images/entities/char_2009.gif) δ is the quotient of the real and imaginary parts of relative permittivity, which is demonstrated by the following equation:
δ is the quotient of the real and imaginary parts of relative permittivity, which is demonstrated by the following equation:
 | (10) |
Also, ε′ and ε′′ are given by the following equations:
 | (11) |
 | (12) |
According to eqn (10)–(12), a higher tan![[thin space (1/6-em)]](https://www.rsc.org/images/entities/char_2009.gif) δ can be obtained by increasing the conductivity. When the foam ratio was increased from 3.3 to 8.6, as shown in Fig. 5, the conductivity decreased significantly. The high conductivity was produced by the three-dimensional conductive network structure, which was induced by graphene's selective dispersion and alignment in the pore struts,72,73 as can be observed in Fig. 5b. Sample S-5 exhibited a very low conductivity of 1.7 × 10⁻¹⁰ S cm−1, indicating that the incident electromagnetic wave can enter into sample S-5 on account of the good impedance matching with air. Samples S-1, S-2, and S-3 with higher conductivity had larger dielectric loss constants, tan
δ can be obtained by increasing the conductivity. When the foam ratio was increased from 3.3 to 8.6, as shown in Fig. 5, the conductivity decreased significantly. The high conductivity was produced by the three-dimensional conductive network structure, which was induced by graphene's selective dispersion and alignment in the pore struts,72,73 as can be observed in Fig. 5b. Sample S-5 exhibited a very low conductivity of 1.7 × 10⁻¹⁰ S cm−1, indicating that the incident electromagnetic wave can enter into sample S-5 on account of the good impedance matching with air. Samples S-1, S-2, and S-3 with higher conductivity had larger dielectric loss constants, tan![[thin space (1/6-em)]](https://www.rsc.org/images/entities/char_2009.gif) δ, which means they have a higher ability to dissipate electromagnetic energy.
δ, which means they have a higher ability to dissipate electromagnetic energy.
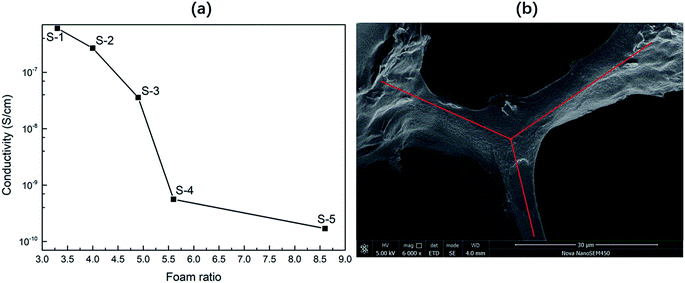 | ||
| Fig. 5 (a) The electrical conductivity of single-layer graphene/TPU composite foams with different foam ratios. (b) The three-dimensional conductive network structure of sample S-3. | ||
The characteristic impedance ηr can be calculated using the following equation:74,75
 | (13) |
The attenuation constant α is introduced to describe the integral attenuation ability based on the following equation:76,77
 | (14) |
Therefore, the values of ηr and α for the single-layer foamed graphene/TPU composites with different foam ratios were calculated by eqn (13) and (14) and the results are demonstrated in Fig. 6a and b. As shown in the figures, the increment in the foam ratio leads to an increase in the characteristic impedance ηr, except for S-3, which could be ascribed to the large amount of air filled inside the cells and as increasing the foam ratio leads to an increment of the cell size, shown in Fig. 2, so more air is filled in the foamed graphene/TPU composites with higher foam ratios. Among these, S-5 possessed a characteristic impedance closer to air, indicating that more electromagnetic waves will penetrate the surface of the sample and enter the interior of the material, which will facilitate the use of S-5 as an impedance matching layer for multilayer EWAMs. As for the case of S-3, this may be attributed to the formation of a good three-dimensional conductive network structure after foaming, which will be detrimental to impedance matching. Fortunately, based on the formation of this good three-dimensional conductive network, the attenuation constant α of S-3 was much larger than that of the other four single-layer samples, as illustrated in Fig. 6b, giving rise to the incident electromagnetic wave energy being greatly dissipated, which is significant for using S-3 as a strong electromagnetic wave attenuation layer in multilayer EWAMs.
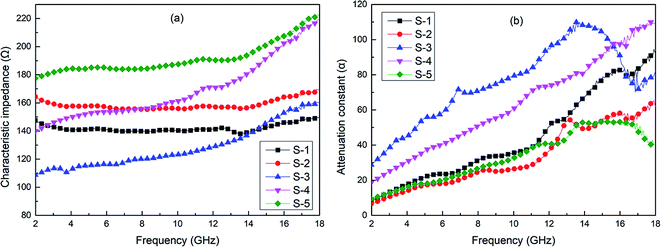 | ||
| Fig. 6 Characteristic impedance (a) and attenuation constant (b) of single-layer graphene/TPU composite foams with different foam ratios in the frequency range of 2–18 GHz. | ||
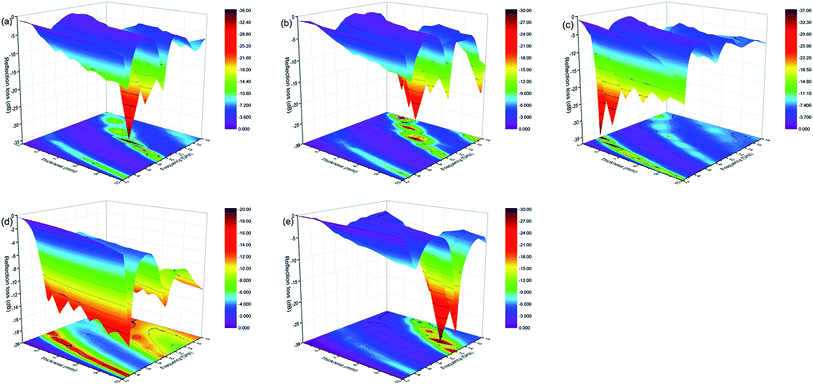
According to the transmission-line theory, the RL of the single-layer samples S-1, S-2, S-3, S-4 and S-5 could be calculated using the eqn (8) and (9). Fig. 7a–e show the frequency dependence of the reflection loss (RL) of the single-layer samples S-1, S-2, S-3, S-4, and S-5 when the thickness increases from 5 to 10 mm. It turned out that the minimum reflection loss RLmin of the samples S-1, S-2, S-3, S-4, and S-5 were −35.38, −25.05, −36.55, −15.70, and −29.97 dB at thicknesses of 8, 8, 5, 10, and 9 mm, respectively. However, the EB values of the single-layer samples as described above were only 1.3, 2.2, 3.6, 2.1, and 2.7 GHz at the corresponding thicknesses, respectively. These unsatisfactory EB values mean it is still difficult to meet the requirements for use as broadband EWAMs.
In summary, sample S-5 with a relatively higher characteristic impedance proved to have good impedance matching with air, while sample S-3 with a relatively higher attenuation constant exhibited the best EW-absorbing properties. Therefore, to achieve satisfactory EW-absorbing properties, samples S-3 and S-5 were selected as component layers to prepare alternating multilayer EWAMs.
3.3 EW-absorbing properties of alternating multilayer graphene/TPU composite foams
In this study, we designed an alternating multilayer model composed of S-3 and S-5 layers, the schematic of which is shown in Fig. 1. The layer number for the research models 2, 4, 6, 8, and 10 were denoted as 2L, 4L, 6L, 8L, and 10L, respectively. The cross-sectional morphologies of the 2L, 4L, and 6L alternating multilayer graphene/TPU composite foams are shown in Fig. 8. As shown in Fig. 8a–c, the layer interface can be easily observed. Also, the difference in cell size between adjacent layers was relatively large, and the cells in the S-5 layer were much larger than in the S-3 layer with the increase in foam ratio. The thickness of each layer of the alternating multilayer sample was also basically the same, avoiding the problem that the input impedance was not uniformly changed by the uneven thickness of the layer.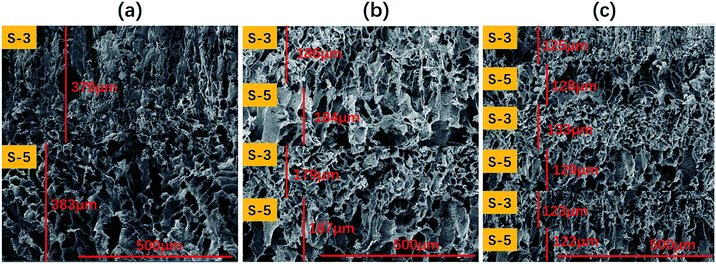 | ||
| Fig. 8 Cross-sectional morphologies of 2L, 4L, and 6L alternating multilayer graphene/TPU composite foams: (a): 2L; (b): 4L; (c): 6L. | ||
The RL of the models with different layer numbers was calculated by eqn (4)–(8). Fig. 9 shows the relationship of RL and the frequency of the alternating multilayer models. It can be seen from the figure that the 2L, 4L, 6L, 8L, and 10L samples achieved the minimum reflection loss RLmin at thicknesses of 7, 9, 9, 10, and 10 mm, respectively. We calculated the RLmin and EB values for all the multilayer samples at the optimal thickness, as shown in Table 2. As can be seen from Table 2, sample 4L with the thickness of 9 mm possessed the lowest RLmin of −37.67 dB, and its EB value was as wide as 8.5 GHz and it produced a three-peak absorption, with the quarter-wavelength cancellation model applied to decipher its mechanism. In the quarter-wavelength cancellation model, the relationship between the absorber thickness (tm) and the matching frequency (fm) can be described by the following equation:78,79
 | (15) |
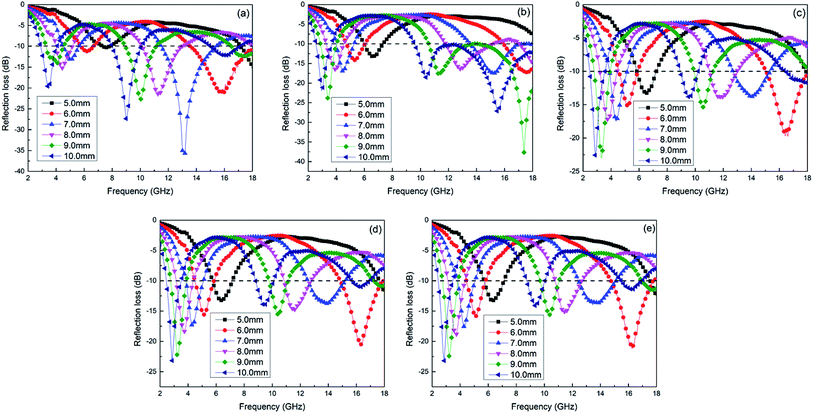 | ||
| Fig. 9 Calculated reflection loss plots of alternating multilayer models when the thickness was increased from 5 to 10 mm: (a): 2L; (b): 4L; (c): 6L; (d): 8L; (e): 10L. | ||
| Sample | 2L (7 mm) | 4L (9 mm) | 6L (9 mm) | 8L (10 mm) | 10L (10 mm) |
|---|---|---|---|---|---|
| Average foam ratio | 5.6 | 5.6 | 5.6 | 5.6 | 5.6 |
| EB (GHz) | 4.9 | 8.5 | 2.4 | 3.3 | 3.5 |
| RLmin (dB) | −35.66 | −37.67 | −23.00 | −23.17 | −23.18 |
Based on eqn (15), when the EW reflected from the layer interface and the absorber–metal reflective backing interface are out of phase by 180°, EW interference elimination occurs.80,81 Also, the quarter-wavelength cancellation model can be applied to illustrate why RLmin shifted toward the lower frequency band with the increment in absorber thickness. On the basis of the above theory, the three-peak absorption, produced by sample 4L, may be due to the interference cancellation, resulting from matching the thickness and frequency.79,82–84 However, when the number of layers reached 6 or more, the RL–frequency curves under the different layer numbers were almost the same, which means that at higher layers, the increasing number of layers is almost negligible for the improvement in the EW-absorbing properties. The reason for this phenomenon may be due to the effect of ambiguity of the interface becoming increasingly obvious with the increment in the layer number.85 As for sample 2L, it exhibited good EW-absorbing properties at lower layers and lower thicknesses, compared to the 6L, 8L, and 10L samples, with a minimum reflection loss of −35.66 dB at 7 mm thickness and an EB value of 4.9 GHz. Therefore, samples 2L and 4L with better EW-absorbing properties were selected for further study.
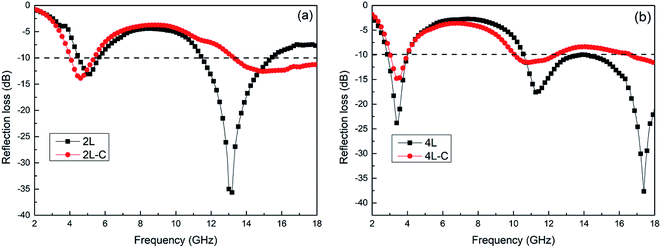
The 2L and 4L alternating multilayer graphene/TPU composite foams were compared with the corresponding single-layer samples (2L-C and 4L-C) with the same average foam ratio at the thicknesses of 7 and 9 mm, as shown in Fig. 10, respectively. As can be seen from Fig. 10 and Table 3, all the RLmin values of the alternating multilayer samples are much lower than those of the corresponding single-layer samples, so S-3 and S-5 were selected as the strong EW attenuation layer and the impedance matching layer, respectively, to design an alternate multilayer structure, which is very beneficial for enhancing the EW-absorbing capability. Moreover, the EB value of the alternating multilayer sample 4L (8.5 GHz) was also much wider than that of the single-layer sample 4L-C (4.6 GHz), which was due to the introduction of the impedance matching layer S-5, reducing the reflection of the incident EW on the surface of the absorber, and the increased percentage of the electromagnetic wave propagated into the absorber inside by the strong attenuation layer S-3. Simultaneously, the interference cancellation caused by multiple reflections at the layer interface also fortified the electromagnetic energy dissipation.
| Sample | 2L (7 mm) | 2L-C (7 mm) | 4L (9 mm) | 4L-C (9 mm) |
|---|---|---|---|---|
| Average foam ratio | 5.6 | 5.6 | 5.6 | 5.6 |
| EB (GHz) | 4.9 | 5.9 | 8.5 | 4.6 |
| RLmin (dB) | −35.66 | −13.87 | −37.67 | −15.07 |
Fig. 11 shows the EW-absorbing mechanism of the alternating multilayer EWAMs. As shown in Fig. 11a, the mechanism of the alternating multilayer structure to effectively enhance EW-absorbing performance lies in the following three aspects: first, the introduction of the impedance matching layer (S-5) reduces the reflection of electromagnetic waves on the surface of the EWAMs, aggrandizing the percentage of incident electromagnetic waves entering the interior of the absorber, which is beneficial for increasing the dissipation of electromagnetic energy inside the absorber. Second, the multilayer structure increases the multiple reflection of electromagnetic waves at the layer interface, which facilitates the interference cancellation of electromagnetic waves. Moreover, this multiple reflection prolongs the transmission path of the electromagnetic waves inside the absorber, increasing its decay time. Third, the abrupt change in the cell size alters the transmission path of the electromagnetic wave inside the EWAMs: when the EW propagates into the interior of the EWAMs, it actually passes through not only the cell wall composed of the graphene/TPU composites but also the cells whose size is changed from large to small in the alternating multilayer structure. The skin depth of electromagnetic waves in the graphene/TPU mixture is small, but it is extremely high inside the cells.43 Due to the presence of cells whose size abruptly changes, the EW actually only penetrates the thin cell wall, so the EW can still propagate into the multilayer EWAMs well and be attenuated.
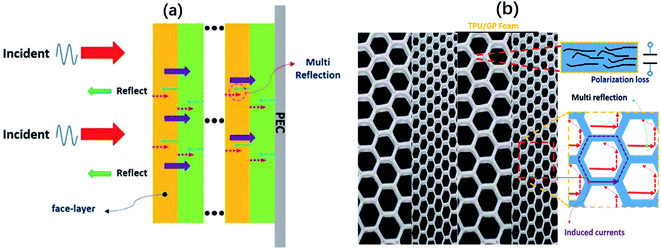 | ||
| Fig. 11 (a) EW-absorbing mechanism diagram of alternating multilayer graphene/TPU composite foams; (b) microscopic mechanism of the three-dimensional conductive path in EW energy dissipation. | ||
In Fig. 11b, the microscopic mechanism of EW energy dissipation is discussed: first, the cell structure existing in the system augments the interface inside the material, so that EWs can generate multiple reflections inside these cells, which is then gradually dissipated; second, the closed loop formed by the graphene distributed along the cell wall generates an induced current to further dissipate the EW energy under the alternating electric field of the EW; third, the parallel distributed conductive graphene and the insulated TPU substrate between them form a microcapacitor structure called a “plate-dielectric-plate.” The hysteresis effect of these miniature capacitors when interacting with EWs also consumes part of the EWs.
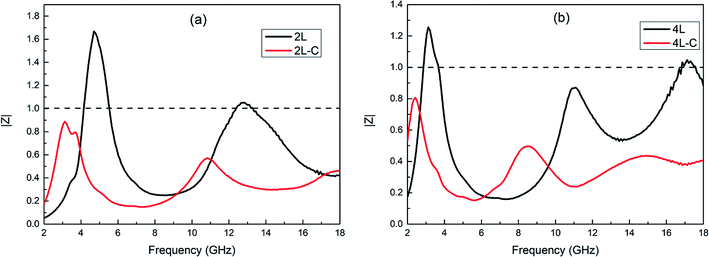
According to the transmission-line theory, the characteristic impedances (Zri) of alternating multilayer EWAMs were calculated using the eqn (5)–(7), and the characteristic impedance (Zri) of the single-layer EWAMs can be given by eqn (9). The normalized impedance, Z = Zri/Z0, was used to estimate the impedance matching characteristic. If the absorber possesses a better impedance matching characteristic, the modulus of Z should be infinitely close to 1.86 Fig. 12 shows the |Z| versus frequency curves for the 2L and 4L alternating multilayer graphene/TPU composite foams and the corresponding single-layer samples 2L-C and 4L-C at the thicknesses of 7 and 9 mm, respectively. It is pretty clear that the |Z| values for 2L, 2L-C, 4L, and 4L-C are in the ranges of 0.06–1.67, 0.15–0.89, 0.16–1.26, and 0.15–0.81, respectively. It can clearly seen that the |Z| values of the alternating multilayer samples 2L and 4L are significantly closer to 1 than the corresponding single-layer samples 2L-C and 4L-C, especially at a higher frequency band. Good impedance matching, as shown in Fig. 12, between the multilayer samples and air explains why lower minimum reflection losses and wider effective absorption bandwidth occur.
4. Conclusion
In this study, single-layer graphene/TPU composite foams with different foam ratios and alternating multilayer graphene/TPU composite foams with different numbers of layers were prepared. Not only were the EW-absorbing mechanisms of these composite foams examined, but the relationship between the EW-absorbing properties and the number of layers were also investigated. The obtained results are as follows:(1) Among all the single-layer graphene/TPU composite foams with different foam ratios, the characteristic impedance of sample S-5 with a foam ratio of 8.6 was closest to air, indicating that S-5 was best to use as an impedance matching layer. Sample S-3 with a higher dielectric loss and attenuation constant was optimal for achieving the best EW-absorbing performance, meaning sample S-3 can serve as a candidate for a strong EW attenuation layer.
(2) The 2L and 4L alternating multilayer samples obtained by alternately arranging S-3 and S-5 to realize excellent impedance matching characteristics and strong attenuation capacity exhibited excellent EW-absorbing properties at the thicknesses of 7 and 9 mm, respectively. Compared to the single-layer samples 2L-C and 4L-C, the alternating multilayer samples exhibited lower RLmin and wider EB values.
(3) The absorption of the obtained alternating multilayer composite foams could be simply modulated not only by the absorber thickness, but also by the number of layers to satisfy applications in different frequency bands. More importantly, the 4L alternating multilayer graphene/TPU composite foams could achieve more than 90% EW absorption in a wide frequency band of 8.5 GHz and had a minimum reflection loss as low as −37.67 dB, which is beneficial for its use as a lightweight, flexible EWAM for broadband absorption.
Conflicts of interest
There are no conflicts to declare.Acknowledgements
The authors are grateful to the National Natural Science Foundation of China (51473103 and 51873112) for financial support for this work.References
- P. Liu, Y. Huang, J. Yan, Y. Yang and Y. Zhao, ACS Appl. Mater. Interfaces, 2016, 8, 5536–5546 CrossRef CAS PubMed.
- H.-B. Zhao, Z.-B. Fu, H.-B. Chen, M.-L. Zhong and C.-Y. Wang, ACS Appl. Mater. Interfaces, 2016, 8, 1468–1477 CrossRef CAS PubMed.
- L. Yan, C. Hong, B. Sun, G. Zhao, Y. Cheng, S. Dong, D. Zhang and X. Zhang, ACS Appl. Mater. Interfaces, 2017, 9, 6320–6331 CrossRef CAS PubMed.
- A. S. Esfahani, A. Katbab, P. Dehkhoda, H. Karami, M. Barikani, S. Sadeghi and A. Ghorbani, Compos. Sci. Technol., 2012, 72, 382–389 CrossRef.
- F. Qin and C. Brosseau, J. Appl. Phys., 2012, 111, 4 Search PubMed.
- X. Zhang, X. Zhang, M. Yang, S. Yang, H. Wu, S. Guo and Y. Wang, Compos. Sci. Technol., 2016, 136, 104–110 CrossRef CAS.
- J. Qiu and T. T. Qiu, Carbon, 2015, 81, 20–28 CrossRef CAS.
- X. Gao, X. Wu and J. Qiu, Adv. Electron. Mater., 2018, 4, 1700565 CrossRef.
- Z. Jiao and J. Qiu, J. Mater. Sci., 2018, 53, 3640–3646 CrossRef CAS.
- S. K. Singh, M. J. Akhtar and K. K. Kar, ACS Appl. Mater. Interfaces, 2018, 10, 24816–24828 CrossRef CAS PubMed.
- N. Yang, J. Zeng, J. Xue, L. Zeng and Y. Zhao, J. Alloys Compd., 2018, 735, 2212–2218 CrossRef CAS.
- B. Quan, X. Liang, G. Ji, J. Lv, S. Dai, G. Xu and Y. Du, Carbon, 2018, 129, 310–320 CrossRef CAS.
- Y. Shi, X. Wu and J. Qiu, Ann. Phys., 2018, 530, 1800116 CrossRef.
- Y. Shi, X. Gao and J. Qiu, Ceram. Int., 2019, 45, 3126–3132 CrossRef CAS.
- Y.-H. Chen, Z.-H. Huang, M.-M. Lu, W.-Q. Cao, J. Yuan, D.-Q. Zhang and M.-S. Cao, J. Mater. Chem. A, 2015, 3, 12621–12625 RSC.
- X.-X. Wang, T. Ma, J.-C. Shu and M.-S. Cao, Chem. Eng. J., 2018, 332, 321–330 CrossRef CAS.
- J. Wang, Y. Huyan, Z. Yang, A. Zhang, Q. Zhang and B. Zhang, Carbon, 2019, 152, 255–266 CrossRef CAS.
- H. Xu, X. Yin, M. Zhu, M. Li, H. Zhang, H. Wei, L. Zhang and L. Cheng, Carbon, 2019, 142, 346–353 CrossRef CAS.
- H. Xu, X. Yin, M. Zhu, M. Han, Z. Hou, X. Li, L. Zhang and L. Cheng, ACS Appl. Mater. Interfaces, 2017, 9, 6332–6341 CrossRef CAS PubMed.
- Y. Gao, X. Gao, J. Li and S. Guo, Compos. Sci. Technol., 2018, 158, 175–185 CrossRef CAS.
- S. Jia, F. Luo, Y. Qing, W. Zhou and D. Zhu, Phys. B, 2010, 405, 3611–3615 CrossRef CAS.
- Q. Liu, B. Cao, C. Feng, W. Zhang, S. Zhu and D. Zhang, Compos. Sci. Technol., 2012, 72, 1632–1636 CrossRef CAS.
- X. Qi, J. Xu, Q. Hu, W. Zhong and Y. Du, Mater. Sci. Eng., B, 2015, 198, 108–112 CrossRef CAS.
- Y. Zhou, W. Zhou, R. Li, Y. Qing, F. Luo and D. Zhu, J. Magn. Magn. Mater., 2016, 401, 251–258 CrossRef CAS.
- L. Liu, Y. Duan, L. Ma, S. Liu and Z. Yu, Appl. Surf. Sci., 2010, 257, 842–846 CrossRef CAS.
- Y. Qing, W. Zhou, F. Luo and D. Zhu, Carbon, 2010, 48, 4074–4080 CrossRef CAS.
- X. Hong, Y. Xie, X. Wang, M. Li, Z. Le, Y. Gao, Y. Huang, Y. Qin and Y. Ling, Compos. Sci. Technol., 2015, 117, 215–224 CrossRef CAS.
- L. He, Y. Zhao, L. Xing, P. Liu, Z. Wang, Y. Zhang, Y. Wang and Y. Du, RSC Adv., 2018, 8, 2971–2977 RSC.
- C. Zhou, C. Wu, D. Liu and M. Yan, Chem.–Eur. J., 2019, 25, 2234–2241 CrossRef CAS PubMed.
- C. Zhou, C. Wu and M. Yan, Chem. Eng. J., 2019, 370, 988–996 CrossRef CAS.
- X.-L. Xie, Y.-W. Mai and X.-P. Zhou, Mater. Sci. Eng., R, 2005, 49, 89–112 CrossRef.
- N. G. Sahoo, S. Rana, J. W. Cho, L. Li and S. H. Chan, Prog. Polym. Sci., 2010, 35, 837–867 CrossRef CAS.
- L.-C. Tang, Y.-J. Wan, D. Yan, Y.-B. Pei, L. Zhao, Y.-B. Li, L.-B. Wu, J.-X. Jiang and G.-Q. Lai, Carbon, 2013, 60, 16–27 CrossRef CAS.
- M. Yoonessi, J. R. Gaier, J. A. Peck and M. A. Meador, Carbon, 2015, 84, 375–382 CrossRef CAS.
- Z. Fan, G. Luo, Z. Zhang, L. Zhou and F. Wei, Mater. Sci. Eng., B, 2006, 132, 85–89 CrossRef CAS.
- F. Nanni, P. Travaglia and M. Valentini, Compos. Sci. Technol., 2009, 69, 485–490 CrossRef CAS.
- B. D. Che, L.-T. T. Nguyen, B. Q. Nguyen, H. T. Nguyen, T. Van Le and N. H. Nguyen, Macromol. Res., 2014, 22, 1221–1228 CrossRef CAS.
- I. Huynen, L. Bednarz, J. Thomassin, C. Pagnoulle, R. Jerome and C. Detrembleur, 2008 38th European Microwave Conference, 2008 Search PubMed.
- D. Micheli, R. Pastore, C. Apollo, M. Marchetti, G. Gradoni, V. M. Primiani and F. Moglie, IEEE Trans. Microwave Theory Tech., 2011, 59, 2633–2646 CAS.
- D. Micheli, R. Pastore, G. Gradoni, V. M. Primiani, F. Moglie and M. Marchetti, Acta Astronaut., 2013, 88, 61–73 CrossRef CAS.
- Y. Danlée, C. Bailly and I. Huynen, Compos. Sci. Technol., 2014, 100, 182–188 CrossRef.
- D. Micheli, A. Vricella, R. Pastore and M. Marchetti, Carbon, 2014, 77, 756–774 CrossRef CAS.
- Y. Gao, C. Wang, J. Li and S. Guo, Composites, Part A, 2019, 117, 65–75 CrossRef CAS.
- J. Gu, N. Li, L. Tian, Z. Lv and Q. Zhang, RSC Adv., 2015, 5, 36334–36339 RSC.
- Y. Guo, G. Xu, X. Yang, K. Ruan, T. Ma, Q. Zhang, J. Gu, Y. Wu, H. Liu and Z. Guo, J. Mater. Chem. C, 2018, 6, 3004–3015 RSC.
- B. Zhang, J. Wang, T. Wang, X. Su, S. Yang, W. Chen, J. Wang, J. Sun and J. Peng, Compos. Sci. Technol., 2019, 176, 54–63 CrossRef CAS.
- X. Zhang, X. Su, B. Zhang and J. Wang, Ceram. Int., 2019, 45, 12895–12902 CrossRef CAS.
- M. Dai, Y. Zhai, L. Wu and Y. Zhang, Carbon, 2019, 152, 661–670 CrossRef CAS.
- M. Wu, E. Yang, X. Qi, R. Xie, Z. Bai, S. Qin, W. Zhong and Y. Du, J. Alloys Compd., 2019, 785, 1126–1136 CrossRef CAS.
- C. Wei, X. Shen, F. Song, Y. Zhu and Y. Wang, Mater. Des., 2012, 35, 363–368 CrossRef CAS.
- D. Estevez, F. X. Qin, L. Quan, Y. Luo, X. F. Zheng, H. Wang and H. X. Peng, Carbon, 2018, 132, 486–494 CrossRef CAS.
- Y. Huang, W.-L. Song, C. Wang, Y. Xu, W. Wei, M. Chen, L. Tang and D. Fang, Compos. Sci. Technol., 2018, 162, 206–214 CrossRef CAS.
- J. Zhao, S. Wei, C. Wang, K. Chen, B. Zhu, T. Jiang and Y. Feng, Opt. Express, 2018, 26, 8522–8531 CrossRef CAS PubMed.
- M. Chen, Y. Zhu, Y. Pan, H. Kou, H. Xu and J. Guo, Mater. Des., 2011, 32, 3013–3016 CrossRef CAS.
- J. Choi and H.-T. Jung, Compos. Struct., 2015, 122, 166–171 CrossRef.
- Y. Liu, X. Liu and X. Wang, J. Alloys Compd., 2014, 584, 249–253 CrossRef CAS.
- P. Alves, J. F. J. Coelho, J. Haack, A. Rota, A. Bruinink and M. H. Gil, Eur. Polym. J., 2009, 45, 1412–1419 CrossRef CAS.
- A. Boubakri, N. Guermazi, K. Elleuch and H. F. Ayedi, Mater. Sci. Eng., A, 2010, 527, 1649–1654 CrossRef.
- Y. A. El-Shekeil, S. M. Sapuan, K. Abdan and E. S. Zainudin, Mater. Des., 2012, 40, 299–303 CrossRef CAS.
- H. Liu, M. Dong, W. Huang, J. Gao, K. Dai, J. Guo, G. Zheng, C. Liu, C. Shen and Z. Guo, J. Mater. Chem. C, 2017, 5, 73–83 RSC.
- C. Wang, Y. Ding, Y. Yuan, X. He, S. Wu, S. Hu, M. Zou, W. Zhao, L. Yang, A. Cao and Y. Li, J. Mater. Chem. C, 2015, 3, 11893–11901 RSC.
- A. T. E. Vilian, S. An, S. R. Choe, C. H. Kwak, Y. S. Huh, J. Lee and Y.-K. Han, Biosens. Bioelectron., 2016, 86, 122–128 CrossRef CAS PubMed.
- X. Wei, X. Cao, Y. Wang, G. Zheng, K. Dai, C. Liu and C. Shen, Compos. Sci. Technol., 2017, 149, 166–177 CrossRef CAS.
- Z. Zeng, H. Jin, M. Chen, W. Li, L. Zhou, X. Xue and Z. Zhang, Small, 2017, 13, 1701388 CrossRef PubMed.
- E. Rezvanpanah, S. R. G. Anbaran and E. Di Maio, Carbon, 2017, 125, 32–38 CrossRef CAS.
- H. Sehaqui, M. Salajková, Q. Zhou and L. A. Berglund, Soft Matter, 2010, 6, 1824–1832 RSC.
- F. Qin and C. Brosseau, J. Appl. Phys., 2012, 111, 061301 CrossRef.
- G. Shen, M. Xu and Z. Xu, Mater. Chem. Phys., 2007, 105, 268–272 CrossRef CAS.
- J. Ling, W. Zhai, W. Feng, B. Shen, J. Zhang and W. g. Zheng, ACS Appl. Mater. Interfaces, 2013, 5, 2677–2684 CrossRef CAS PubMed.
- P. Xu, X. Han, C. Wang, D. Zhou, Z. Lv, A. Wen, X. Wang and B. Zhang, J. Phys. Chem. B, 2008, 112, 10443–10448 CrossRef CAS PubMed.
- B. Kuang, W. Song, M. Ning, J. Li, Z. Zhao, D. Guo, M. Cao and H. Jin, Carbon, 2018, 127, 209–217 CrossRef CAS.
- A. Ameli, P. Jung and C. Park, Carbon, 2013, 60, 379–391 CrossRef CAS.
- A. Ameli, M. Nofar, C. Park, P. Pötschke and G. Rizvi, Carbon, 2014, 71, 206–217 CrossRef CAS.
- X. Sun, J. He, G. Li, J. Tang, T. Wang, Y. Guo and H. Xue, J. Mater. Chem. C, 2013, 1, 765–777 RSC.
- P. Liu, Z. Yao, J. Zhou, Z. Yang and L. B. Kong, J. Mater. Chem. C, 2016, 4, 9738–9749 RSC.
- B. Zhao, G. Shao, B. Fan, W. Zhao and R. Zhang, Phys. Chem. Chem. Phys., 2015, 17, 2531–2539 RSC.
- H. Lv, X. Liang, G. Ji, H. Zhang and Y. Du, ACS Appl. Mater. Interfaces, 2015, 7, 9776–9783 CrossRef CAS PubMed.
- W. Dai, H. Luo, F. Chen, X. Wang, Y. Xiong, Y. Cheng and R. Gong, RSC Adv., 2019, 9, 10745–10753 RSC.
- T. Wang, R. Han, G. Tan, J. Wei, L. Qiao and F. Li, J. Appl. Phys., 2012, 112, 104903 CrossRef.
- X. Zhang, G. Ji, W. Liu, B. Quan, X. Liang, C. Shang, Y. Cheng and Y. Du, Nanoscale, 2015, 7, 12932–12942 RSC.
- J. Feng, F. Pu, Z. Li, X. Li, X. Hu and J. Bai, Carbon, 2016, 104, 214–225 CrossRef CAS.
- H. Luo, X. Wang, K. Song, J. Yang and R. Gong, J. Electron. Mater., 2016, 45, 4202–4207 CrossRef CAS.
- P. J. Bora, I. Azeem, K. J. Vinoy, P. C. Ramamurthy and G. Madras, Composites, Part B, 2018, 132, 188–196 CrossRef CAS.
- H. Pang, W. Pang, B. Zhang and N. Ren, J. Mater. Chem. C, 2018, 6, 11722–11730 RSC.
- X. Gao, J. Li, Y. Gao, S. Guo, H. Wu and R. Chen, Compos. Sci. Technol., 2016, 130, 10–19 CrossRef CAS.
- F. Yan, S. Zhang, X. Zhang, C. Y. Li, C. L. Zhu, X. T. Zhang and Y. J. Chen, J. Mater. Chem. C, 2018, 6, 12781–12787 RSC.
| This journal is © The Royal Society of Chemistry 2019 |

