 Open Access Article
Heat treatment to improve the wear resistance of PTFE/PMMA composites
Dapeng Gu ab,
Longxiao Zhanga,
Suwen Chen
 *c,
Kefeng Songa,
Deng Panab,
Bingchao Yangd and
Shouyao Liua
aSchool of Mechanical Engineering, Yanshan University, Qinhuangdao 066004, China
bAviation Key Laboratory of Science and Technology on Generic Technology of Self-Lubricating Spherical Plain Bearing, Yanshan University, Qinhuangdao 066004, China
cDepartment of Environmental and Chemical Engineering, Yanshan University, Qinhuangdao 066004, China. E-mail: chensuwende@163.com
dSchool of Physics and Physical Engineering, Qufu Normal University, Qufu, 273165, China
First published on 18th July 2019
Abstract
Polytetrafluoroethylene/poly(methyl methacrylate) (PTFE/PMMA) composites were prepared by a self-curing method. The influence of heat treatment processes on the friction and wear behaviors of PTFE/PMMA composites against bearing steel balls were studied by a ball-on-disk tribometer. The thermal performance of PTFE/PMMA composites with heat treatment was analyzed by Thermogravimetric Analysis (TGA). The surface morphologies and element distribution of PTFE/PMMA composites in a PMMA matrix were detected by Field Emission Scanning Electron Microscopy (FE-SEM) and Energy Dispersive Spectroscopy (EDS). The results indicated that the wear rates of PTFE/PMMA composites with different heat treatments significantly declined compared with the unheated treatment composite. The wear rate of the PTFE/PMMA composite decreased firstly and then increased with molding temperature and time increasing, and reduced with the molding pressure increasing. The main wear mechanisms of PTFE/PMMA composites with different heat treatments were fatigue wear and abrasive wear.
1. Introduction
Poly(methyl methacrylate) (PMMA) is an extensively used polymer material which benefits from excellent physical and mechanical properties. However, pure PMMA is rarely used as the tribological material due to its relatively poor wear resistance and heat resistance.1–3 In Polymer Tribology, wear mechanisms include abrasive wear, adhesive wear and fatigue wear.4,5 Abrasive wear is a material-loss phenomenon due to the extrusion and movement of hard particles on the friction surface. Adhesive wear is the adhesion and tearing of micro-local materials during friction. While fatigue wear is the peeling of small pieces of material under the repeated action of high contact compressive stress. In the past few years, a number of improvement methods have been extensively carried out in order to enhance the wear resistance properties of polymers.Modification by special fillers is one of the successful ways to improve the tribological and mechanical properties of polymer materials.6–9 Therefore, many studies on filling modification of PMMA based composites have been reported.10–15 For example, filling nano-calcium oxide (CaO),10 zirconium oxide (ZrO2),11 silica,12 nano-calcium carbonate (CaCO3),13 carbon nanotubes (CNTs)14 and SiO2 + titanium oxide (TiO2)15 into PMMA can obviously reduce the friction coefficient or wear rate. In addition, the friction and wear of PMMA based composite can be obviously reduced by either filling PTFE alone16 or PTFE/Cu/Al2O3 in synergetic action.17
Heat treatment is also considered as one of the effective methods to improve the mechanical and tribological properties of polymers.18 Ayman et al.19 found that heat treatment process could improve the tribological properties of polyamide (PI). Wang et al.20 studied the effect of different molding pressures on the mechanical and tribological properties of ultra-high molecular weight polyethylene (UHMWPE) and found that the molding pressures were conducive to decrease the friction coefficient and wear rate of UHMWPE. Sarkar et al.21 found that the friction coefficient and wear rate of polyamide 6 (PA6) were both decreased by heat treatment. Therefore, the friction coefficient and wear rate of polymer can be reduced by the appropriate heat treatment process.
However, there are few literature studies focusing on the influence of heat treatment process on the tribological performances of PMMA based composites. In this paper, self-curing PTFE/PMMA composites were prepared and the dry sliding tribological behavior of PTFE/PMMA composites with various molding pressures, molding temperatures and molding times were studied.
2. Experimental
2.1. Material
A commercial acrylic product of PMMA powder was supplied by Arkema, Serquigny, France. The methyl methacrylate (MMA) (≥99.5%) monomer liquid, PTFE (5 μm) powder and catechol (≥99.5%) were all supplied by Aladdin Reagent Co. Ltd., Shanghai, China. The dibenzoyl peroxide (BPO, ≥98%; containing water 28–32%), N,N-dimethyl-p-toluidine (Dmpt, 98%) were both supplied by Sinopharm Group Chemical Reagent Co. Ltd., Shanghai, China.2.2. Specimen preparation
The PMMA matrix was synthesized by self-curing at room temperature. The synthesis process of PMMA based composite was introduced in detail in ref. 16 and 17. In this paper, the mass ratio of the powder mixture to the liquid mixture was 3![[thin space (1/6-em)]](https://www.rsc.org/images/entities/char_2009.gif) :
:![[thin space (1/6-em)]](https://www.rsc.org/images/entities/char_2009.gif) 2 and the mass ratio of PTFE was 25 wt%.
2 and the mass ratio of PTFE was 25 wt%.
2.3. Heat treatment
The PTFE/PMMA composites were secondary molding by means of hot press molding technique. Heat treatment parameters of PTFE/PMMA composites are listed in Table 1. At the end of each run of heat treatment process, the resulting specimens were cooled along with the furnace. The mold for heat treatment of PTFE/PMMA composite was made of steel. The inner diameter of the steel mold was the same as PTFE/PMMA composite fabricated by self-curing.| Test number | Molding pressure/Mpa | Molding temperature/°C | Molding time/min |
|---|---|---|---|
| 1 | 10 | 80 | 15 |
| 2 | 10 | 110 | 15 |
| 3 | 10 | 140 | 15 |
| 4 | 10 | 110 | 5 |
| 5 | 10 | 110 | 25 |
| 6 | 5 | 110 | 15 |
| 7 | 15 | 110 | 15 |
2.4. Material characterization
The worn surfaces of PTFE/PMMA composites were examined by Field Emission Scanning Electron Microscopy (FE-SEM, Sigma 500, Carl Zeiss, Oberkochen, Germany). To establish the degree of PTFE dispersion within the PMMA matrix, the worn and fractured surfaces were observed by FE-SEM and Energy Dispersive Spectroscopy (EDS). Thermal properties of PTFE/PMMA composites were studied by Thermogravimetric Analysis (TGA, STA449C, NETZSCH, Germany). And PTFE/PMMA composite were heated from 35 °C to 500 °C with the temperature increasement rate of 10 °C min−1 in the presence of argon atmosphere (100 ml min−1).2.5. Tribology tests
The friction and wear tests were carried out in a ball-on-disk tribometer (CSM Instruments, Peseux, Switzerland) in which the stationary bearing steel ball was in contact with a rotating polymer disk. The size of the ball (bearing steel, AISI E52100, hardness of HRC 60–65, Ra < 0.2 μm) was 6 mm diameter. The size of PTFE/PMMA composite was 50 mm diameter and 10 mm height. Before each test, the ball was cleaned for 30 min in alcohol using an ultrasonic cleaner. The PTFE/PMMA composites were polished (Ra = 0.4–0.6 μm) by a polishing machine and washed with alcohol and deionized water, then ultrasonic cleaned for 30 min in deionized water. The PTFE/PMMA composites were performed at ambient temperature with sliding speed of 0.2 m s−1, normal load of 5 N and total sliding distance of 500 m. In order to ensure the correctness of the data, each group of experiment was repeated three times.At the end of the experiment, the friction coefficient curve with sliding distance could be obtained directly by the CSM tribometer. The average value of the friction coefficient was calculated from five points of relative stationary part. The wear volume was measured by a conscan confocal optical profilometer (Anton Paar Compact Platform Company, Graz, Austria). The wear performance was expressed by the specific wear rate calculated by the following equation,
| ω = ΔV/(FL) | (1) |
3. Results and discussion
3.1. Element distribution analysis
Fig. 1 shows the SEM photo and the distribution of C, F and O elements by EDS in the section of PTFE/PMMA composites. C element is mainly from PMMA matrix and PTFE. O element mainly comes from PMMA matrix. F element originates from PTFE. According to the distribution of F element, it could be found that the distribution of PTFE was relatively uniform in the PMMA matrix.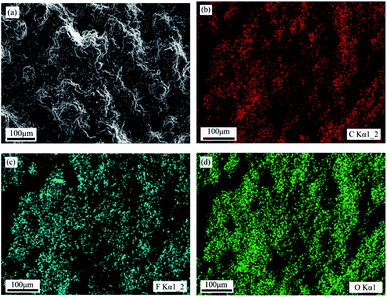 | ||
| Fig. 1 The section's SEM photo and EDS mappings of characteristic elements for PTFE/PMMA composites under 10 MPa, 110 °C and 15 min. (a) SEM; (b) C element; (c) F element; (d) O element. | ||
3.2. Thermal properties
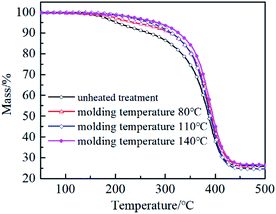 | ||
| Fig. 2 TG curves of PTFE/PMMA composites under different molding temperatures (molding pressure is 10 MPa and molding time is 15 min). | ||
| Molding temperatures | T5 (°C) | T10 (°C) | Tc (°C) |
|---|---|---|---|
| Unheated treatment | 207 | 266 | 444 |
| 80 °C | 243 | 309 | 448 |
| 110 °C | 274 | 314 | 450 |
| 140 °C | 280 | 327 | 453 |
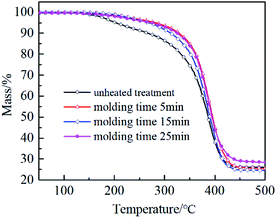 | ||
| Fig. 3 TG curves of PTFE/PMMA composites under different molding times (molding pressure is 10 MPa and molding temperature is 110 °C). | ||
| Molding times | T5 (°C) | T10 (°C) | Tc (°C) |
|---|---|---|---|
| Unheated treatment | 207 | 266 | 444 |
| 5 min | 287 | 329 | 444 |
| 15 min | 274 | 314 | 450 |
| 25 min | 278 | 324 | 453 |
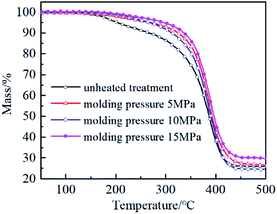 | ||
| Fig. 4 TG curves of PTFE/PMMA composites under different molding pressures (molding time is 15 min and molding temperature is 110 °C). | ||
| Molding pressures | T5 (°C) | T10 (°C) | Tc (°C) |
|---|---|---|---|
| Unheated treatment | 207 | 266 | 444 |
| 5 MPa | 270 | 324 | 453 |
| 10 MPa | 274 | 314 | 450 |
| 15 MPa | 296 | 337 | 460 |
Compared with the unheated treatment PTFE/PMMA composites, T5 and T10 values of PTFE/PMMA composites increased about 89 °C and 71 °C respectively. This can be explained by the fact that the compactness of the composite becomes better with the molding pressure increasing, and the interaction force between the long molecular chains in the matrix becomes stronger.20,27 Thus the thermal decomposition temperature rose.
3.3. Friction and wear behaviors
3.4. SEM analysis
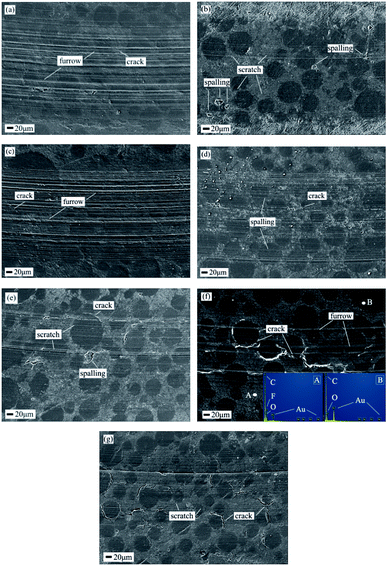
The typical morphologies of the worn surfaces of PTFE/PMMA composites under different heat treatments were investigated by SEM, as shown in Fig. 8. It can be seen that there are many circular areas with different sizes on the PTFE/PMMA composite surfaces. In order to determine the compositions of those circular areas, EDS of typical elements were recoded and the results were shown in Fig. 8(f). It indicates that those circular areas are PMMA matrix. Meanwhile, it can be seen that the circular areas tended to become larger with the molding temperature and time increasing. Ref. 16 has proved that pure PMMA has poor wear resistance. When more PMMA matrix was exposed, the wear rates of composites began to increase. This may be the reason that the wear rate increased when the molding temperature is high (140 °C) and the molding time is long (25 min). Fig. 8(a), (c) and (f) show that the worn surfaces of PTFE/PMMA composite are accompanied by severe abrasive wear, which correspond to the relatively high wear rate. While Fig. 8(b) and (f) show a relatively stable worn surface with only slight scratch, which indicates that there is slight wear during the wear process of PTFE/PMMA composite. This is consistent with the results of the lower friction coefficient and wear rate described above (Fig. 5–7). However, Fig. 8(b) (molding pressure 10 MPa) shows many spalling on the worn surfaces of PTFE/PMMA composites. It indicates that adhesion wear occurs on the worn surface. And this eventually leads to the wear rate higher than Fig. 8(g) (molding pressure 15 MPa). From Fig. 8(a)–(g), there are some cracks on the worn surfaces. This indicates that the fatigue wear occurs during the wear process of PTFE/PMMA composites.4. Conclusions
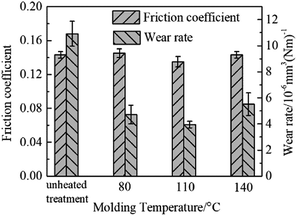
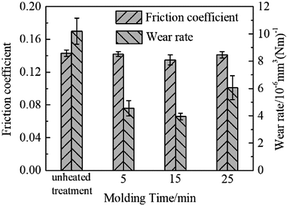
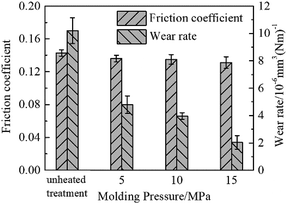
(1) Compared with the unheated treatment PTFE/PMMA composite, the thermal properties of the composites significantly increased under different heat treatment processes. Within the parameters of heat treatment, the temperature of mass loss 5 wt% (T5) increased with the increasing of the molding temperature and pressure, but fluctuated with the molding time increasing.(2) Compared with the unheated treatment PTFE/PMMA composite, the friction coefficient changed slightly under different heat treatment conditions, but the wear rate significantly decreased.
(3) The wear rate of PTFE/PMMA composite decreased firstly and then increased with the molding temperature and time increasing, and reduced with the molding pressure increasing. When the molding pressure was 15 MPa, molding temperature was 110 °C and molding time was 15 min, the wear rate of PTFE/PMMA composite was the lowest.
(4) The main wear mechanisms of PTFE/PMMA composite under different heat treatments were fatigue wear and abrasive wear. And there was slight adhesive wear.
Conflicts of interest
There are no conflicts to declare.Acknowledgements
This work was supported by National Natural Science Foundation of China (Grant No. 51605418), Natural Science Foundation of Hebei Province (Grant No. E2016203103), Youth Projects of Department of Education of Hebei Province (Grant No. QN2017148).Notes and references
- Z. B. Cai, M. H. Zhu, S. Yang, X. B. Xiao, X. Z. Lin and H. Y. Yu, Wear, 2011, 271, 2242–2251 CrossRef CAS.
- M. M. Demir, M. Memesa, P. Castignolles and G. Wegner, Macromol. Rapid Commun., 2006, 27, 763–770 CrossRef CAS.
- S. Gross, D. Camozzo, V. Di Noto, L. Armelao and E. Tondello, Eur. Polym. J., 2007, 43, 673–696 CrossRef CAS.
- C. Dong, C. Yuan, X. Bai, X. Yan and Z. Peng, RSC Adv., 2014, 4, 19034–19042 RSC.
- C. Gao, G. Zhang, T. Wang and Q. Wang, RSC Adv., 2016, 6, 51247–51256 RSC.
- J. G. Xu, H. B. Yan and D. G. Gu, Mater. Des., 2014, 61, 270–274 CrossRef CAS.
- M. Kalin, M. Zalaznik and S. Novak, Wear, 2015, 332–333, 855–862 CrossRef CAS.
- V. Pettarin, M. J. Churruca, D. Felhös and K. J. Karger, Wear, 2010, 269, 31–45 CrossRef CAS.
- L. Chang, Z. Zhang, H. Zhang and A. K. Schlarb, Compos. Sci. Technol., 2006, 66, 3188–3198 CrossRef CAS.
- L. D. Aguilera-Camacho, C. Hernández-Navarro, K. J. Moreno and J. S. García-Miranda, J. Coat. Technol. Res., 2015, 12, 347–355 CrossRef CAS.
- A. Akinci, S. Sen and U. Sen, Composites, Part B, 2014, 56, 42–47 CrossRef CAS.
- L. Y. Lin and D. E. Kim, Tribol. Int., 2011, 44, 1926–1931 CrossRef CAS.
- M. Avella, M. E. Errico and E. Martuscelli, Nano Lett., 2001, 1, 213–217 CrossRef CAS.
- Z. Yang, B. Dong, Y. Huang, L. Liu, F. Y. Yan and H. L. Li, Mater. Lett., 2005, 59, 2128–2132 CrossRef CAS.
- G. T. Gu, Z. J. Zhang and H. X. Dang, Appl. Surf. Sci., 2004, 221, 129–135 CrossRef CAS.
- D. P. Gu, L. X. Zhang, S. W. Chen, K. F. Song and S. Y. Liu, Polymers, 2018, 10, 966 CrossRef.
- D. P. Gu, L. X. Zhang, S. W. Chen, K. F. Song and S. Y. Liu, J. Appl. Polym. Sci., 2018, 135, 46705 CrossRef.
- A. A. Ayman, Int. J. Mater. Chem. Phys., 2015, 1, 132–140 Search PubMed.
- A. A. Ayman, E. B. Zeidan, A. M. Hamed and W. Y. Ali, EGTRIB Journal of the Egyptian Society of Tribology, 2010, 7, 52–64 Search PubMed.
- S. B. Wang and S. R. Ge, Wear, 2007, 263, 949–956 CrossRef CAS.
- A. D. Sarkar, Friction and Wear, Academic Press, London, 1980 Search PubMed.
- H. Fouad, A. H. I. Mourad and D. C. Barton, Polym. Test., 2005, 24, 549–556 CrossRef CAS.
- A. Pegoretti, M. Ashkar, C. Migliaresi and G. Marom, Compos. Sci. Technol., 2000, 60, 1181–1189 CrossRef CAS.
- T. Kashiwagi, F. Du, J. F. Douglas, K. I. Winey, R. H. Harris and J. R. Shields, Nat. Mater., 2005, 4, 928 CrossRef CAS.
- L. Chen, Z. Huang, G. Dong, C. He, L. Liu, Y. Hu and Y. Li, Polym. Compos., 2009, 30, 239–247 CrossRef CAS.
- L. Q. Cui, N. H. Tarte and S. L. Woo, Macromolecules, 2008, 41, 4268–4274 CrossRef CAS.
- N. C. Prasnis and K. Ramani, J. Mater. Sci., 1998, 9, 165–172 Search PubMed.
| This journal is © The Royal Society of Chemistry 2019 |

