 Open Access Article
The behaviour of water on the surface of kaolinite with an oscillating electric field
Bo Liao ,
Li Qiu,
Diansheng Wang,
Wancheng Bao,
Yupeng Wei and
Yudou Wang
 *
*
School of Science, China University of Petroleum, Qingdao 266580, China. E-mail: wangyd@upc.edu.cn
First published on 15th July 2019
Abstract
A quantitative understanding of oscillating electric field effects on the behaviour of water on the surface of kaolinite is vital for research in the field of clay–water systems. The behaviour of water molecules on the (0 0 1) and (0 0 −1) surfaces of kaolinite are systematically investigated in the absence or presence of an oscillating electric field using molecular dynamics simulations. The simulated results demonstrate that the applied oscillating electric fields parallel to kaolinite surface contribute to decreased amounts of adsorbed water molecules on the (0 0 1) surface of kaolinite. The oscillating electric field performs an inconspicuous effect on the adsorption of water on the (0 0 −1) surface of kaolinite. The behaviour of water on the surface of kaolinite will be impacted more severely by oscillating electric fields. Our results demonstrate that water molecules will rotate following the directions of the applied fields, which causes the decrease of hydrogen bonds, and thus, the weaker water–kaolinite interactions due to the applied field drive water molecules away from kaolinite surfaces. These results are of significance to understand the mechanisms of the oscillating electric fields affecting the behaviour of clay–water systems.
1. Introduction
Clay minerals, which have micropore to mesopore structures and large surface areas, are the main components of soil, shale, coal, and conventional reservoir rock.1,2 Water, as a natural solvent or as a transport medium for chemical species, is considered ubiquitous in clay minerals.3 Water–clay interaction plays a dominant role in the phenomena of adsorption, dissolution, precipitation, diffusion, and growth in clay minerals.4 The assessment of mesoscopic and macroscopic properties of liquids and solids influenced by clay–water interactions are attracting increasing attention in oil/gas production, CO2 storage and sequestration in the subsurface, nuclear waste treatment and storage in geological formations, reactive transport and flow in soils and sediments, and in other related environmental and geological applications. Kaolinite is one of the most abundant components in clay minerals in nature whose structure consists of silica–oxygen tetrahedron and alumina–oxygen octahedron stacked repeatedly in space in the ratio of 1![[thin space (1/6-em)]](https://www.rsc.org/images/entities/char_2009.gif) :
:![[thin space (1/6-em)]](https://www.rsc.org/images/entities/char_2009.gif) 1, and the unit layers are connected by hydrogen bonds.1,5,6 The octahedral and tetrahedral surfaces of the kaolinite layer are of different chemical natures being hydrophilic and hydrophobic, respectively.4 As a consequence, understanding the behaviour of water in kaolinite pores is important to research in the fields of clay–water systems.
1, and the unit layers are connected by hydrogen bonds.1,5,6 The octahedral and tetrahedral surfaces of the kaolinite layer are of different chemical natures being hydrophilic and hydrophobic, respectively.4 As a consequence, understanding the behaviour of water in kaolinite pores is important to research in the fields of clay–water systems.
In recent years, a variety of external electrical fields were applied into nuclear waste treatments, micro/nano devices manufacturing, degradation of environmentally harmful organic compounds, and petroleum industry.7–13 The structure and properties of water–solids interfaces under the influence of an external electric field are quite important for these fields. Except the thermal effects of oscillating electric fields,14 the non-thermal effects of electric field on matter are another key factor changing the properties of water–solid interfaces. Some studies of the structures and properties of water–solids interfaces under applied electric fields have appeared. English and Futera have investigated the effects of external static electric fields applied to TiO2/water interfaces by non-equilibrium molecular dynamics techniques.8,15,16 Song et al.17,18 and Zong et al.19 found that the wetting properties of water droplets on some solid faces are changed by an external electric field using molecular dynamics simulations. Some researchers have shown that external electric fields can control water flow direction in nanochannels and enhance ion separation or water purification in carbon nanotubes or other porous membranes. The relationships between flow velocity and strength or frequency of electric field have been discussed.20,21 Moreover, the effect of electric fields on water viscosity has been explained by Zong et al.22 Although the behaviour of water on the surface of clays has been researched for many years,4,23–30 the effects of oscillating electrical fields on water behaviour on the surface of clays are not completely understood.
In this paper, the molecular dynamics simulations (MD) were performed to investigate the behaviour of water on the surfaces of kaolinite with oscillating electric field. The behaviour of water on octahedral and tetrahedral surfaces of the kaolinite was studied and compared, and their different behaviour were attributed to the different chemical natures of the two surfaces. The effects of direction, intensity, and frequency of external oscillating electric field on the behaviour of water on these two surfaces of kaolinite were studied. We mainly analyzed the density distribution and radial distribution functions of the water in the pores under the effects of oscillating electric field. In order to thoroughly understand the effects of electrical field on the behaviour of water on the surfaces of kaolinite, the dipole moments of water molecules, hydrogen bonds, interaction energy between kaolinite and water were carefully examined.
2. Methodology
The system simulated only consists of kaolinite and water. The initial structure of the water molecules and the pore wall with different surface of kaolinite in the simulation system were shown in Fig. 1. Water molecules were described using the simple point charge SPC/E model.31 The angle and the length of water molecular were 109°47′ and 0.100 nm which as shown in Fig. 1a. The model of hydrated kaolinite contained 898 water molecules to make the bulk density of water equal to 1 g cm−3. Kaolinite, of which the unite cell used in this work can be presented as Si4Al4O10(OH)8, was a 1![[thin space (1/6-em)]](https://www.rsc.org/images/entities/char_2009.gif) :
:![[thin space (1/6-em)]](https://www.rsc.org/images/entities/char_2009.gif) 1 clay mineral.32 As a result, kaolinite naturally formed two types of internal surface pores, one was (0 0 1) surface which was covered by hydroxyl and another one was (0 0 −1) surface which was covered by silicon and oxygen. The (0 0 1) surface and (0 0 −1) surface of kaolinite were chosen as the solid substrate to study the behaviour of water on the surfaces of kaolinite with oscillating electric fields,33 as shown in Fig. 1b and c, respectively. Molecular dynamic simulations were performed to study the adsorption/desorption of water in a pore space of kaolinite platelets (approximately 3 nm wide). The simulation model sizes along the x, y and z directions were 25.75 Å, 35.72 Å and 58.08 Å, respectively. In our simulations, all atoms of kaolinite remain fixed and the CLAYFF force field34 was employed to describe kaolinite.
1 clay mineral.32 As a result, kaolinite naturally formed two types of internal surface pores, one was (0 0 1) surface which was covered by hydroxyl and another one was (0 0 −1) surface which was covered by silicon and oxygen. The (0 0 1) surface and (0 0 −1) surface of kaolinite were chosen as the solid substrate to study the behaviour of water on the surfaces of kaolinite with oscillating electric fields,33 as shown in Fig. 1b and c, respectively. Molecular dynamic simulations were performed to study the adsorption/desorption of water in a pore space of kaolinite platelets (approximately 3 nm wide). The simulation model sizes along the x, y and z directions were 25.75 Å, 35.72 Å and 58.08 Å, respectively. In our simulations, all atoms of kaolinite remain fixed and the CLAYFF force field34 was employed to describe kaolinite.
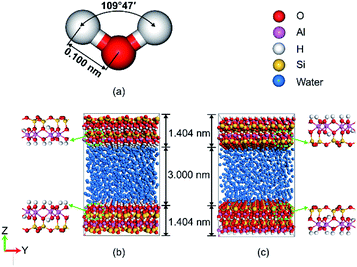 | ||
| Fig. 1 Snapshot of (a) water molecules, (b) simulation model of (0 0 1) and (c) simulation model of (0 0 −1) with the color scheme: water, blue; Si, yellow; Al, pink; O and H, red and white. | ||
The non-bond interactions among all atoms in the simulation system were described by:35
 | (1) |
 | (2) |
 | (3) |
Long-range electrostatic interaction was calculated by the particle–particle particle–mesh (PPPM) summation algorithm with a convergence parameter of 10−8, and the cutoff of non-bonded interaction was set to be 10.0 Å. Table 1 contained all the parameters that used in this work.
| Atom | ε (kcal mol−1) | σ (Å) | q (e) |
|---|---|---|---|
| a Ob: bridging oxygen; Oh: hydroxyl oxygen. | |||
| Water | |||
| O | 0.1553 | 3.1660 | −0.8476 |
| H | 0 | 0 | 0.4238 |
![[thin space (1/6-em)]](https://www.rsc.org/images/entities/char_2009.gif) |
|||
| Kaolinite | |||
| Al | 1.3297 × 10⁻⁶ | 4.2713 | 1.575 |
| Si | 1.8402 × 10⁻⁶ | 3.3020 | 2.100 |
| Ob | 0.1554 | 3.1655 | −1.050 |
| Oh | 0.1554 | 3.1655 | −0.950 |
| H | 0 | 0 | 0.425 |
The applied oscillating electric fields were expressed as follows:16,36
 | (4) |
All calculations were done by the LAMMPS (Large-scale Atomic/Molecular Massively Parallel Simulator) software package under the NVT ensemble.37 The time step of MD simulation was 1.0 fs and the temperature was controlled by the Nose–Hoover thermostat38 at 333.15 K. Only the last 2.0 ns of equilibrium molecular dynamics (EMD) trajectories in 4.0 ns were collected for data acquisition and analysis for all the cases without electric fields applying. Then, 5.0 ns non-equilibrium molecular dynamics (NEMD) trajectories were used to stabilize the system based on 4.0 ns EMD trajectories, and then the final 4.0 ns was used for sampling and analysis of the non-equilibrium data.
3. Results and discussion
3.1. Effects of directions of oscillating electric fields on water behaviour
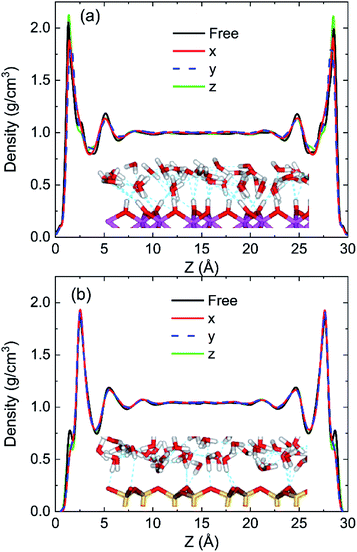
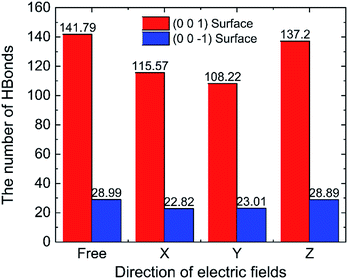
To discuss the behaviour of water in kaolinite with oscillating electric fields, the directions of oscillating electric fields should be studied preferentially.22,39 Considering the configuration of system and anisotropy of hydroxyl on the surface of kaolinite, we applied an electric field with 0.25 V Å−1 and 100 GHz along x, y and z directions of (0 0 1) and (0 0 −1) sheet, respectively. Fig. 2 shows the effects of directions of electric fields on the density distribution of water molecules. Three adsorption layers are formed on (0 0 1) and (0 0 −1) surfaces, but the third adsorption layer of (0 0 1) surface is not obvious. It is clear that the first water adsorption layer on the (0 0 1) surface is formed at z = 1.249 Å from the pore walls, which is closer than the first water adsorption layer on the (0 0 −1) surface at z = 2.768 Å. Furthermore, the first adsorption layer on the (0 0 1) surface has denser water molecules compared with the (0 0 −1) surface. This phenomenon can be attributed to the fact that the (0 0 1) surface of kaolinite is covered with hydroxyl while the (0 0 −1) surface of kaolinite is covered with silicon–oxygen, thus, the kaolinite (0 0 1) surface (hydroxyl surface) is more hydrophilic than (0 0 −1) surface (silicon–oxygen surface) because hydrogen bonds are easily formed between hydroxyl and water molecules.40 Fig. 2a and b also show the configuration snapshots of the two kinds of surfaces forming hydrogen bonds with water without electric fields. The statistical results show that 142 hydrogen bonds are formed on (0 0 1) surface and 29 hydrogen bonds are formed on (0 0 −1) surface, as shown in Fig. 3.The first adsorption layer of (0 0 1) surface changes greatly when the electric field was applied. Fig. 2a shows that the peak of the first adsorption layer on the (0 0 1) surface decreases from 2.055 g cm−3 to 1.885 g cm−3 or 1.814 g cm−3 when electric field was applied in the x or y direction. And there is a slight increase in the peak of the first adsorption layer when electric field was applied in the z direction. Due to the polarity of water molecule, it would rotate following the oscillating electric fields according to the direction and frequency of applied oscillating electric fields, and therefore, the applied oscillating electric field leads to a decrease of the number of hydrogen bonds between hydroxyl and water molecules, leading to desorb of water molecules from the surface. From Fig. 3, we know that the number of hydrogen bonds decreases from 142 to 116 or 108 when electric field was applied in x or y direction. But just few hydrogen bonds are broken when electric field was applied along z direction. The effects of electric fields on density distribution of water on (0 0 −1) surface are, however, limited whatever direction the electric field is, as Fig. 2b shows. Although only 29 hydrogen bonds are formed between water molecules and the (0 0 −1) surface of kaolinite which is covered by silicon–oxygen without electric fields, as Fig. 3 shows, most of the hydrogen bonds remain when electric field was applied.
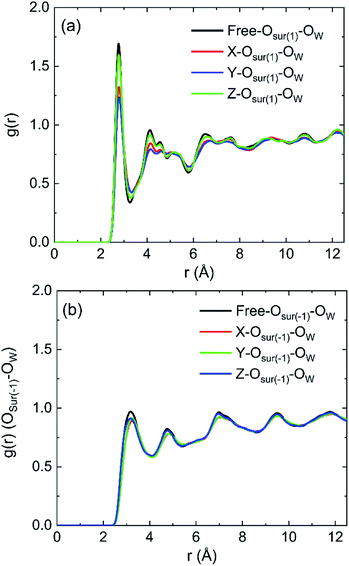
The radial distribution functions (RDFs) between oxygen of hydroxyl on kaolinite (0 0 1) surface and oxygen of water (OSur(1)–OW) and the RDFs between oxygen of hydroxyl on (0 0 −1) surface and oxygen of water (OSur(−1)–OW) are shown in Fig. 4. Owing to the value of cutoff (10.0 Å) of the non-bonded interaction and the dimension of the pore (half of the dimension of pore of kaolinite is 15.0 Å), the RDFs were presented in the range of 12.5 Å. The peak of two RDFs describe the distribution of oxygen atoms of water around the oxygen atoms of hydroxyl. From the first peak of Fig. 4a, it is obvious that the distribution of water molecule changes after applying an electric field in x, y and z directions and the spatial distribution of water molecules can be greatly influenced by the applied electric field along y direction on kaolinite (0 0 1) surface. However, the same phenomenon is not obvious in Fig. 4b, the electric fields in different directions have limited effect on the spatial distribution of water molecules on the (0 0 −1) surface of kaolinite. We can infer that the presence of hydroxyl groups plays an important role in the spatial distribution and orientation of water molecules in kaolinite pores.
The spatial orientation of water molecules will be influenced by oscillating electric fields because of the permanent dipole moment of it.41 The average dipole moment of water along the directions of electric fields, μx, μy and μz, are calculated to show the degree of molecular alignment with the electric field when oscillating electric fields were applied along the x, y, and z directions of the simulation box, respectively:
 | (5) |
Fig. 5a shows the results of average dipole moment (μ) of all 898 water molecules in oscillating electric fields when electric fields with E = 0.25 V Å−1 and 100 GHz were applied on (0 0 1) surface at x, y, and z directions. It shows that the electric fields can induce the directional arrangement of water molecules following the oscillating electric fields. It is obvious that μx, μy and μz have the same phenomenon of sinusoidal variation over time according with the frequency of electric field. But μx is almost equal to μy, and μz is less than μx. We can infer that the orientations of dipoles of more water molecules do not follow the directions of electric fields when the electric field was applied in the z direction compared with x or y direction. To describe the orientations of water molecules, we define
 | (6) |
![[thin space (1/6-em)]](https://www.rsc.org/images/entities/char_2009.gif) θ at the moment that dipole moment along the direction of electric field is maximum. It is clear that most of cos
θ at the moment that dipole moment along the direction of electric field is maximum. It is clear that most of cos![[thin space (1/6-em)]](https://www.rsc.org/images/entities/char_2009.gif) θx and cos
θx and cos![[thin space (1/6-em)]](https://www.rsc.org/images/entities/char_2009.gif) θy of water molecules are distributed in the range of 0.75 to 1 when the electric fields were applied along x and y directions. It means that most water molecules are well aligned with the electric field. However, when the electric field was applied along z direction, the cos
θy of water molecules are distributed in the range of 0.75 to 1 when the electric fields were applied along x and y directions. It means that most water molecules are well aligned with the electric field. However, when the electric field was applied along z direction, the cos![[thin space (1/6-em)]](https://www.rsc.org/images/entities/char_2009.gif) θz of water molecules are nearly distributed evenly between −1 and 1, although the number of water molecules with positive cos
θz of water molecules are nearly distributed evenly between −1 and 1, although the number of water molecules with positive cos![[thin space (1/6-em)]](https://www.rsc.org/images/entities/char_2009.gif) θz is slightly higher than that with negative value. That is why μz is less than μx or μy, and the amounts of water molecules desorb by z direction electric field is less than that of x or y direction electric field. Similar statistical results can also be obtained on the (0 0 −1) surface, as shown in Fig. 5c and d. According to the response of water molecules to the oscillating electric fields with different directions, we can infer that the orientations of water molecules in the pores are determined by the orientations of electric field, hydroxyl groups, and the positions of water molecules.
θz is slightly higher than that with negative value. That is why μz is less than μx or μy, and the amounts of water molecules desorb by z direction electric field is less than that of x or y direction electric field. Similar statistical results can also be obtained on the (0 0 −1) surface, as shown in Fig. 5c and d. According to the response of water molecules to the oscillating electric fields with different directions, we can infer that the orientations of water molecules in the pores are determined by the orientations of electric field, hydroxyl groups, and the positions of water molecules.
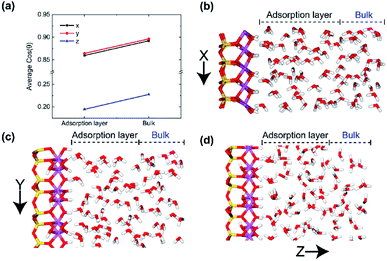
In order to better verify the effects of the positions of water molecules on their orientations in electric fields, we calculated the average cos![[thin space (1/6-em)]](https://www.rsc.org/images/entities/char_2009.gif) θ of adsorption layer and bulk phase layer on the (0 0 1) surface with different electric directions, respectively, as shown in Fig. 6. It is clear that most of the water molecules in both adsorption layer and bulk phase are aligned along the direction of the electric field no matter which direction of electric field was applied, but the direction of molecules in bulk phase is closer to the direction of electric field. It means that the dipole moment of water molecules in adsorption layer is less susceptible to the electric field than the adsorbed layer molecules because of the stronger action of hydrogen bonds between hydroxyl and water molecules. And much more water molecules are well aligned with x and y direction electric field, demonstrated in Fig. 6b–d. Because of the fixed hydroxyls on the surface, the water molecules in the adsorption layer are more difficult to rotate with the oscillating electric field than those in bulk phase.
θ of adsorption layer and bulk phase layer on the (0 0 1) surface with different electric directions, respectively, as shown in Fig. 6. It is clear that most of the water molecules in both adsorption layer and bulk phase are aligned along the direction of the electric field no matter which direction of electric field was applied, but the direction of molecules in bulk phase is closer to the direction of electric field. It means that the dipole moment of water molecules in adsorption layer is less susceptible to the electric field than the adsorbed layer molecules because of the stronger action of hydrogen bonds between hydroxyl and water molecules. And much more water molecules are well aligned with x and y direction electric field, demonstrated in Fig. 6b–d. Because of the fixed hydroxyls on the surface, the water molecules in the adsorption layer are more difficult to rotate with the oscillating electric field than those in bulk phase.
As can be seen from the above discussion, the electric field parallel to the surface of the kaolinite (include x and y directions) has a significantly greater effect on the behaviour of water than the electric field normal to the surface of the kaolinite.
3.2. Effects of the intensity of oscillating electric field on water behaviour
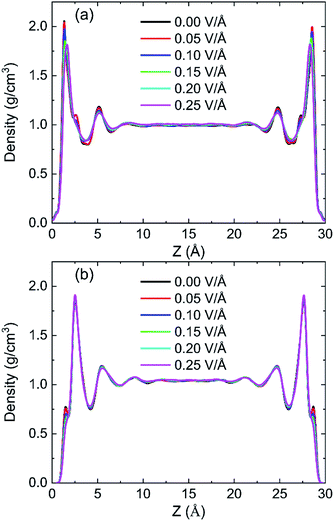
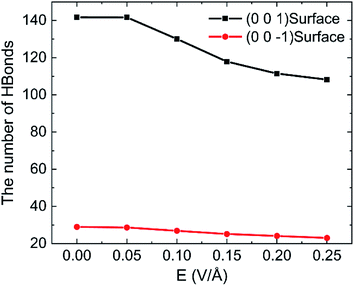
In order to research the effects of the intensity of oscillating electric field on the behaviour of water in kaolinite pore, the density distribution of 898 water molecules with different intensity of electric fields were applied in y direction are shown in Fig. 7. It is obvious that the density of adsorption layer of water molecules shows a downward tendency. The peak of the first adsorption layer decreases from 2.06 g cm−3 to 2.04 g cm−3, 1.98 g cm−3, 1.85 g cm−3, 1.82 g cm−3 and 1.81 g cm−3 when the electric fields with 0.00 V Å−1, 0.05 V Å−1, 0.10 V Å−1, 0.15 V Å−1, 0.20 V Å−1 and 0.25 V Å−1 were introduced into the pore formed by (0 0 1) surface, respectively. Meanwhile, the position of first adsorption peak moves away from the surface to the center from 1.3295 Å to 1.3331 Å, 1.3595 Å, 1.4185 Å, 1.6006 Å and 1.6404 Å when electric fields with the above intensity were introduced. It indicates that some water molecules gradually broke away the shackles of the kaolinite and dissociate from the surface to center of pore with the increase of electric field intensity. But the effects of electric field intensity on density distribution of water in the pore formed by (0 0 −1) surface are not evident, as Fig. 7b shows. The value and the position of the adsorption layer are almost unchanged with the increase of electric field intensity, indicating that the reaction of water molecules adsorbed on (0 0 1) surface to the increase of electric field is more obvious than that of (0 0 −1) surface. It can be explained from the effects of intensity of electric field on the number of hydrogen bonds formed between water molecules and the surface of kaolinite.More hydrogen bonds are formed between water molecules and the hydroxyl groups on (0 0 1) surface than that formed between water molecules and the oxygen atoms on (0 0 −1) surface, as shown in Fig. 8. The number of hydrogen bonds slightly decreases when electric field of 0.05 V Å−1 was applied and remarkably decreases with a continuous increasing intensity of electric field. The average number of hydrogen bonds on (0 0 1) surface decreases from 141.72 to 108.22 and the average number of hydrogen bonds on (0 0 −1) surface decreases from 28.99 to 23.01 when electric fields of 0.25 V Å−1 was introduced to the system. Hydrogen bonds can be destroyed by oscillating electric fields because water molecules would rotate following the frequency of applied electric fields.33 It is concluded that hydrogen bonds are more prone to be destroyed to electric fields with stronger intensity. Although, the amounts of water molecules desorbed from (0 0 −1) surface is not obvious with the increase of intensity.
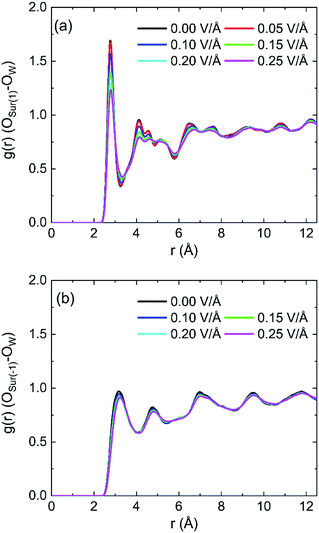
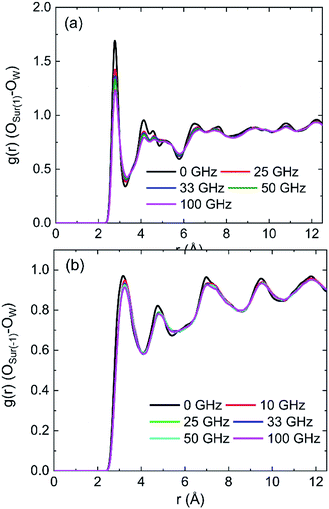
The RDFs between oxygen of hydroxyl on (0 0 1) surface of kaolinite and oxygen of water (OSur(1)–OW) and the RDFs between oxygen of kaolinite on (0 0 −1) surface and oxygen of water (OSur(−1)–OW) are shown in Fig. 9. It is distinct from the graph that the value of the first peak of RDFs decreases with the increase of intensity of oscillating electric fields, but the position of the peak keeps constant for both OSur(1)–OW and OSur(−1)–OW. The results show that the distance between some oxygen atoms of water and the oxygen atoms of hydroxyl gradually increase and the water molecules move away from the wall with the increase of intensity of oscillating electric fields. It also means electric fields with stronger intensity can lead to a bigger decrease of the number of hydrogen bonds. It is obvious that the first peak of OSur(1)–OW is closer slightly to the surface than the first peak of OSur(−1)–OW. It is consistent with the conclusion above.
Fig. 10 shows the effects of intensity of oscillating electric fields on interaction energy between water and kaolinite. We can clearly see that the interaction energy between the (0 0 1) surface of kaolinite and water molecules is about twice of that of (0 0 −1) surface because water molecules can form more hydrogen bonds with the (0 0 1) surface of kaolinite. The interaction energy between water molecules and kaolinite increases with the increase of intensity of electric fields. And the oscillating electric fields have a stronger influence on the interaction of (0 0 1) surface of kaolinite with water molecules than that of (0 0 −1) surface. Actually, hydrogen bond plays an important role in the interaction energy between water molecules and kaolinite. The interaction between kaolinite and water molecules becomes weaker when stronger intensity electrical fields were introduced because more hydrogen bonds were destroyed by oscillating electric field.
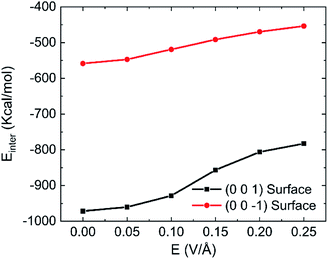 | ||
| Fig. 10 Effects of different intensity on the interaction energy between water and kaolinite (100 GHz, 333.15 K). | ||
The effects of intensity of oscillating electric fields on average dipole moment (μ) of 898 water molecules on (0 0 1) and (0 0 −1) surface are shown in Fig. 11a and b, respectively. It is clear that water molecules rotate following the frequency of applied electric fields and lead to dipolar alignment with the fields, no matter water molecules are in the pore formed by (0 0 1) or (0 0 −1) surface. The peak of the average dipole moment of water molecules in y component increases with the increase of intensity of electric field. It can infer that stronger applied electric fields can better overcome the interaction between water molecules and lead to a better alignment.
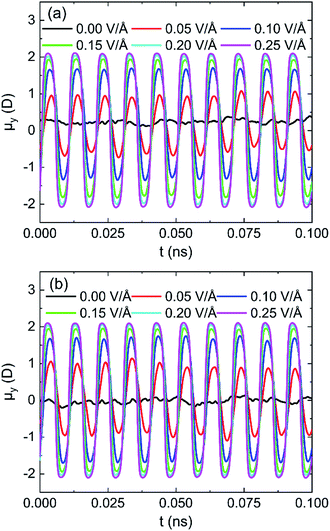 | ||
| Fig. 11 System y component of the average dipole moment for different intensity of electric fields 100 GHz on (a) (0 0 1) surface and (b) (0 0 −1) surface. | ||
The statistical results of cos![[thin space (1/6-em)]](https://www.rsc.org/images/entities/char_2009.gif) θ at the moment of maximum of dipole moment with the field of 100 GHz on (0 0 1) and (0 0 −1) surface are shown in Fig. 12. The larger the value of cos
θ at the moment of maximum of dipole moment with the field of 100 GHz on (0 0 1) and (0 0 −1) surface are shown in Fig. 12. The larger the value of cos![[thin space (1/6-em)]](https://www.rsc.org/images/entities/char_2009.gif) θ is, the smaller the angle between the direction of the dipole moment of the water molecule and the direction of the electric field is. It is clear that the percentage of dipole alignment to the direction of field gradually increases with the increase of intensity of oscillating electric fields both on (0 0 1) surface and (0 0 −1) surface. The electrical force exerted on a water molecule by stronger electric field can further overcome the actions of other molecules on it and more water molecules can rotate following the oscillating electric fields according to the direction of applied oscillating electric fields. Comparing the percentage data, we can find that the percentage of dipole alignment of (0 0 −1) surface with higher cos
θ is, the smaller the angle between the direction of the dipole moment of the water molecule and the direction of the electric field is. It is clear that the percentage of dipole alignment to the direction of field gradually increases with the increase of intensity of oscillating electric fields both on (0 0 1) surface and (0 0 −1) surface. The electrical force exerted on a water molecule by stronger electric field can further overcome the actions of other molecules on it and more water molecules can rotate following the oscillating electric fields according to the direction of applied oscillating electric fields. Comparing the percentage data, we can find that the percentage of dipole alignment of (0 0 −1) surface with higher cos![[thin space (1/6-em)]](https://www.rsc.org/images/entities/char_2009.gif) θ is slightly bigger than that of (0 0 1) surface. It can infer that the water molecules on the silicon oxide surface are more likely to align along the direction of the electric field than the water molecules on the hydroxyl surface.
θ is slightly bigger than that of (0 0 1) surface. It can infer that the water molecules on the silicon oxide surface are more likely to align along the direction of the electric field than the water molecules on the hydroxyl surface.
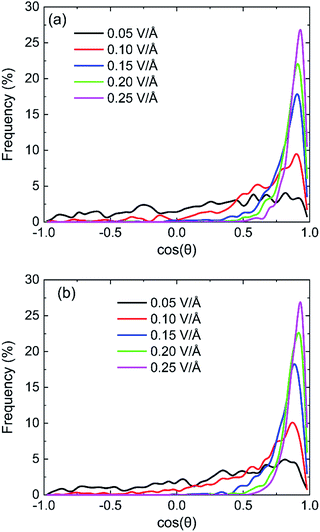 | ||
Fig. 12 The statistical results of cos![[thin space (1/6-em)]](https://www.rsc.org/images/entities/char_2009.gif) θ at the moment of maximum of dipole moment with the field of 100 GHz on (a) (0 0 1) surface and (b) (0 0 −1) surface. θ at the moment of maximum of dipole moment with the field of 100 GHz on (a) (0 0 1) surface and (b) (0 0 −1) surface. | ||
The effects of intensity of electric field on alignment of water molecules depend on the position of the molecule, as shown in Fig. 13. It is obvious that both the average cos![[thin space (1/6-em)]](https://www.rsc.org/images/entities/char_2009.gif) θ of adsorption layer and bulk phase increase with the increase of intensity of electric field. It means that the number of water molecule aligned with electric field increases with the increase in intensity of electric field. The direction of molecules of water in bulk phase is almost random when no electric field is absent. But direction of molecules of water in adsorbed layer aligns in the y direction to some extent because of the interaction between kaolinite and water molecules. The molecules of water in bulk phase are easier than that in adsorption layer to rotate following the direction of applied electric fields and lead to dipolar alignment with the fields. The average cos
θ of adsorption layer and bulk phase increase with the increase of intensity of electric field. It means that the number of water molecule aligned with electric field increases with the increase in intensity of electric field. The direction of molecules of water in bulk phase is almost random when no electric field is absent. But direction of molecules of water in adsorbed layer aligns in the y direction to some extent because of the interaction between kaolinite and water molecules. The molecules of water in bulk phase are easier than that in adsorption layer to rotate following the direction of applied electric fields and lead to dipolar alignment with the fields. The average cos![[thin space (1/6-em)]](https://www.rsc.org/images/entities/char_2009.gif) θ of molecules of water in bulk phase increases rapidly than that of adsorption layer. The average cos
θ of molecules of water in bulk phase increases rapidly than that of adsorption layer. The average cos![[thin space (1/6-em)]](https://www.rsc.org/images/entities/char_2009.gif) θ of molecules of water in bulk phase is larger than that of adsorption layer when E > 0.1 V Å−1.
θ of molecules of water in bulk phase is larger than that of adsorption layer when E > 0.1 V Å−1.
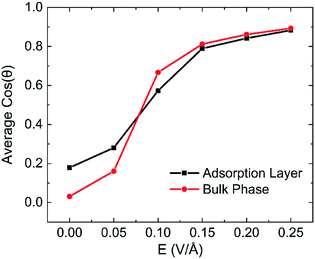 | ||
| Fig. 13 The statistics on each layered of average cos(θ) after applying electric fields on (0 0 1) surface in y direction with different intensity. | ||
3.3. Effects of the frequency of oscillating electric field on water behaviour
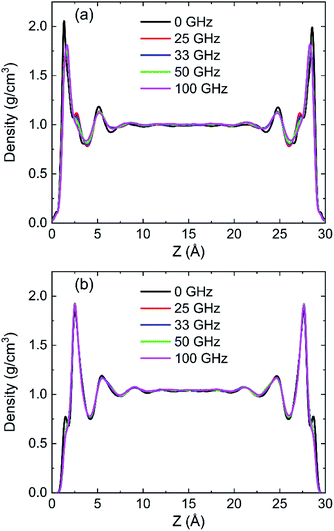
Density distribution of water molecules were calculated to investigate the effects of frequencies of oscillating electric fields on adsorption of water molecules on (0 0 1) and (0 0 −1) surface of kaolinite are shown in Fig. 14. The position of the peak of the first adsorption layer moves form 1.3295 Å to 1.4015 Å, 1.6276 Å, 1.6331 Å and 1.6438 Å when electric fields with frequencies of 25 GHz, 33 GHz, 50 GHz, 100 GHz were applied in the pore formed by (0 0 1) surface, as Fig. 14a shows. And there is a slight decrease of the peak of the first adsorption layer when higher frequency electric fields were introduced. It means that the water molecules show a tendency to keep away from the surface when higher frequency electric fields were introduced. But the effects of frequency of electric fields to the density distribution of water molecules on (0 0 −1) surface of kaolinite are inconspicuous. The peak of the adsorption layers did not change significantly with the increase of frequency, as Fig. 14b shows.The RDFs between oxygen of hydroxyl on the (0 0 1) surface of kaolinite and oxygen of water (OSur(1)–OW) and the RDFs between oxygen of silica on the (0 0 −1) surface of kaolinite and oxygen of water (OSur(−1)–OW) are shown in Fig. 15. It is distinct from the graph that the value of the first peak of RDFs decreases with the increase of frequency of oscillating electric fields and the position of the peak keep constant for both OSur(1)–OW and OSur(−1)–OW. It is also obvious that the first peak of OSur(1)–OW is closer to the surface than the first peak of OSur(−1)–OW, corresponding to the density distribution of water molecules.
The results in Fig. 16 for μy of water in oscillating electric fields with 0.25 V Å−1 on (0 0 1) and (0 0 −1) surface show that water molecules rotate following the oscillating electric fields according to the frequency of applied electric fields, leading to dipolar alignment with the fields.33 The water molecules rotate faster as the frequency of electric field increases, which can destroy more hydrogen bonds.
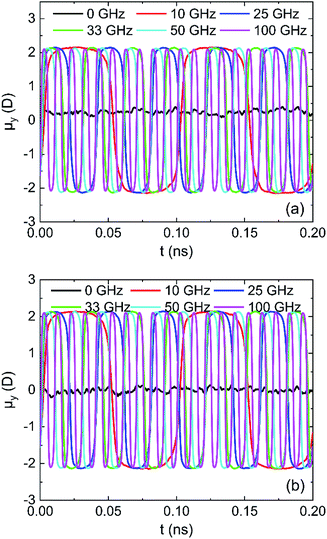 | ||
| Fig. 16 System y component of the total dipole moment in 0.25 V Å−1 fields: (a) (0 0 1) surface and (b) (0 0 −1) surface. | ||
The effects of frequencies of oscillating electric fields on the number of hydrogen bonds which are formed between water molecules and the hydroxyl groups on (0 0 1) surface or oxygen atoms on (0 0 −1) surface are shown in Fig. 17. The results clearly show that the frequency of oscillating electric fields have biggish effect on the number of hydrogen bonds due to the fact that water molecule is polar molecules. There is a sharp decrease of hydrogen bonds because of the rotation of water molecule when 10 GHz electric field is applied. The trend of number of hydrogen bond decline is slowing down with the increase of frequency of electric field, as Fig. 17b and d show.
 | ||
| Fig. 17 The number of hydrogen bonds under different oscillating electric fields: (a) (0 0 1) surface, (b) (0 0 1) surface, (c) (0 0 −1) surface, (d) (0 0 −1) surface. | ||
The effects of frequency of oscillating electric fields on interaction energy between water and kaolinite are as shown in Fig. 18. It is clear that the interaction between water and (0 0 1) surface of kaolinite is much stronger than (0 0 −1) surface of kaolinite because more hydrogen bonds are formed on it. The interaction energy of water molecules and (0 0 1) surface and (0 0 −1) surface of kaolinite gradually increase with the increase of frequency of electric fields. The increase of interaction energy between water and (0 0 1) surface is more obvious than that between water and (0 0 −1) surface. It means that the effect of electric fields on the interaction between water molecules and (0 0 −1) surface of kaolinite is limited. It is consistent with the conclusion above.
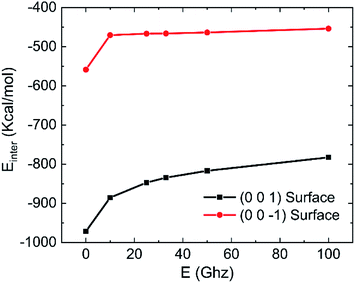 | ||
| Fig. 18 Effects of frequency on the interaction energy between water and kaolinite (0.25 V Å−1, 333.15 K). | ||
4. Conclusions
Molecular dynamic simulations were employed to research the effects of oscillating electric fields on adsorption/desorption behaviour of water molecules on kaolinite (0 0 1) and (0 0 −1) surface. Introducing electric fields with different directions, intensities, and frequencies, the density distribution of water was analyzed. The mechanisms of water adsorption on different kaolinite surfaces in oscillating electric fields were explored by dipole moment, radial distribution functions, hydrogen bonds, and interaction energy. The main conclusions are as follows:(1) Theoretically, introducing oscillating electric fields could affect the adsorption/desorption behaviour of water in the pore of kaolinite because of the polarity of water molecules.
(2) The (0 0 1) surface of kaolinite was more hydrophilic than (0 0 −1) surface because hydrogen bonds were easily formed between hydroxyl and water molecules. More water molecules desorbed from the (0 0 1) surface of kaolinite when electric fields were applied in the direction that parallel to kaolinite surface. The effects of oscillating electric fields were not obvious on adsorption/desorption behaviour of water molecules on the (0 0 −1) surface of kaolinite.
(3) Introducing oscillating electric fields could lead to decrease adsorption of water and the thicker adsorption layer. The adsorption of water decreased with the increase of frequency or intensity of the electric fields.
(4) The applied oscillating fields reduces the number of hydrogen bonds formed on the interfaces of water–kaolinite due to water molecules re-orientates following the oscillating electric fields. More hydrogen bonds were broken by electric fields of stronger intensity or higher frequency.
(5) The interaction energy of H2O–kaolinite increased with the intensity and frequency of the applied oscillating electric fields.
Conflicts of interest
There are no conflicts to declare.Acknowledgements
This research was financially supported by the National Natural Science Foundation of China (51574268), the Shandong Province Natural Science Foundation (ZR2014EEM050) and the Graduate Innovation Fund of China University of Petroleum (YCX2019089).References
- B. Zhang, J. Kang and T. Kang, Appl. Surf. Sci., 2018, 439, 792–800 CrossRef CAS.
- B. Rotenberg, V. Marry, N. Malikova and P. Turq, J. Phys.: Condens. Matter, 2010, 22, 284114 CrossRef CAS.
- D. M. Jarvie, AAPG Mem., 2012, 97, 89–119 Search PubMed.
- D. Tunega, M. H. Gerzabek and H. Lischka, J. Phys. Chem. B, 2004, 108, 5930–5936 CrossRef CAS.
- B. K. Benazzouz, A. Zaoui and A. B. Belonoshko, Am. Mineral., 2013, 98, 1881–1885 CrossRef CAS.
- Q. Chi, R. Zhen, X. Wang, K. Yang, Y. Jiang, F. Li and B. Xue, Polym. Bull., 2017, 74, 3089–3108 CrossRef CAS.
- A. Fujishima and K. Honda, Nature, 1972, 238, 37–38 CrossRef CAS.
- Z. Futera and N. J. English, J. Chem. Phys., 2016, 145, 204706 CrossRef.
- J. L. Munholland, K. G. Mumford and B. H. Kueper, J. Contam. Hydrol., 2016, 184, 14–24 CrossRef CAS.
- B. O'Regan and M. Grätzel, Nature, 1991, 353, 737–740 CrossRef.
- M. Atilhan and S. Aparicio, J. Phys. Chem. B, 2017, 121, 221–232 CrossRef CAS.
- H. Ren, L. Zhang, X. Li, Y. Li, W. Wu and H. Li, Phys. Chem. Chem. Phys., 2015, 17, 23460–23467 RSC.
- X. Li, H. Li and G. Yang, J. Colloid Interface Sci., 2017, 501, 54–59 CrossRef CAS.
- Y. Wang, B. Liao, L. Qiu, D. Wang and Q. Xue, Int. J. Heat Mass Transfer, 2019, 128, 1218–1228 CrossRef.
- Z. Futera and N. J. English, J. Phys. Chem. C, 2016, 120, 19603–19612 CrossRef CAS.
- Z. Futera and N. J. English, J. Chem. Phys., 2017, 147, 031102 CrossRef.
- F. Song, L. Ma, J. Fan, Q. Chen, G. Lei and B. Q. Li, Phys. Chem. Chem. Phys., 2018, 20, 11987–11993 RSC.
- F. Song, L. Ma, J. Fan, Q. Chen, L. Zhang and B. Q. Li, Nanomaterials, 2018, 8, 340 CrossRef.
- D. Y. Zong, Z. Yang and Y. Y. Duan, Appl. Therm. Eng., 2017, 122, 71–79 CrossRef CAS.
- X. Gao, T. Zhao and Z. Li, Phys. Rev. E: Stat., Nonlinear, Soft Matter Phys., 2015, 92, 023017 CrossRef.
- H. Zhang, B. Liu, M. S. Wu, K. Zhou and A. W. K. Law, Comput. Mater. Sci., 2017, 131, 100–107 CrossRef CAS.
- D. Zong, H. Hu, Y. Duan and Y. Sun, J. Phys. Chem. B, 2016, 120, 4818–4827 CrossRef CAS.
- R. Srivastava, J. K. Singh and P. T. Cummings, J. Phys. Chem. C, 2012, 116, 17594–17603 CrossRef CAS.
- B. Rotenberg, V. Marry, R. Vuilleumier, N. Malikova, C. Simon and P. Turq, Geochim. Cosmochim. Acta, 2007, 71, 5089–5101 CrossRef CAS.
- G. Odriozola and F. D. Guevara-Rodriguez, Langmuir, 2004, 20, 2010–2016 CrossRef CAS.
- M. Chávez-Páez, K. Van Workum, L. de Pablo and J. J. de Pablo, J. Chem. Phys., 2001, 114, 1405–1413 CrossRef.
- D. Liu, P. Yuan, H. Liu, T. Li, D. Tan, W. Yuan and H. He, Appl. Clay Sci., 2013, 85, 25–30 CrossRef CAS.
- A. Kadoura, A. K. Narayanan Nair and S. Sun, Microporous Mesoporous Mater., 2016, 225, 331–341 CrossRef CAS.
- A. Merkel, R. Fink and R. Littke, Int. J. Coal Geol., 2015, 147–148, 1–8 CrossRef CAS.
- Q. Li, X. Li, S. Yang, P. Gu and G. Yang, ACS Omega, 2019, 4, 5932–5936 CrossRef CAS.
- N. K. Karna, A. Rojano Crisson, E. Wagemann, J. H. Walther and H. A. Zambrano, Phys. Chem. Chem. Phys., 2018, 20, 18262–18270 RSC.
- D. L. Bish, Clays Clay Miner., 1989, 37, 289–296 CrossRef CAS.
- G. Ciccotti, M. Ferrario and C. Schuette, Entropy, 2014, 16, 233 CrossRef.
- R. T. Cygan, J. J. Liang and A. G. Kalinichev, J. Phys. Chem. B, 2004, 108, 1255–1266 CrossRef.
- Y. D. Wang, B. Liao, Z. Y. Kong, Z. G. Sun, L. Qiu and D. S. Wang, Energy Fuels, 2018, 32, 11440–11451 CrossRef CAS.
- Y. Wang, B. Liao, Z. Kong, Z. Sun, L. Qiu and D. Wang, Energy Fuels, 2018, 32, 11440–11451 CrossRef CAS.
- S. Plimpton, J. Comput. Phys., 1995, 117, 1–19 CrossRef CAS.
- D. J. Evans and B. L. Holian, J. Chem. Phys., 1985, 83, 4069–4074 CrossRef CAS.
- Y. Okuno, M. Minagawa, H. Matsumoto and A. Tanioka, J. Mol. Struct.: THEOCHEM, 2009, 904, 83–90 CrossRef CAS.
- D. Argyris, D. R. Cole and A. Striolo, J. Phys. Chem. C, 2009, 113, 19591–19600 CrossRef CAS.
- H. J. Dong, J. H. Yang and S. J. Mu, Chem. Phys., 1999, 244, 331–337 CrossRef.
| This journal is © The Royal Society of Chemistry 2019 |

