 Open Access Article
Rational design of MgF2 catalysts with long-term stability for the dehydrofluorination of 1,1-difluoroethane (HFC-152a)†
Haodong Tang*a,
Mingming Dangb,
Yuzhen Lia,
Lichun Li *b,
Wenfeng Hana,
Zongjian Liub,
Ying Li
 a and
Xiaonian Lia
aInstitute of Industrial Catalysis, Zhejiang University of Technology, Hangzhou, 310014, PR China. E-mail: tanghd@zjut.edu.cn; lichunli@zjut.edu.cn
bCollege of Chemical Engineering, Zhejiang University of Technology, Hangzhou, 310014, PR China
First published on 30th July 2019
Abstract
In this study, three different approaches, i.e. the sol–gel method, precipitation method and hard-template method, were applied to synthesize MgF2 catalysts with improved stability towards the dehydrofluorination of hydrofluorocarbons (HFCs); the in situ XRD technique was employed to investigate the relationship between the calcination temperature and the crystallite size of precursors to determine optimal calcination temperature for the preparation of the MgF2 catalysts. Moreover, the physicochemical properties of MgF2 catalysts were examined via BET, XRD, EDS and TPD of NH3 and compared. Undoubtedly, the application of different methods had a significant influence on the surface properties and catalytic performances of MgF2 catalysts. The surface areas of the catalysts prepared by the precipitation method, sol–gel method and template method were 120, 215 and 304 m2 g−1, respectively, upon calcination at 200 °C. However, the surface area of the MgF2 catalysts decreased significantly when the calcination temperatures of 300 and 350 °C were applied. The catalytic performance of these catalysts was evaluated via the dehydrofluorination of 1,1-difluoroethane (HFC-152a). The MgF2 catalyst prepared by the precipitation method showed the lowest catalytic activity among all the MgF2 catalysts. When the calcination temperature was above 300 °C, the MgF2 catalysts prepared via the template method demonstrated the highest catalytic conversion rate with catalytic activity following the order: MgF2-T (template method) > MgF2-S (sol–gel method) > MgF2-P (precipitation method). The conversion rate generally agreed with the total amount of acid on the surface of the catalysts, which was measured by the NH3-TPD technique. The MgF2-T catalysts were further examined for the dehydrofluorination of HFC-152a for 600 hours, and a conversion rate greater than 45% was maintained, demonstrating superior long-term stability of these catalysts.
1 Introduction
Polyvinyl fluoride (PVF) is a widely used polymeric material because of its outstanding resistance to weathering, chemically inert nature, suitable mechanical strength, low permeability and light transmittance.1,2 PVF has been commonly applied in packaging, glazing and electrical applications; the production of vinyl fluoride (VF) is rather important as it is the raw chemical material for the synthesis of PVF. The dehydrofluorination of 1,1-difluoroethane (HFC-152a) is the most broadly used chemical process for the production of VF. The dehydrofluorination of hydrofluorocarbons (HFCs) is generally accepted to be thermodynamically and kinetically hindered.3,4 Hence, it is essential to employ highly effective catalysts to accelerate the reaction rate and improve the yield of the target product. Currently, the commonly used catalysts for the dehydrofluorination of hydrofluorocarbons (HFCs) are Lewis acid catalysts including chromia5–7 and alumina5,8-based catalysts. However, the chromia and alumina-based catalysts often suffer from short lifetime as they get deactivated from coking on the strong Lewis acid offered by the catalysts. Zhu et al. have reported the application of porous alumina (Al2O3) as a catalyst for the dehydrofluorination of 1,1,1,2-tetrafluoroethane and demonstrated that strong Lewis acid sites are responsible for the deactivation of catalysts due to coke formation.8 As reported by Luo et al.,6 the catalytic dehydrofluorination of 1,1,1,3,3-pentafluoropropane was investigated using Cr2O3 as a catalyst. The results showed that the conversion rate of the Cr2O3 catalyst significantly decreased from 68% to 23% after a 10 hour test, and the addition of NiO benefited the stability of the catalyst. Due to its high strength, the Lewis acid certainly acts as an active site and offers high conversion rate; however, it also increases the chances of catalyst deactivation.On the other hand, magnesium fluoride (MgF2) nanoparticles have been widely applied as supporting materials and heterogeneous catalysts because they contain medium-strength Lewis acids, which are less likely to get deactivated due to coking;5,9–11 MgF2 typically exists in the rutile form where each Mg2+ ion is surrounded by six F− ions and each F− ion is surrounded by three Mg2+ ions.12,13 A typical MgF2 crystal does not contain any acid property and exists in the form of a neutral solid. Therefore, the manipulation of the synthesis method offers an intelligent way to modify the surface property and create a surface disordered MgF2 material to produce medium-strength Lewis acid sites on the surface. This can be explained by the Tanabe model where the surface acidity of MgF2 is generated from the excessive positive charge caused by the coordinated unsaturated Mg2+ ions on the surface;14 the generation of high surface area is often accompanied by the production of large amount of acid sites;15 therefore, significant research efforts have been focused on the synthesis of high-surface area MgF2 (HS-MgF2).16–23 Kemnitz et al.17 have successfully synthesized amorphous nano-sized MgF2 with the high surface area of 150–350 m2 g−1 via a non-aqueous fluorolytic sol–gel method. The results of the analysis of temperature-programmed desorption of ammonia (NH3-TPD) showed that the strong acid sites disappeared when the catalysts were pre-treated at 300 °C, and above this temperature, the structure of HS-MgF2 would probably be affected. The microemulsion route was also applied as another effective method to synthesise HS-MgF2.22,23 Saberi et al.13 have prepared HS-MgF2 with the surface area of 190 m2 g−1 and the average crystallite size of 9–11 nm via the microemulsion route. However, it was challenging to remove the microemulsion agent.
Despite all these promising efforts towards the synthesis of HS-MgF2, to date, the MgF2 catalysts still suffer from deactivation caused by the aggrandizement of particle size at evaluated temperatures. The main purposes of this study were to rationally design and manufacture the surface properties of MgF2 as they govern the catalytic performance of the catalyst. In this study, three different synthesis methods, i.e. the precipitation method, aqueous sol–gel method and hard template method, were attempted to synthesize MgF2. The in situ XRD technique was first applied to examine the effect of calcination temperature on the MgF2 size. Moreover, three calcination temperatures, i.e. 200, 300 and 350 °C, were selected and used in each synthesis method to further evaluate the influence of calcination temperature on catalyst properties. The nine MgF2 samples prepared using three synthesis methods and three calcination temperatures were examined via Brunauer–Emmett–Teller (BET), X-ray powder diffraction (XRD) and NH3-TPD techniques to reveal the surface properties of these samples. The dehydrofluorination of 1,1-difluoroethane (HFC-152a) was employed as a probe reaction to test the catalytic performance of the MgF2 catalysts. The surface acidic property was further employed to rationalize the catalytic performance of the MgF2 catalysts.
2 Materials and methods
Chemicals
Mg(AC)2 (AR grade, Sinopharm Chemical Reagent Co., Ltd), NH4F (AR grade, Sinopharm Chemical Reagent Co., Ltd), SP-15 (Hangzhou Wanjing Chemical Reagent Co., Ltd), and HF (40 wt%, Quzhou Juhua Reagents Co., Ltd.) were used as obtained without further purification. 1,1-Difluoroethane (HFC-152a, 99.0%) was purchased from Zhejiang Juhua Group Company.Preparation of catalysts
![[thin space (1/6-em)]](https://www.rsc.org/images/entities/char_2009.gif) :
:![[thin space (1/6-em)]](https://www.rsc.org/images/entities/char_2009.gif) Mg was controlled to be 2
Mg was controlled to be 2![[thin space (1/6-em)]](https://www.rsc.org/images/entities/char_2009.gif) :
:![[thin space (1/6-em)]](https://www.rsc.org/images/entities/char_2009.gif) 1. The resulting gel solution was aged for 3 hours before filtration for three times. The generated residue was dried in an oven for 12 hours at 100 °C. The dry paste was then calcined for 4 hours at 200, 300 and 350 °C under an air atmosphere. The obtained product was labelled as MgF2-P.
1. The resulting gel solution was aged for 3 hours before filtration for three times. The generated residue was dried in an oven for 12 hours at 100 °C. The dry paste was then calcined for 4 hours at 200, 300 and 350 °C under an air atmosphere. The obtained product was labelled as MgF2-P.![[thin space (1/6-em)]](https://www.rsc.org/images/entities/char_2009.gif) :
:![[thin space (1/6-em)]](https://www.rsc.org/images/entities/char_2009.gif) 1) of 40 wt% HF solution followed by stirring for 1 hour until a clear gel was formed. The resulting gel mixture was subjected to aging for 3 hours at room temperature and then dried overnight under vacuum at 70 °C. The dried samples were calcined for 4 hours at 200, 300 and 350 °C. The obtained product was labelled as MgF2-S.
1) of 40 wt% HF solution followed by stirring for 1 hour until a clear gel was formed. The resulting gel mixture was subjected to aging for 3 hours at room temperature and then dried overnight under vacuum at 70 °C. The dried samples were calcined for 4 hours at 200, 300 and 350 °C. The obtained product was labelled as MgF2-S.Characterisation
The surface area of the catalysts was examined using N2 gas sorption via the Micromeritics ASAP 2000 instrument at −196 °C. The samples were degassed at 120 °C for 6 hours before each measurement. The surface area was evaluated by the Brunauer–Emmett–Teller (BET) method using the adsorption data. Pore size distributions were obtained from the adsorption branches via a nonlocal density functional theory (NLDFT) method. The pore volume was approximated at the relative pressure P/P0 of 0.99.X-ray powder diffraction (XRD) characterization was conducted using the X'pert PRO diffractometer with Cu Kα radiation (40 kV and 100 mA) in the range of 10° ≤ 2θ ≤ 80°. The as-prepared MgF2 catalysts were evaluated before and after the dehydrofluorination reaction of HFC-152 using the XRD technique.
The in situ XRD characterization was performed using the same instrument under the same conditions with temperature ranging from 25 to 400 °C, which was controlled via a thermocouple in the presence of a H2 atmosphere. The MgF2 samples prepared by the precipitation, sol–gel, and template methods before calcination were examined via the in situ XRD technique at temperatures between 25 and 400 °C.
The temperature-programmed desorption of ammonia (NH3-TPD) was used to reveal the distribution and strength of the acid sites on the catalysts. The MgF2 sample (about 0.15 g) was first degassed by heating at 300 °C for 30 minutes under an argon atmosphere. After being gently cooled down to room temperature, the catalyst was exposed to a gas mixture containing 10% of NH3 and 90% of He for 30 minutes. The TPD program was started (10 °C min−1 up to 850 °C) after the excess amount of NH3 was flushed out under N2 at 100 °C. The amount of desorbed NH3 was continuously monitored via online mass spectrometry.
Energy dispersive spectrometry (EDS) analysis was performed using the HITACHI 7700 microscope at the accelerating voltage of 100 kV.
Catalytic performance
The MgF2 catalysts were applied for the dehydrofluorination of HFC-152 to evaluate the catalytic performance of the catalysts prepared using different synthesis methods and calcination temperatures. The dehydrofluorination reaction of HFC-152 is shown in eqn (1).
CH3CHF2 → CH2![[double bond, length as m-dash]](https://www.rsc.org/images/entities/char_e001.gif) CHF + HF CHF + HF
| (1) |
In a typical experiment, about 2.0 mL of the catalyst was packed in the Nickel-iron-chromium alloy tube flow reactor with the flowing mixed gases of HFC-152 (∼25 mL min−1) and N2 (20 mL min−1). The reaction was performed at 200, 300 and 350 °C under atmospheric conditions. The component of the gas phase was monitored by a gas chromatography instrument (GC16900) equipped with the TCD analyzer.
3 Results and discussion
In situ XRD
Fig. 1 shows the in situ XRD patterns of the pre-calcined MgF2-S, MgF2-T, and MgF2-P catalysts obtained under a H2 atmosphere with temperature ranging from 25 to 450 °C. The distinct advantage of the in situ XRD measurement is that it eliminates the multiple XRD measurements of the MgF2 samples calcined at different temperatures, which are time and effort consuming; herein, the MgF2 samples examined via the in situ XRD measurements are not exactly the same as the actual catalysts as they have typically undergone a calcination process at a certain temperature for 4 hours under a N2 atmosphere. The purpose of the in situ XRD measurements was to rationalize the relationship between the calcination temperature and the size of the MgF2 crystallite to confirm that temperature played an important role in the crystallite size and select optimal temperature for the synthesis of the MgF2 catalysts.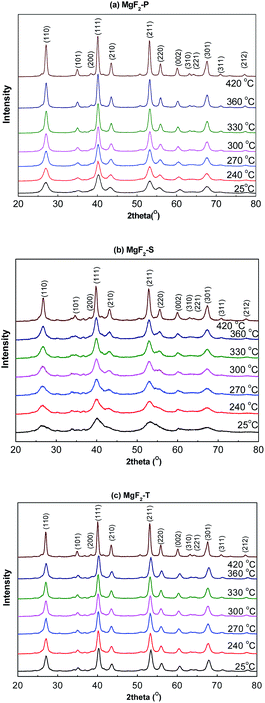 | ||
| Fig. 1 In situ XRD patterns of the MgF2 catalysts MgF2-P (a), MgF2-S (b), and MgF2-T (c) catalysts at calcination temperatures varying from 25 to 450 °C. | ||
The different planes of the MgF2 crystallite with corresponding diffraction peaks are shown in Fig. 1(a)–(c). This validated that all the preparation methods could successfully produce MgF2 catalysts.
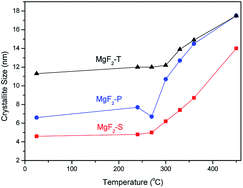
It is also clear that with the increasing temperature, all the diffraction peaks become sharp at full-width-at-half maxima; this indicates the growth of MgF2 crystallites. To further investigate the effect of temperature on crystallite size, the Scherrer equation was employed to calculate the average crystallite size of MgF2 based on the diffraction peak at 40.12° representing the (111) plane of the MgF2 crystallite in the in situ XRD patterns shown in Fig. 1. The average MgF2 crystal size as a function of temperature is plotted in Fig. 2.
As can be concluded from Fig. 2, there is no significant change in the average crystal size of MgF2 when the treatment temperature is below 300 °C, whereas the crystal size increases significantly when the temperature increases up to 300 °C and above. Therefore, it can be concluded that the crystal size is very sensitive to the treatment temperature; this is of significant use for the rational optimization of the calcination temperature during the synthesis of the MgF2 catalysts. Hence, three calcination temperatures were selected and used for the preparation of MgF2 catalysts: 200, 300 and 350 °C. In addition, the crystal size generally followed the trend MgF2-T > MgF2-P > MgF2-S at all temperatures.
Characterization of the MgF2 catalysts
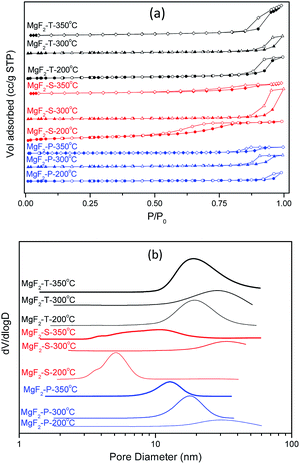
The MgF2 catalysts synthesized via different methods using three different calcination temperatures certainly exhibited different surface properties including surface area, pore structure, crystal size as well as surface acid properties. The N2 adsorption/desorption isotherms together with the pore size distribution for the nine MgF2 samples are shown in Fig. 3.All the MgF2 catalysts synthesized using different methods and calcination temperatures belong to the type IV isotherm and H1 hysteresis loop, indicating the existence of a mesoporous structure. All the MgF2 samples possess inter-particular voids with an exception of MgF2-S-200 °C that possesses an intra-particular mesoporous property. The surface area and the average pore size of all the catalysts are listed in Table 1. The surface area generally decreased with an increase in calcination temperature for all three different preparation methods. When the calcination temperature was 200 °C, high-surface area MgF2 (HS-MgF2) catalysts were successfully prepared with the surface area following the trend: MgF2-T (304 m2 g−1) > MgF2-S (215 m2 g−1) > MgF2-P (120 m2 g−1). With an increase in calcination temperature, the surface area decreased dramatically in all cases. For example, the surface area of the MgF2 catalysts prepared using the hard template method decreased from 304 m2 g−1 to 24 m2 g−1 when the calcination temperature was increased from 200 to 350 °C. This observation shows a good agreement with the open literature that calcination at high temperatures causes a decrease in the surface area of MgF2.17 The average pore size of all the MgF2 catalysts is mainly in the range from 5 to 33 nm, indicating the mesoporous nature of all catalysts. Moreover, the MgF2 crystallite size increases notably with an increase in the calcination temperature; this agrees well with the in situ XRD results. This verifies the application of the in situ XRD technique for the intelligent selection of catalysts calcination temperature.
| Catalyst | Surface areaa (m2 g−1) | Pore sizea (nm) | Crystal sizeb (nm) | |
|---|---|---|---|---|
| a Calculated from the nitrogen physical desorption isotherm.b Calculated from the XRD results employing the Debye–Scherrer equation. | ||||
| MgF2-P | 200 °C | 120 | 30 | 82 |
| 300 °C | 63 | 18 | 142 | |
| 350 °C | 20 | 12 | 226 | |
| MgF2-T | 200 °C | 304 | 19 | 163 |
| 300 °C | 97 | 28 | 191 | |
| 350 °C | 24 | 18 | 217 | |
| MgF2-S | 200 °C | 215 | 5 | 67 |
| 300 °C | 46 | 33 | 91 | |
| 350 °C | 22 | 10 | 196 | |
NH3-TPD analysis
The temperature-programmed desorption of ammonia (NH3-TPD) was employed to reveal the surface acidic properties of the MgF2 catalysts. In general, the NH3 desorption peak is a measure of the strength of the acid sites in the catalyst, whereas the area of the desorption peak is an indication of the amount of acid. The NH3-TPD results of the MgF2-S, MgF2-T, and MgF2-P catalysts calcined at 200 °C (a), 300 °C (b) and 350 °C (c) are shown in Fig. 4.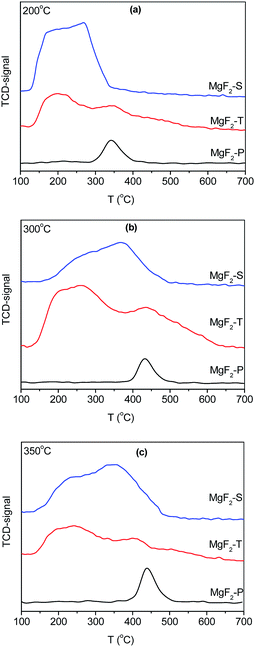 | ||
| Fig. 4 NH3-TPD results of MgF2-S, MgF2-T, and MgF2-P catalysts calcined at 200 °C (a), 300 °C (b) and 350 °C (c). | ||
To distinguish between the medium and high-strength acid sites in the catalysts, the desorption of NH3 at a temperature less than 350 °C is attributed to the presence of medium-strength acid sites, whereas the desorption of NH3 at a temperature greater than 350 °C is ascribed to the presence of high-strength acid sites on the catalysts. The amount of acid desorbed at 350 °C for the MgF2-P-200 °C sample was normalized to 1. Following this, the amount of the medium, strong and total amount of acid sites on the surface of the MgF2 catalysts was calculated, and the results are presented in Table 2.
| MgF2-P | MgF2-T | MgF2-S | |||||||
|---|---|---|---|---|---|---|---|---|---|
| 200 °C | 300 °C | 350 °C | 200 °C | 300 °C | 350 °C | 200 °C | 300 °C | 350 °C | |
| Med. | 0.0 | 0.0 | 0.0 | 1.2 | 4.2 | 1.4 | 4.8 | 1.4 | 1.0 |
| Str. | 1.1 | 1.1 | 1.0 | 1.8 | 4.3 | 1.1 | 0.0 | 2.6 | 2.8 |
| Total | 1.1 | 1.1 | 1.0 | 3.0 | 8.5 | 2.4 | 4.8 | 4.0 | 3.8 |
Note that the total amount of acid decreases when the calcination temperature increases from 300 to 350 °C; this confirms the conclusion reported by Kemnitz et al.17 that the acidity of MgF2 gradually diminishes upon heating; however, for the MgF2 samples prepared by the precipitation method, the amount of acid does not change significantly with only minor changes in the NH3 desorption temperature. For the MgF2-P catalysts, the NH3 desorption peaks appeared at ∼350 °C upon calcination at 200 °C, whereas the NH3 desorption peaks appeared at ∼450 °C upon calcination at 300 and 350 °C. MgF2-P exhibited lowest amount of acid because it did not have enough surface defects to provide acid sites; moreover, the relatively stable structure of MgF2-P with low surface defects did not experience a significant change at different calcination temperatures, which contributed to the relatively uniform amount of acid at different calcination temperatures. It can also be observed from Table 2 that the lowest total amount of acid can be observed on the surface of MgF2 prepared via the precipitation method. The total amount of acid follows the order: MgF2-S > MgF2-T > MgF2-P at 200 and 300 °C and MgF2-T > MgF2-S > MgF2-P at 350 °C.
Catalytic reactivity
The MgF2 catalysts synthesized via three different approaches at three calcination temperatures were applied for the production of VF via the dehydrofluorination of HFC-152a.The temperature employed for the dehydrofluorination of HFC-152a was kept the same as the calcination temperature of the catalyst. The dehydrofluorination reaction of CF2HCH3 (HFC-152a) in this study exhibited almost 100% selectivity towards the target product CH2![[double bond, length as m-dash]](https://www.rsc.org/images/entities/char_e001.gif) CHF under the reaction conditions applied herein with the MgF2 catalysts. This observation agrees well with the results reported in the open literature where the reaction of CH2FCF3 (ref. 8) and HFC-152a (ref. 7) over Lewis acid catalysts shows almost 100% selectivity towards the dehydrofluorination product. As can be observed from Fig. 5, the conversion rate generally increases with the increasing temperature, which agrees well with literature.7 The conversion rate was between 8% and 20% at 200 °C, between 35% and 55% at 300 °C, and between 55% and 85% at 350 °C. The conversion rate at 350 °C was comparable to that obtained using chromia-based catalysts (Cr2O3) in the dehydrofluoriation of HFC-152a in our previous study.7
CHF under the reaction conditions applied herein with the MgF2 catalysts. This observation agrees well with the results reported in the open literature where the reaction of CH2FCF3 (ref. 8) and HFC-152a (ref. 7) over Lewis acid catalysts shows almost 100% selectivity towards the dehydrofluorination product. As can be observed from Fig. 5, the conversion rate generally increases with the increasing temperature, which agrees well with literature.7 The conversion rate was between 8% and 20% at 200 °C, between 35% and 55% at 300 °C, and between 55% and 85% at 350 °C. The conversion rate at 350 °C was comparable to that obtained using chromia-based catalysts (Cr2O3) in the dehydrofluoriation of HFC-152a in our previous study.7
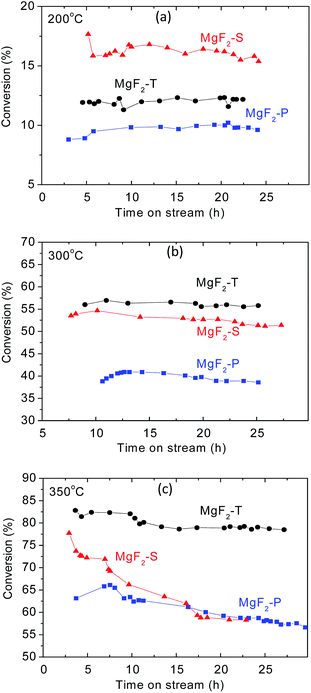 | ||
| Fig. 5 Conversion rate as a function of time on stream for three MgF2 catalysts, including MgF2-S, MgF2-T, and MgF2-P at 200 °C (a), 300 °C (b) and 350 °C (c). | ||
MgF2 prepared via the precipitation method showed the lowest conversion rate at all three temperatures. At 200 °C, the conversion rate follows the order: MgF2-S > MgF2-T > MgF2-P. This agrees well with the trend of the total amount of acid on the surface of the catalysts as surface acids contribute to the active sites for the dehydrofluorination reaction. For the reaction temperature above 300 °C, MgF2 prepared via the hard template method demonstrates the best conversion rate with all the conversion rates following the order: MgF2-T > MgF2-S > MgF2-P. Note that the conversion rate obtained using the MgF2 catalysts synthesized using the hard template method outperformed that obtained using the MgF2 catalysts synthesized using the sol–gel method when the calcination temperature was greater than 300 °C. For the conversion rate at 300 °C, the order matches with the amount of acid on the surface of the MgF2 catalysts prepared by different preparation methods. It can also be observed in Fig. 5(b) that the MgF2-T catalyst demonstrates the best stability with no obvious decrease in the conversion rate after 25 hours of reaction. However, with same time span, there is somehow a slight decrease in the conversion rate in the case of both MgF2-S and MgF2-P catalysts. In other words, MgF2-T demonstrates the best stability among all three catalysts at 300 °C.
For the catalytic performance at 350 °C, as shown in Fig. 5(c), the MgF2-T catalyst exhibits the best conversion rate and stability among all three MgF2 catalysts. However, as shown in Table 2, there is more relative amount of acid on the surface of the MgF2-S catalyst than that on the MgF2-T catalyst; this is not exactly consistent with the overall conversion rate shown in Fig. 5(c). This discrepancy is likely due to the fact that the MgF2-S catalyst deactivates very quickly when exposed to high temperatures. The conversion rates of the MgF2-T catalyst in the initial three hours were determined and are shown in Fig. S1, ESI,† demonstrating its intense deactivation rate with a decrease in the conversion rate from ∼81.8% to 77.5% in the initial 2.5 hours; after reaction for ∼30 hours, the conversion rate upon the MgF2-T catalyst still remains at ∼80%, which is only about 5% less than the initial conversion rate. Note that this catalytic performance is comparable to that obtained using the chromia-based Lewis acid catalysts reported in open literature.7 However, the conversion rate of both MgF2-S and MgF2-P catalysts declined substantially to about 57% during the reaction within same time span. To further investigate the reason for the deactivation of the MgF2 catalysts, XRD and EDS techniques were employed to measure the crystal size and surface carbon content of the MgF2-T, MgF2-S, and MgF2-P catalysts before and after reaction for ∼30 hours at 350 °C. The results are listed in Table 3. As can be observed from Table 3, there are no major changes between the surface carbon contents of the as-prepared and post-reaction MgF2 catalysts. Thus, coking can be excluded from the main reasons accounting for the deactivation of the MgF2-S and MgF2-P catalysts. On the other hand, the crystal size of the MgF2 synthesised via the sol–gel method and precipitation method increased significantly from below 10 nm to ∼20 nm. This is consistent with the in situ XRD results stating that the size of the MgF2 crystal increases drastically with the increasing temperature. This is probably the main reason why the MgF2-S and MgF2-P catalysts easily deactivate than MgF2-T at high temperatures.
Stability performance
The MgF2-T-300 °C catalysts were further examined for about 600 hours for the dehydrofluorination reaction of HFC-152a to test the stability and lifetime of the catalysts, which are shown in Fig. 6(a). The conversion rate of the MgF2-S catalyst shows good stability as it remains greater than 45% at the reaction time of 600 hours. To the best of our knowledge, the longest reaction time reported in the open literature is 100 hours using Cr2O3-based catalysts.7 The MgF2 catalysts reported in this study have certainly demonstrated superior stability as catalysts for the dehydrofluorination of HFCs.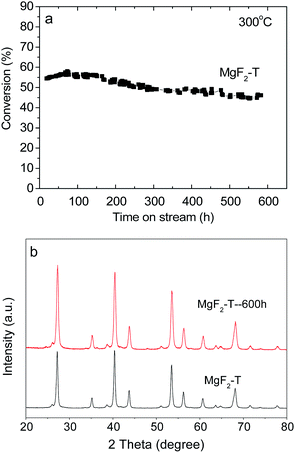 | ||
| Fig. 6 (a) Conversion rate of the MgF2-T catalyst as a function of reaction time at 300 °C and (b) XRD patterns of the MgF2-T catalyst before and after the reaction. | ||
The XRD patterns were obtained for the MgF2-T-300 °C catalyst before and after the 600 hour test to evaluate the changes in the crystal size of the catalyst, as shown in Fig. 6(b). As can be observed in Fig. 6(b), there are no significant changes in the diffraction peaks before and after the reaction with only a minor increase in the intensity of the peaks. The crystal size in the (111) plane of MgF2 was calculated applying the Scherrer equation. The crystal size increased from ∼19.1 nm to ∼22.9 nm after the 600 hour test. This minor increase in the crystal size is probably the reason why the MgF2 catalysts prepared via the template method demonstrate superior long-term stability throughout the 600 hour test at 300 °C. In addition, the surface carbon content of the MgF2-T catalyst after the 600 hour reaction was examined via the EDS technique. The surface carbon content of the MgF2-T catalyst after the 600 h reaction was revealed to be 4.74%, demonstrating only minor changes from the initial carbon content before reaction (3.88%). This indicates that the MgF2-T catalyst has high resistance towards coking when applied as a catalyst for the dehydrofluorination of HFC-152a at 350 °C.
4 Conclusions
To manipulate the surface property and rationally design the catalytic performance of MgF2 catalysts, three synthesis methods were used and compared in the current study. The in situ XRD results showed that the crystal size increased dramatically when the calcination temperature was greater than 300 °C. Moreover, three temperatures, i.e. 200 °C, 300 °C and 350 °C, were investigated to further evaluate the effect of calcination temperature on the surface properties of the catalysts. At the calcination temperature of 200 °C, high-surface area MgF2 catalysts were generated via all preparation methods, whereas at a calcination temperature greater than 200 °C, the surface area decreased significantly; this agreed well with the in situ XRD results. The catalytic performance of the catalysts followed the order: MgF2-S > MgF2-T > MgF2-P at 200 °C, whereas it was MgF2-T > MgF2-S > MgF2-P at 300 and 350 °C. The order of the catalytic performance generally agreed with the total amount of acid measured by the NH3-TPD technique. Among the MgF2 catalysts prepared via different methods, the MgF2 catalysts synthesized via the hard template method demonstrated best stability for the dehydrofluorination of HFC-152a. Moreover, the MgF2-T-300 °C catalyst was successfully applied for the dehydrofluorination of HFC-152a for 600 hours, and the conversion rate remained greater than 45%, showing the superior long-term stability of this catalyst.Conflicts of interest
There are no conflicts to declare.Acknowledgements
The authors acknowledge the financial support received from the Zhejiang Natural Science Foundation, LY19B060009.References
- J. K. Murthy, U. Groß, S. Rüdiger, E. Ünveren and E. Kemnitz, J. Fluorine Chem., 2004, 125, 937–949 CrossRef CAS.
- S. Ebnesajjad and L. G. Snow, Poly(vinyl fluoride), in Encyclopedia of Chemical Technology, ed. J. I. Kroschwitz, Wiley, New York, 4th edn, 1994, vol. 11, pp. 683–694 Search PubMed.
- A. W. Baker, D. Bonniface, T. M. Klapötke, I. Nicol, J. D. Scott, W. D. S. Scott, R. R. Spence, M. J. Watson, G. Webb and J. M. Winfield, J. Fluorine Chem., 2000, 102, 279–284 CrossRef CAS.
- A. Kohne and E. Kemnitz, J. Fluorine Chem., 1995, 75, 103–110 CrossRef CAS.
- G.-L. Li, H. Nishiguchi, T. Ishihara, Y. Moro-oka and Y. Takita, Appl. Catal., B, 1998, 16, 309–317 CrossRef CAS.
- J.-W. Luo, J.-D. Song, W.-Z. Jia, Z.-Y. Pu, J.-Q. Lu and M.-F. Luo, Appl. Surf. Sci., 2018, 433, 904–913 CrossRef CAS.
- W. Han, X. Li, H. Tang, Z. Wang, M. Xi, Y. Li and H. Liu, J. Nanoparticle Res., 2015, 17, 365 CrossRef.
- W. Jia, W. Qian, X. Lang, H. Chao, G. Zhao, J. Li and Z. Zhu, Catal. Lett., 2015, 145, 654–661 CrossRef CAS.
- M. Wojciechowska, J. Bartoszewicz and J. Goslar, ChemInform, 1995, 26, 2207–2211 Search PubMed.
- A. Malinowski, W. Juszczyk, J. Pielaszek, M. Bonarowska, Z. Karpiński and M. Wojciechowska, Chem. Commun., 1999, 8, 685–686 RSC.
- M. Wojciechowska, M. Pietrowski, S. Lomnicki and B. Czajka, Catal. Lett., 1997, 46, 63–69 CrossRef CAS.
- W. H. Baur and A. A. Khan, Acta Crystallogr., Sect. B: Struct. Crystallogr. Cryst. Chem., 2010, 27, 2133–2139 CrossRef.
- A. Saberi, Z. Negahdari, S. Bouazza and M. Willert-Porada, J. Fluorine Chem., 2010, 131, 1353–1355 CrossRef CAS.
- E. Kemnitz, Y. Zhu and B. Adamczyk, J. Fluorine Chem., 2002, 114, 163–170 CrossRef CAS.
- E. Kemnitz and S. Rüdiger, High Surface Area Metal Fluorides as Catalysts, 2010 Search PubMed.
- I. Agirrezabal-Telleria, F. Hemmann, C. Jäger, P. L. Arias and E. Kemnitz, J. Catal., 2013, 305, 81–91 CrossRef CAS.
- J. Krishna Murthy, U. Groß, S. Rüdiger, E. Kemnitz and J. M. Winfield, J. Solid State Chem., 2006, 179, 739–746 CrossRef CAS.
- I. Agirrezabal-Telleria, Y. Guo, F. Hemmann, P. L. Arias and E. Kemnitz, Catal. Sci. Technol., 2014, 4, 1357–1368 RSC.
- A. B. D. Nandiyanto, O. Takashi and O. Kikuo, ACS Appl. Mater. Interfaces, 2014, 6, 4418–4427 CrossRef CAS PubMed.
- M. Chen, J. M. Jin, S. D. Lin, Y. Li, W. C. Liu, L. Guo, L. Li and X. N. Li, J. Fluorine Chem., 2013, 150, 46–52 CrossRef CAS.
- J. Noack, K. Teinz, C. Schaumberg, C. Fritz, S. Rüdiger and E. Kemnitz, J. Mater. Chem., 2010, 21, 334–338 RSC.
- M. Pietrowski, M. Zieliński and M. Wojciechowska, Pol. J. Chem. Technol., 2014, 16, 63–68 CAS.
- A. Saberi, Z. Negahdari, S. Bouazza and M. Willert-Porada, J. Fluorine Chem., 2010, 131, 1353–1355 CrossRef CAS.
Footnote |
| † Electronic supplementary information (ESI) available. See DOI: 10.1039/c9ra04250d |
| This journal is © The Royal Society of Chemistry 2019 |

