DOI:
10.1039/C9RA04218K
(Paper)
RSC Adv., 2019,
9, 40997-41009
The inhibition of mild steel corrosion in 0.5 M H2SO4 solution by radish leaf extract
Received
4th June 2019
, Accepted 16th November 2019
First published on 11th December 2019
Abstract
The inhibitory effect of radish leaf extract (RLE) on mild steel corrosion in 0.5 M H2SO4 was studied by the weight loss method and the electrochemical method. The results demonstrated that the efficiency of inhibition increased with an increase in the concentration of RLE and decreased with an increase in temperature. The inhibition performance reached 93% with 300 mg L−1 at 298 K. RLE behaved as a mixed-type inhibitor based on the cathode. The inhibition mechanism involved the adsorption of the active ingredients of RLE on the mild steel surface to prevent corrosion. The adsorption followed the Langmuir adsorption isotherm, and physical and chemical adsorption coexisted. The results were supported by SEM, quantum chemical calculations, FTIR and UV-visible spectroscopy analyses.
1. Introduction
In general, acid solutions are used to remove rust and scale from the surface of metal equipment, such as water tanks and heat exchangers.1 However, it is well-known that metal-based materials are corroded easily in acidic media. In industries, a popular method to prevent metals from rusting and wastage of acids is to add various corrosion inhibitors. Although these conventional corrosion inhibitors are highly effective, most of them are expensive, difficult to biodegrade, toxic, and even harmful for the environment and human health.2–4 Consequently, researchers have focused on developing non-toxic, cheaper and green natural corrosion inhibitors for the sake of the environment-friendly and economical society.5
Usually, many organic compounds are adsorbed well on the metal surface, and therefore, can be used as good corrosion inhibitors.3 This is due to the fact that most of the effective organic inhibitors contain heteroatoms, such as O, N, and S, and multiple bonds in their molecular structures that act as the adsorption centers.6–8 As we know, natural products are rich in phytochemicals, which contain a number of heteroatoms (O, N, and S) and multiple bonds in their molecular structures, and are potential corrosion inhibitor candidates. Furthermore, these natural products are inexpensive, non-toxic and renewable. Therefore, it would be of great significance to extract organic compounds from different natural sources by simple and low-cost methods instead of using synthetic corrosion inhibitors.9 At present, a lot of natural extracts from different parts of different plants, such as leaves,5,10–13 roots,14–16 seeds,12,17,18 fruits,3,19,20 and flowers,9,21,22 have been reported as corrosion inhibitors with high efficiency.
Raphinus sativus Linn. (Cruciferae) is an aromatic annual herb, which used as food and medicine. However, the utilization rate of radish leaves is very low, which causes a waste of resources. According to reports, the most abundant vitamins in radish leaves are ascorbic acid and folic acid.23–26 Catechin and o-coumaric acid are the most abundant phenolic compounds in the radish leaf extract.27 In light of the structure and mechanism of corrosion inhibitors, it can be inferred that the main organic compounds in radish leaves are potential candidates for corrosion inhibitors. The structures of the main components are shown in Fig. 1. To our knowledge, there is no report on the effect of radish leaf extract on the corrosion inhibition of mild steel in acid medium. If radish leaves are used as a corrosion inhibitor for carbon steel in acid medium, it cannot only recycle the resources and reduce the cost of corrosion inhibitors, but also significantly promote the cultivation of radish. The most important point is that the harm to humans and the environment is very small. In this paper, the corrosion inhibition effect of radish leaf extract on mild steel in 0.5 M H2SO4 was investigated by weight loss and electrochemical methods in the range of 298–328 K. In addition, the mechanism of corrosion inhibition was investigated by means of SEM, quantum chemical calculations, FTIR and UV-visible spectroscopy analyses.
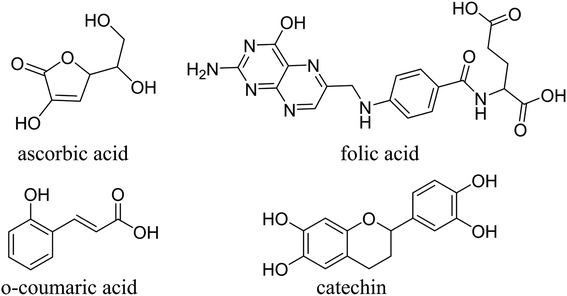 |
| | Fig. 1 Chemical molecular structures of major components in RLE. | |
2. Experimental methods
2.1 Material preparation
The mild steel pieces (20#) contained 0.20 wt% C, 0.42 wt% Mn, 0.25 wt% Cr, 0.30 wt% Ni, 0.21 wt% Si, and 0.25 wt% Cu, and the remainder was iron. The size of each steel piece used for the weight loss test was 50 mm × 25 mm × 20 mm. The working electrodes were installed in epoxy resin with an exposure area of 1 cm2. The specimens were washed with distilled water, degreased with acetone, dried and stored in desiccators prior to use. The test solutions (0.5 M H2SO4) were prepared by diluting 98% H2SO4 with distilled water. All chemicals and reagents were of analytical grade.
2.2 Preparation of RLE
Radish leaves were collected from Kaifeng city, Henan Province. The fresh radish leaves were cleaned with distilled water, dried for 72 h at 333 K, and then ground to powder. Subsequently, the powder (20 g) was soaked in distilled water (2 L) for 48 hours and then subjected to supersonic processing for 40 min. Subsequently, the mixture was filtered, and the filtrate was concentrated in a rotary evaporator and dried in a vacuum oven at 353 K for 24 h. At this time, a brown solid residue (approximately 8 g) was collected. Next, the solid was refluxed in 80% methanol at 353 K for 4 h. Thereafter, the refluxed solution was filtered and concentrated. Finally, it was dried in a vacuum oven at 333 K for 24 h, and the brown solid residue (approximately 2 g) was collected and stored in a desiccator. The chemical molecular structures of the major components in the extract are shown in Fig. 1.
2.3 Weight loss measurements
Weight loss measurements of the mild steel pieces were carried out at different temperatures (298–328 K) in a 0.5 M H2SO4 solution. The washed pieces of mild steel were immersed in 500 mL of the test solutions with various concentrations of RLE for 12 h under a static condition in a thermostated bath. Then, the specimens were taken out, washed, dried, and weighed accurately. For the sake of good reproducibility and accuracy, three parallel experiments were carried out at the same time.
The corrosion rate ν (g m−2 h−1), surface coverage θ and values of efficiency η were calculated from the weight loss measurements using the following equations:4
| |
 | (1) |
| |
 | (2) |
| |
 | (3) |
where Δ
W is the specimen weight loss (mg),
S is the exposed area of the specimen (cm
2),
t is the immersion time (h), and
ν0 and
ν are the corrosion rates in the absence and presence of RLE, respectively.
2.4 Electrochemical measurements
The electrochemical tests were performed in a conventional three-electrode cell assembly using a CHI 660E electrochemical system at 298 K. The platinum electrode was used as the counter electrode, the saturated calomel electrode (SCE) was used as the reference electrode (RE), and the materials used in the working electrodes (WE) were the same as those used in weight loss tests. The WEs were abraded with different grades of abrasive papers (400–2000). Then, they were rinsed with distilled water and degreased with acetone before immersion in the test solutions. Before each electrochemical test, the electrode was immersed in the test solution for 60 min to obtain a stable open-circuit potential (OCP). After measuring the open circuit potential, electrochemical impedance spectroscopy (EIS) and potentiodynamic polarization experiments were carried out. Three parallel experiments were conducted to check the reproducibility of the data.
The anodic and cathode polarization curves were recorded from −250 to +250 mV (vs. OCP) with a scan rate of 1 mV s−1. The inhibition efficiency (η) from the polarization measurement was given by the following equation:3
| |
 | (4) |
where
i0corr and
icorr are the corrosion current densities in the absence and presence of inhibitors, respectively.
Electrochemical impedance spectroscopy (EIS) measurements were performed in the frequency range of 0.01 Hz to 100 kHz with a signal amplitude of 10 mV. The inhibition efficiency η was calculated from the charge transfer resistance values by the following equation:3
| |
 | (5) |
where
R0ct and
Rct are the charge transfer resistances in the absence and presence of inhibitors, respectively.
2.5 UV-visible and FTIR spectroscopy
In order to understand the corrosion inhibition mechanism better, FTIR analysis was carried out for pure RLE, as well as the corrosion products obtained after immersion in 0.5 M H2SO4 containing RLE. The RLE samples were investigated in the region of 400–4000 cm−1 (wavenumbers) with a Vertex 70 spectrophotometer (Bruker optics company, Germany).
The optical characterization of the extract was performed on a TU-1900 ultraviolet spectrometer. The UV spectra of RLE in 0.5 M H2SO4 before and after immersing the mild steel specimens in the solution were obtained. Both these spectra were compared to understand the mechanism of inhibition.
2.6 SEM surface analysis
To understand the corrosion state of the mild steel surface exposed to a 0.5 M H2SO4 solution, mild steel samples were immersed in the 0.5 M H2SO4 solution without and with 300 mg L−1 of RLE for 12 h. Then, the morphology of the mild steel surfaces was observed by a JSM-7800F scanning electron microscope (SEM).
2.7 Theoretical calculations
Quantum chemical calculations were carried out using the Gaussian 09 software. The relationship between the inhibition ability and the electronic structure was studied. The geometrical optimization of the investigated compounds (Fig. 1) was performed using the Density Functional Theory (DFT) in the B3LYP framework with the 6+31G (d,p) basis set implemented in the Gaussian visualization program package.28,29 Theoretical parameters, such as energy gap (ΔE), electronegativity (χ), the energy of the highest occupied and lowest unoccupied molecular orbitals (EHOMO and ELUMO), fraction of electrons transferred (ΔN) and global hardness of molecular (η), were obtained using the following equations:28,29| |
 | (7) |
| |
 | (8) |
| |
 | (9) |
2.8 Biodegradability assessment
2.8.1 Preparation of inoculum. 200 g plant growth soil was dissolved in 2 L distilled water, stirred evenly and allowed to stand for 2 h to obtain the supernatant.
2.8.2 Preparation of buffer solution. 8.5 g KH2PO4, 21.8 g KH2PO4·3H2O, 44.6 g Na2HPO4·12H2O and 1.7 g NH4Cl were dissolved in 1 L distilled water to prepare the phosphate buffer solution. 11.0 g MgSO4 27.6 g CaCl2, and 0.25 g FeCl3·6H2O were dissolved in 1 L distilled water, respectively.
2.8.3 Preparation of dilution water. 1 L distilled water was aerated with an oil-free air pump until the amount of dissolved oxygen reached higher than 8 mg L−1, and 1 mL each of phosphate buffer solution, magnesium sulfate solution, calcium chloride solution and iron chloride solution were added.30 mL of inoculum, 270 mL of dilution water and a certain amount of the substance to be measured were added to a 500 mL serum bottle and placed in a constant temperature incubator at 25 °C. The blank experiment was conducted at the same time. The COD content of the solution in the serum bottle was detected at 1, 7, 14, 21, and 28 days. The biodegradation rate (η) was calculated by the following equation:30
| |
 | (10) |
where
Ct is the COD concentration value of the solution to be tested on day
t,
Cit is the COD concentration value of the solution in the blank group on day
t,
C0 is the COD concentration value of the solution to be tested on day 1, and
Ci0 is the COD concentration value of the solution in the blank group on day 1.
3. Results and discussion
3.1 FTIR spectroscopy
The FTIR spectra of RLE and RLE adsorbed on mild steel are shown in Fig. 2. The band at 3428 cm−1 was attributed to the O–H stretching vibration, and the wider peak width indicated that molecular association had occurred.31 The stretching vibration of C–H was noticed at 2931 cm−1.32 The 1621 cm−1 band was assigned to C![[double bond, length as m-dash]](https://www.rsc.org/images/entities/char_e001.gif) O/C
O/C![[double bond, length as m-dash]](https://www.rsc.org/images/entities/char_e001.gif) N bending.33–35 The absorption at 1388 cm−1 could be the stretching vibration of C–N in the amides.32 The peak at 1058 cm−1 was attributed to the C–O groups.20 These findings indicated that RLE contained nitrogen and oxygen in its functional groups (O–H, C
N bending.33–35 The absorption at 1388 cm−1 could be the stretching vibration of C–N in the amides.32 The peak at 1058 cm−1 was attributed to the C–O groups.20 These findings indicated that RLE contained nitrogen and oxygen in its functional groups (O–H, C![[double bond, length as m-dash]](https://www.rsc.org/images/entities/char_e001.gif) O, C
O, C![[double bond, length as m-dash]](https://www.rsc.org/images/entities/char_e001.gif) N or C–O), which is in agreement with the structures of typical corrosion inhibitors. The FTIR spectrum of the corrosion products on the mild steel surface immersed in a 0.5 M H2SO4 containing 300 mg L−1 RLE is shown in Fig. 2(b), in which the absorption peaks of O–H, C
N or C–O), which is in agreement with the structures of typical corrosion inhibitors. The FTIR spectrum of the corrosion products on the mild steel surface immersed in a 0.5 M H2SO4 containing 300 mg L−1 RLE is shown in Fig. 2(b), in which the absorption peaks of O–H, C![[double bond, length as m-dash]](https://www.rsc.org/images/entities/char_e001.gif) O/C
O/C![[double bond, length as m-dash]](https://www.rsc.org/images/entities/char_e001.gif) N, C–N, C–O–C appeared at 3432 cm−1, 1632 cm−1, 1390 cm−1, 1126 cm−1, respectively.4,21,35,36 These observations suggested that RLE was adsorbed on the surface of mild steel.
N, C–N, C–O–C appeared at 3432 cm−1, 1632 cm−1, 1390 cm−1, 1126 cm−1, respectively.4,21,35,36 These observations suggested that RLE was adsorbed on the surface of mild steel.
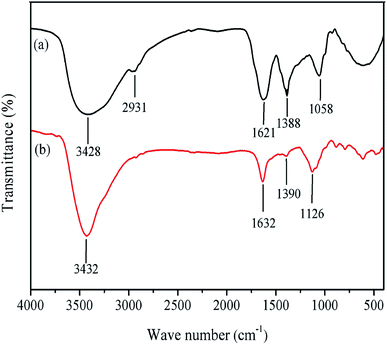 |
| | Fig. 2 FTIR spectra of (a) RLE and (b) RLE adsorbed on mild steel. | |
3.2 UV-visible spectroscopy
Fig. 3 presents the UV-vis spectra of RLE before and after the immersion of mild steel pieces. According to the literature, if the value and position of the maximum absorbance peak changes in the UV-visible spectrum, it means that a complex compound is formed between the two substances in the solution.36 Of the two absorption bands observed in Fig. 3, the absorption band at 200–215 nm was due to the n–σ* and/or π–π* transitions, which characterize the carboxyl, ester, carbonyl and amine groups. The other absorption band around 260–280 nm was attributed to the π–π* electron transitions in the aromatic and poly-aromatic compounds found in most conjugated molecules.37 Compared with the UV-vis spectrum of RLE, both the two absorbance peaks showed a blue shift after the immersion of mild steel, which indicated complex formation between the extract molecules and Fe2+ ions.
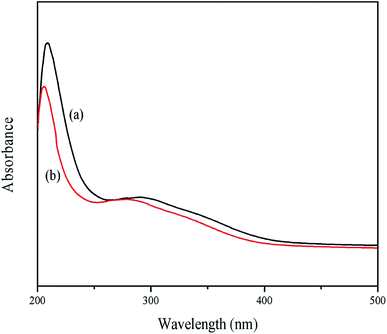 |
| | Fig. 3 UV-vis spectra of RLE before (a) and after immersion (b) of mild steel. | |
3.3 Weight loss measurements
3.3.1 Effect of inhibitors concentration. The inhibitory effect of different concentrations of RLE on mild steel corrosion in the 0.5 M H2SO4 solution was investigated by weight loss measurement at 298 K. Fig. 4 shows the effect of RLE concentration on inhibition efficiency and corrosion rate. The obtained weight loss parameters (θ, ν, η) are summarized in Table 1. From Fig. 4, it is apparent that the corrosion inhibition efficiency increased with an increasing concentration of RLE, while the corrosion rate decreased. When the concentration of RLE was 300 mg L−1, the corrosion rate was only 2.65 g m−2 h−1, and the corrosion inhibition efficiency was 93%. The excellent corrosion inhibition effect of RLE towards mild steel is probably due to the presence of its various organic components. These organic compounds contain polar functional groups with heteroatoms, such as N and O, as well as conjugated double bonds or aromatic rings, which act as the main adsorption centers.38 Accordingly, protective films may be formed on the mild steel surface through the adsorption process, thereby increasing the surface coverage area and reducing the corrosion rate of mild steel in the acid medium.39
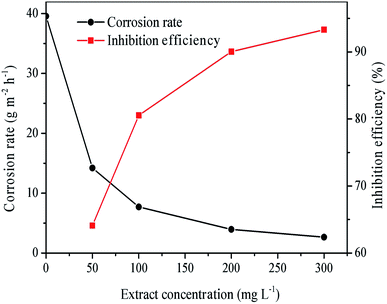 |
| | Fig. 4 Corrosion rate and inhibition efficiency at different concentrations of RLE in 0.5 M H2SO4 solution at 298 K. | |
Table 1 Corrosion parameters without and with various concentrations of RLE in 0.5 M H2SO4 solution at 298–328 K
| T (K) |
C (mg L−1) |
ν (g m−2 h−1) |
θ |
η% |
| 298 |
0 |
39.57 ± 3.4 |
— |
— |
| 50 |
14.21 ± 1.4 |
0.74 |
74.09 ± 0.55 |
| 100 |
7.69 ± 0.7 |
0.83 |
82.54 ± 0.05 |
| 200 |
3.94 ± 0.2 |
0.90 |
90.04 ± 0.35 |
| 300 |
2.65 ± 0.3 |
0.93 |
93.31 ± 0.01 |
| 308 |
0 |
62.44 ± 4.1 |
— |
— |
| 50 |
29.92 ± 2.6 |
0.52 |
52.08 ± 0.07 |
| 100 |
19.80 ± 1.9 |
0.68 |
68.24 ± 0.13 |
| 200 |
8.22 ± 1.4 |
0.87 |
86.84 ± 0.05 |
| 300 |
6.19 ± 0.5 |
0.91 |
90.84 ± 0.23 |
| 318 |
0 |
94.38 ± 3.5 |
— |
— |
| 50 |
63.80 ± 3.2 |
0.28 |
28.04 ± 0.53 |
| 100 |
47.86 ± 2.6 |
0.46 |
46.02 ± 0.17 |
| 200 |
30.71 ± 2.5 |
0.65 |
65.36 ± 0.35 |
| 300 |
24.78 ± 0.9 |
0.74 |
73.75 ± 0.93 |
| 328 |
0 |
132.45 ± 3.2 |
— |
— |
| 50 |
110.08 ± 2.0 |
0.17 |
16.89 ± 0.73 |
| 100 |
96.27 ± 4.0 |
0.27 |
27.32 ± 0.55 |
| 200 |
77.06 ± 3.1 |
0.42 |
41.82 ± 0.27 |
| 300 |
66.28 ± 1.4 |
0.50 |
49.96 ± 0.75 |
3.3.2 Effect of temperature. The corrosion rate (ν), surface coverage (θ) and inhibition efficiency (η) of mild steel after immersion in 0.5 M H2SO4 solutions with different concentrations of RLE in the 298–328 K range for 12 hours are shown in Table 1. From Table 1, it can be clearly seen that the corrosion rate increased with increasing temperature, which may be because an adsorption–desorption equilibrium existed between the inhibitor molecule and the metal surface. When the temperature rose, the equilibrium moved in the desorption direction. Moreover, when tested at 298 K and 328 K, the inhibition efficiency decreased from 93.31% to 46.12% at 300 mg L−1. These results suggested that the adsorption of RLE molecules on the surface of mild steel might be mainly physical, and temperature could change the interaction between mild steel and the acidic medium in the presence or absence of RLE.40It is known that activation energy is an important parameter in the corrosion inhibition mechanism.41 The relationship between activation energy and corrosion rate in a corrosion reaction can be expressed by the following equations:3
| |
 | (11) |
| |
 | (12) |
where
Ea represents the apparent activation energy,
R is the gas constant,
T is the absolute temperature, and
A represents the Arrhenius pre-exponential factor. The apparent activation energy was confirmed through linear regression between ln
![[thin space (1/6-em)]](https://www.rsc.org/images/entities/char_2009.gif) ν
ν and 1000/
T (
Fig. 5), and the results are listed in
Table 2. The linear regression coefficient was close to 1, which indicates that the corrosion of mild steel in the 0.5 M H
2SO
4 solution can be interpreted by the kinetic model.
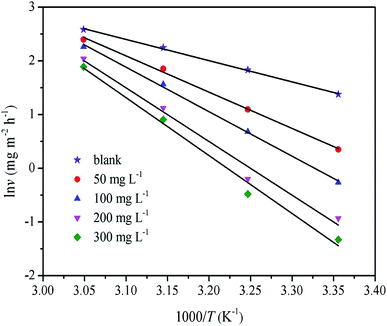 |
| | Fig. 5 Arrhenius plots for mild steel in 0.5 M H2SO4 solution without and with various concentration of RLE. | |
Table 2 Thermodynamic activation parameters for mild steel in 0.5 M H2SO4 solutions without and with various concentrations of RLE
| C (mg L−1) |
Ea (kJ mol−1) |
ΔHa (kJ mol−1) |
ΔSa (J mol−1 K−1) |
| 0 |
32.85 |
30.28 |
−137.75 |
| 50 |
57.93 |
55.34 |
−98.29 |
| 100 |
68.78 |
66.18 |
−75.77 |
| 200 |
82.04 |
79.45 |
−43.99 |
| 300 |
91.40 |
88.80 |
−16.97 |
It is known that a higher value of the Ea than without inhibitors means that an adsorption film has formed on the surface of mild steel that creates a physical barrier for charge and mass transfer.3 Furthermore, the value of Ea increased with an increase in the concentration of inhibitors, indicating that the rate of dissolution of mild steel decreased in the corrosive medium.42
Fig. 6 shows the diagram of ln![[thin space (1/6-em)]](https://www.rsc.org/images/entities/char_2009.gif) ν/T vs. 1000/T. The slope of the straight lines is (ΔHa/RT), and the intercept of the straight lines is [ln(R/Nh) + ΔSa/R]. The values of ΔHa and ΔSa were calculated from the slopes and intercepts in Fig. 6 and are listed in Table 2. These data revealed that the ΔHa values of the dissolution reaction of mild steel in the presence of inhibitors were higher than those in their absence. The positive values indicated that the dissolution of mild steel was an endothermic process, which means that mild steel is difficult to dissolve.9 ΔSa < 0 indicated that the adsorption process was slow, and the complex compound formation was associated with the rate determination step, which means that the disorder decreases after the formation of the complex compound.43
ν/T vs. 1000/T. The slope of the straight lines is (ΔHa/RT), and the intercept of the straight lines is [ln(R/Nh) + ΔSa/R]. The values of ΔHa and ΔSa were calculated from the slopes and intercepts in Fig. 6 and are listed in Table 2. These data revealed that the ΔHa values of the dissolution reaction of mild steel in the presence of inhibitors were higher than those in their absence. The positive values indicated that the dissolution of mild steel was an endothermic process, which means that mild steel is difficult to dissolve.9 ΔSa < 0 indicated that the adsorption process was slow, and the complex compound formation was associated with the rate determination step, which means that the disorder decreases after the formation of the complex compound.43
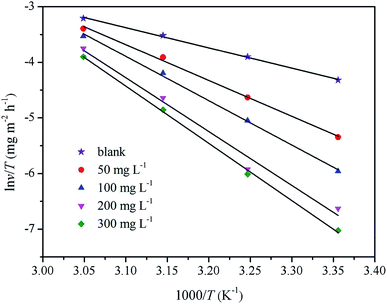 |
| | Fig. 6 Alternative Arrhenius plot for mild steel in 0.5 M H2SO4 solution without and with various concentration of RLE. | |
3.3.3 Adsorption isotherm and thermodynamic calculations. A corrosion inhibitor reduces the corrosion of metal by adsorption at the metal/solution interface, while the important parameters of interaction between the inhibitor and the metal surface can be obtained from the adsorption isotherm.44 Firstly, assuming that the adsorption of REL on the surface of mild steel conformed to the Langmuir adsorption isotherm, the relationship between θ and inhibitor concentration C was obtained by the following equation:3| |
 | (13) |
where C is the concentration of inhibitor, θ is the surface coverage, and Kads is the adsorption–desorption equilibrium constant. Fig. 7 shows the Langmuir adsorption isotherms. The correlation coefficients of these curves were very close to 1 (R2 > 0.99). This behavior indicated that the adsorption of inhibitor on the mild steel surface in a 0.5 M H2SO4 solution followed the Langmuir adsorption isotherm, which means that the inhibitor component covers a typical adsorption site when adsorbed on the metal/solution interface, thereby preventing corrosion caused by the corrosive medium.3
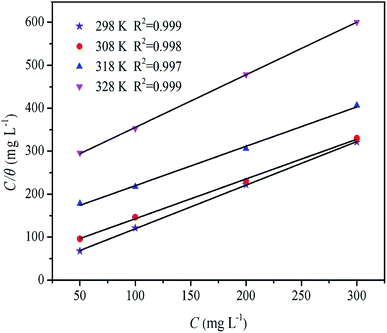 |
| | Fig. 7 Langmuir adsorption isotherm plots for mild steel in 0.5 M H2SO4 solution without and with various concentration of RLE at 298–328 K. | |
The free energy values of adsorption (ΔG0ads) were calculated using the equation:33
| |
ΔG = −RT![[thin space (1/6-em)]](https://www.rsc.org/images/entities/char_2009.gif) ln(1 × 10⁶ Kads) ln(1 × 10⁶ Kads)
| (14) |
where
T is the absolute temperature (K),
R is the universal gas constant, and 1 × 10
6 (mg L
−1) is the water molecular concentration. The values of
R2,
Kads and Δ
G0ads are listed in
Table 3.
Table 3 Thermodynamic parameters for adsorption of RLE on mild steel surface in 0.5 M H2SO4 solution at different temperatures from Langmuir adsorption isotherm
| T (K) |
Kads (L mg−1) |
R2 |
ΔG0ads (kJ mol−1) |
ΔH0ads (kJ mol−1) |
ΔS0ads (J mol−1 K−1) |
| 298 |
0.0544 |
0.999 |
−27.02 |
−69.61 |
−143.45 |
| 308 |
0.0198 |
0.998 |
−25.33 |
| 318 |
0.0078 |
0.997 |
−23.69 |
| 328 |
0.0043 |
0.999 |
−22.81 |
It has been reported that larger values of Kads indicate that the inhibitor molecules have better interaction with the surface of mild steel, providing better protection.10 According to Table 3, as the temperature increased, the Kads value decreased. Alternatively, the higher the temperature, the lower was the protective performance of the inhibitors. The −ΔG0ads values were between −22 to −27 kJ mol−1, which meant that the adsorption of inhibitor molecules on the surface of mild was a complex process (both physical and chemical adsorption).33
The adsorption enthalpy and entropy (ΔH0ads and ΔS0ads) were calculated using the equation:9
| |
 | (15) |
The values of ΔH0ads and ΔS0ads were obtained from the slope and intercept of the plot of ln![[thin space (1/6-em)]](https://www.rsc.org/images/entities/char_2009.gif) Kads vs. 1/T (Fig. 8), respectively. ΔH0ads < 0 indicated that the adsorption process was exothermic; consequently, it gradually moved towards desorption in adsorption reactions with increasing temperature.46 In addition, ΔS0ads < 0 meant that the inhibitor molecule was chaotic before it was adsorbed on the surface of mild steel. With the reaction, the inhibitor molecule was adsorbed on the surface of mild steel in an orderly manner (chaotic degree decreases).46,47
Kads vs. 1/T (Fig. 8), respectively. ΔH0ads < 0 indicated that the adsorption process was exothermic; consequently, it gradually moved towards desorption in adsorption reactions with increasing temperature.46 In addition, ΔS0ads < 0 meant that the inhibitor molecule was chaotic before it was adsorbed on the surface of mild steel. With the reaction, the inhibitor molecule was adsorbed on the surface of mild steel in an orderly manner (chaotic degree decreases).46,47
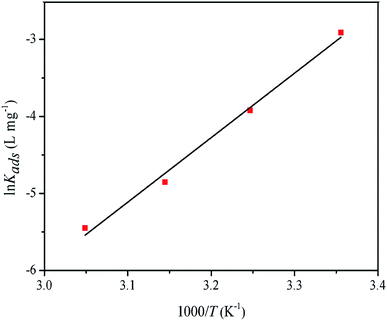 |
| | Fig. 8 Plot of ln![[thin space (1/6-em)]](https://www.rsc.org/images/entities/char_2009.gif) Kads vs. 1/T for adsorption of RLE on mild steel in 0.5 M H2SO4 solution. Kads vs. 1/T for adsorption of RLE on mild steel in 0.5 M H2SO4 solution. | |
3.4 Electrochemical measurements
3.4.1 Open circuit potential. It is first necessary to obtain a stable open circuit potential (OCP) before electrochemical impedance spectroscopy and potentiodynamic polarization studies. Therefore, the working electrode was immersed in the test solution for one hour before each concentration gradient test. Fig. 9 shows the curves of OCP vs. t. It was clearly observed that the OCP values moved towards the anode potential in the presence of RLE, which could be explained by the adsorption of RLE on the mild steel surface. The OCPs achieved a stable state after one hour, and then, the EIS and potentiodynamic polarization measurements were carried out.
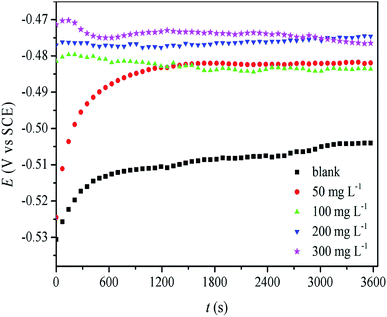 |
| | Fig. 9 Plot of OCP vs. t for mild steel electrode in 0.5 M H2SO4 solution without and with various concentration of RLE. | |
3.4.2 Potentiodynamic polarization. Fig. 10 shows the polarization curves of mild steel in 0.5 M H2SO4 solutions without and with different concentrations of RLE. The potential kinetic parameters, such as corrosion potential (Ecorr), corrosion current densities (icorr), inhibition efficiency (η), and the cathode Tafel slope (βc) and anode Tafel slope (βa) values, were obtained from the corresponding polarization curves. These parameters are listed in Table 4. It was obvious that the value of icorr decreased significantly with the increasing concentration of inhibitors, while the values of η increased. This indicated that the protective effect of inhibitors on mild steel gradually enhanced with an increase in inhibitor concentration. The corrosion inhibition efficiency reached a maximum of 94% at 300 mg L−1. As can be seen from Fig. 10, the polarization curves of cathode and anode were different in the presence of inhibitors compared with those without inhibitors. These phenomena showed that the addition of inhibitors not only reduced the dissolution of metals but also inhibited the reaction of hydrogen evolution. Furthermore, from the polarization curve, it was found that the change for the cathode was more obvious than that for the anode. Moreover, the corrosion potential (Ecorr) shifted towards the cathode in comparison with the curve obtained in the absence of inhibitors, and the maximum change value of Ecorr was 11 mV. Consequently, RLE is a mixed corrosion inhibitor based on the cathode in 0.5 M H2SO4.29 It is also clear from Fig. 10 that the cathode Tafel curves are almost parallel with increasing inhibitor concentration. In addition, it is also clear from Table 4 that the cathode Tafel slope (βc) and anode Tafel slope (βa) value hardly changed, which meant that the mechanism of hydrogen evolution did not change when the inhibitors were added. This may be due to the fact that the inhibitor molecule covers the surface of mild steel, thus reducing the area of active sites for the reaction, while the mechanism of hydrogen evolution through charge transfer remains unaffected.48,49
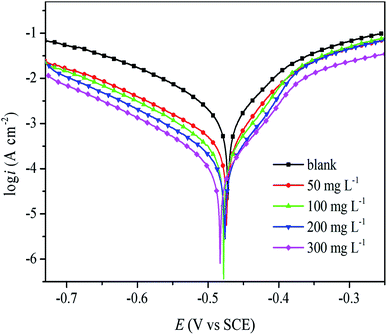 |
| | Fig. 10 Tafel polarization curves for mild steel in 0.5 M H2SO4 solution without and with various concentration of RLE. | |
Table 4 Polarization parameters or mild steel in 0.5 M H2SO4 solution without and with various concentration of RLE
| C (mg L−1) |
Ecorr vs. SCE (mV) |
icorr (mA cm−2) |
−βc (V dec−1) |
βa (V dec−1) |
η% |
| 0 |
−472 ± 0.50 |
1.80 ± 0.05 |
7.93 ± 0.21 |
9.95 ± 0.35 |
— |
| 50 |
−474 ± 0.73 |
0.47 ± 0.01 |
8.08 ± 0.14 |
12.42 ± 0.40 |
73.89 |
| 100 |
−478 ± 1.30 |
0.27 ± 0.03 |
8.41 ± 0.26 |
16.03 ± 0.31 |
85.20 |
| 200 |
−476 ± 0.95 |
0.15 ± 0.02 |
8.62 ± 0.32 |
18.80 ± 0.32 |
91.40 |
| 300 |
−483 ± 0.41 |
0.11 ± 0.01 |
8.62 ± 0.14 |
18.23 ± 0.30 |
94.11 |
3.4.3 Electrochemical impedance spectroscopy. In order to verify the results from the weight loss and polarization measurements and obtain more information about the corrosion mechanism, the EIS measurement of mild steel in 0.5 M H2SO4 with different concentrations of RLE was performed, and the important results are shown in Table 5. Furthermore, Nyquist and Bode's plots are provided in Fig. 11. The impedance spectra in the Nyquist diagram consisted of a large capacitive loop at high frequencies (HF) and an inductive loop at low frequencies (LF). The HF capacitive loop was due to the charge transfer reaction and time constant of the double layer, as well as the surface inhomogeneity, and the LF inductive loop might be due to the relaxation process caused by Hads+, SO42− and corrosion inhibitor molecules adsorbed on the metal surface.50 This may also be caused by the re-dissolution of the passivated surface at low frequencies.51 The shape of all the graphs in the Nyquist diagram was consistent whether there were inhibitors or not, which showed that the mechanism of corrosion of mild steel had not changed. In other words, the corrosion process was mainly a charge transfer process.45,52,53 Besides, their shapes were imperfect due to the inhomogeneity and roughness of the electrode surface, the adsorbed inhibitor molecules on the electrode surface and the dispersion of frequency.34,41 On the other hand, the diameters of these semicircles increased with an increase in inhibitor concentration. This indicated the enhanced protection of electrodes because of the increased coverage of inhibitors on the surface of electrodes.54,55
Table 5 EIS parameters for mild steel in 0.5 M H2SO4 solution without and with various concentration of RLE
| C (mg L−1) |
Rs (Ω cm2) |
Y0 (μSn Ω−1 m−2) |
n |
Rct (Ω cm2) |
Cdl (μF cm2) |
L (H cm2) |
RL (Ω cm2) |
η% |
χ2 (×103) |
| 0 |
1.20 ± 0.2 |
674.80 ± 2.1 |
0.86 ± 0.02 |
9.29 ± 2.0 |
369.22 ± 3.2 |
0.34 ± 0.1 |
3.11 × 10⁶ ± 0.1 |
— |
1.73 ± 0.01 |
| 50 |
1.67 ± 0.1 |
226.01 ± 3.2 |
0.85 ± 0.02 |
40.89 ± 2.0 |
123.17 ± 4.0 |
9.24 ± 0.9 |
5.05 ± 0.1 |
77.28 |
1.24 ± 0.01 |
| 100 |
1.50 ± 0.2 |
233.12 ± 4.0 |
0.82 ± 0.01 |
63.83 ± 2.0 |
115.97 ± 3.0 |
24.62 ± 0.9 |
5.71 ± 0.1 |
85.45 |
1.62 ± 0.01 |
| 200 |
1.49 ± 0.2 |
148.21 ± 2.5 |
0.85 ± 0.01 |
97.06 ± 2.0 |
76.68 ± 2.1 |
61.06 ± 1.0 |
8.68 ± 0.1 |
90.12 |
1.69 ± 0.01 |
| 300 |
1.35 ± 0.2 |
115.83 ± 1.6 |
0.85 ± 0.01 |
118.90 ± 1.9 |
51.29 ± 2.0 |
126 ± 2.0 |
6.91 ± 0.1 |
92.19 |
0.97 ± 0.01 |
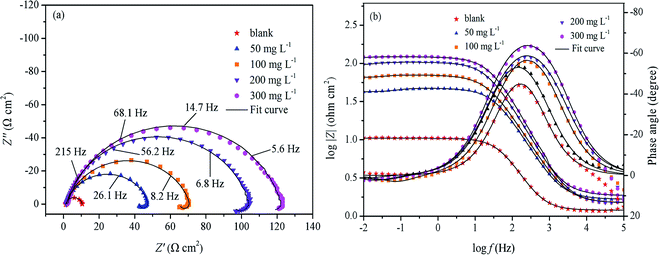 |
| | Fig. 11 Nyquist (a) and Bode (b) plots for mild steel in 0.5 M H2SO4 solution without and with various concentration of RLE. | |
The EIS data were fitted using the classical equivalent circuit diagram in Fig. 12. The value of Cdl was calculated using the equation:36
| |
 | (16) |
where
fmax is the frequency of the maximum value in the imaginary part of the impedance spectrum.
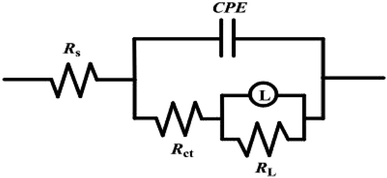 |
| | Fig. 12 Equivalent circuit for EIS date. | |
The EIS parameters are displayed in Table 5, where Rs is solution resistance (the resistance of solution between the working electrode and the counter electrode), Rct denotes the charge transfer resistance, RL is the inductance resistance, which is in parallel connection with the inductor L, Cdl represents the double layer capacitance, CPE is the constant phase element, n is the phase shift and χ2 denotes the deviation degree of the equivalent circuit fitting etc. It has been reported that values of χ2 between 10−3 and 10−5 are compliant with ideal fitting, confirming that the equivalent circuit diagram is reliable.56 Based on the results in Table 5, the charge transfer resistance (Rct) and corrosion inhibition efficiency (η) increased with an increasing concentration of RLE. The maximum corrosion inhibition efficiency reached 92% at 300 mg L−1, which is almost consistent with the results obtained from the weight loss and potentiodynamic polarization analyses. However, the value of Cdl decreased with an increase in RLE concentration. The reason was that the coverage of inhibitor molecules on electrode surface increased with the increase in concentration, which resulted in the reduction of the exposed area of the electrode in the erosive medium, an increase in the thickness of the double layer and a decrease in the local dielectric constant.34,57 When the inhibitor was added, the value of solution resistance did not change significantly. Additionally, the value of phase shift, n (0.82–0.86) did not change obviously, which demonstrated that the dissolution mechanism of mild steel was controlled by charge transfer in a 0.5 M H2SO4 solution.58
The Bode plots for mild steel in the 0.5 M H2SO4 solution containing various concentrations of RLE are shown in Fig. 11(b). It was found that there was only one time constant from the Bode plots. Furthermore, the impedance modulus increased with the increase in RLE concentration in the frequency range used in this study. Equally, the frequency range of the maximum phase angle also increased.55 All these results demonstrated that RLE offered good protection against mild steel corrosion in the 0.5 M H2SO4 solution. According to previous reports,59 for an ideal capacitance at an intermediate frequency, the slope of log![[thin space (1/6-em)]](https://www.rsc.org/images/entities/char_2009.gif) |Z| vs. log
|Z| vs. log![[thin space (1/6-em)]](https://www.rsc.org/images/entities/char_2009.gif) f is −1, and the maximum phase angle is −90°. It was observed from Table 6 that the value of slope (S) gradually approached 1 (0.37–0.70), and the phase angles (α) were close to 90° (40.3–65.3) in the intermediate frequency range. This illustrated that the corrosion inhibition effect of RLE was outstanding for mild steel in a 0.5 M H2SO4 solution. However, the slopes (S) and phase angles (α) deviated from those of the ideal capacitance at the intermediate frequency. The main reason is the deviation from the ideal intermediate frequency capacitance.60
f is −1, and the maximum phase angle is −90°. It was observed from Table 6 that the value of slope (S) gradually approached 1 (0.37–0.70), and the phase angles (α) were close to 90° (40.3–65.3) in the intermediate frequency range. This illustrated that the corrosion inhibition effect of RLE was outstanding for mild steel in a 0.5 M H2SO4 solution. However, the slopes (S) and phase angles (α) deviated from those of the ideal capacitance at the intermediate frequency. The main reason is the deviation from the ideal intermediate frequency capacitance.60
Table 6 The slopes (−S) and the maximum phase angles (α°) for mild steel in 0.5 M H2SO4 solution in absence and presence of RLE
| C (mg L−1) |
−S |
−α (°) |
| 0 |
0.37 |
40.3 |
| 50 |
0.55 |
53.5 |
| 100 |
0.58 |
56.6 |
| 200 |
0.62 |
59.4 |
| 300 |
0.70 |
65.3 |
3.5 SEM analysis
In order to explore the inhibitory properties of RLE better, the surface morphology of mild steel was analyzed. The SEM micrographs (secondary electrons image) of mild steel surface after 12 h of immersion in 0.5 M H2SO4 in the absence and presence of 300 mg L−1 RLE are shown in Fig. 13. There were deep ravines and large pits on the surface of mild steel without RLE, which was significantly different from the polished surface. This indicated that mild steel was seriously corroded in a 0.5 M H2SO4 solution. However, it was obvious that the surface of mild steel presented a relatively smoother morphology with 300 mg L−1 RLE, which was very similar to the polished surface. In addition, these phenomena indicated that the inhibitor molecules adsorbed on the surface of mild steel to form a protective film, which prevented the corrosion resulting from the corrosive medium. Thus, mild steel was well protected by RLE in the 0.5 M H2SO4 solution.
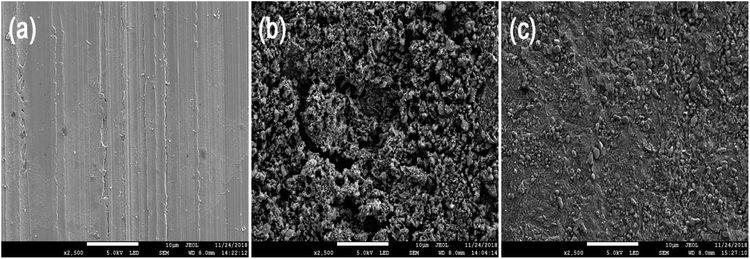 |
| | Fig. 13 SEM micrographs of mild steel polished (a), after immersion without (b) and with (c) 300 mg L−1 of RLE in 0.5 M H2SO4 solution. | |
3.6 Theoretical calculations and mechanism of corrosion inhibition
A quantum chemistry method was used to study the structure–reaction correlation of the compounds in RLE to predict the properties and degree of adsorption of the inhibitors. Fig. 14 shows the optimized structures and frontier molecular orbital (FMO) density distributions (HOMO and LUMO). The calculated quantum chemical parameters are listed in Table 7.
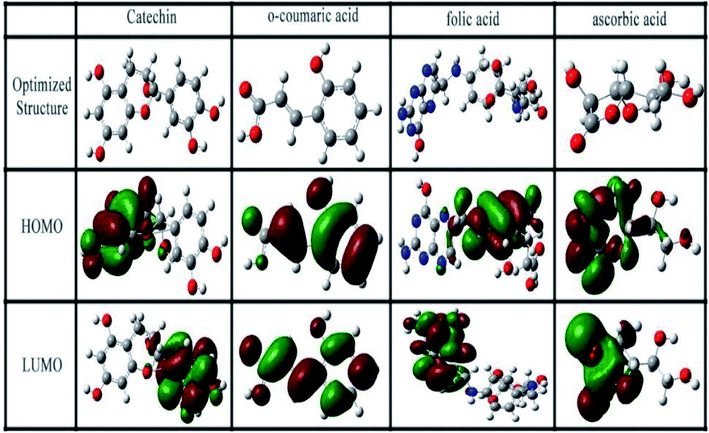 |
| | Fig. 14 Optimum structures, HOMO and LUMO of major compounds in RLE. | |
Table 7 Quantum chemical parameters of main compounds in RLE
| |
EHOMO |
ELOMO |
ΔE |
χ |
η |
ΔN |
| Folic acid |
−5.2771 |
−1.9108 |
3.3663 |
3.5940 |
1.6832 |
1.0118 |
| Catechin |
−5.4583 |
−1.529 |
3.7054 |
3.6056 |
1.8527 |
0.9161 |
| o-Coumaric acid |
−6.1357 |
−1.6370 |
4.5005 |
3.8873 |
2.2546 |
0.6921 |
| Ascorbic acid |
−7.1487 |
−0.1401 |
7.0086 |
3.6444 |
3.5043 |
0.4788 |
The values of EHOMO and ELUMO denote the electron acceptance ability and electron-donating capability of a molecule, respectively. In general, the lower the value of ELUMO, the easier it is to accept electrons. The higher the value of EHOMO, the easier it is to provide electrons.61 According to Table 7, the power of providing electrons follows the order: folic acid > catechin > o-coumaric acid > ascorbic acid. The energy gap (ΔE) reflects the strength of molecular participation in chemical reactions. The lower the value of ΔE, the stronger is the adsorption of the molecule on the metal surface and the higher is the inhibition efficiency.31 It was found that the ΔE value of folic acid was the lowest, followed by catechin. The value of ΔN denotes the number of electrons transferred from the molecule to the metal surface. It could be seen that folic acid provided the most number of electrons to the metals, followed by catechin. According to the quantum chemical calculations, folic acid and catechin more easily provide electrons to the empty 3d orbit of the iron atoms compared to the other compounds and coordinate with each other, and thus are strongly adsorbed on the surface of mild steel. That is to say, they play more role in corrosion inhibition than the other RLE components.
The corrosion inhibiting effect of RLE is brought about by the adsorption of many organic components on the surface of mild steel. RLE exists as neutral molecules and/or in the protonated form in the aqueous sulfuric acid solution, as shown below.
| | |
RLE + χH+ ↔ [RLEHχ]χ+
| (17) |
| | |
[RLEHχ]χ+ + Fe2+ ↔ [RLEHχ − Fe](χ+2)+
| (18) |
| | |
RLE + Fe2+ ↔ [RLE − Fe]2+
| (19) |
Protonated RLE interacts with negatively-charged metals via electrostatic attraction (i.e. physical adsorption). On the other hand, the solitary pairs of electrons in the N and O atoms or the π-electrons in the aromatic rings in neutral RLE molecules interact with the empty d-orbitals of iron atoms to form covalent bonds. In addition, the neutral RLE molecules can replace water molecules on metal surfaces (i.e. chemical adsorption). According to the adsorption parameters, both physical and chemical adsorptions were confirmed in this case.4,35
3.7 Biodegradability of RLE
The biodegradation rate of RLE in 28 days is shown in Fig. 15. It can be seen from the figure that the degradation rate of RLE increased with time and was 82% at 28 days. According to the Convention for the Protection of the Environment of the North-East Atlantic, if the biodegradation rate is more than 60% within 28 days, it can be considered as easily biodegradable.62 Therefore, RLE is a biodegradable corrosion inhibitor.
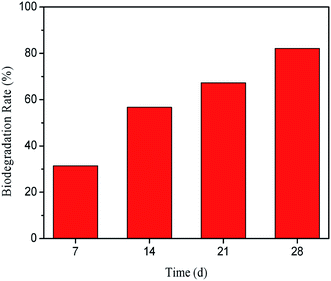 |
| | Fig. 15 Biodegradability of RLE. | |
4. Conclusion
The efficiency of RLE in mild steel corrosion inhibition increased with the extract concentration and decreased with increasing temperature. The corrosion inhibition performance was up to 93% with 300 mg L−1 at 298 K. Potentiodynamic curves measurement showed that RLE acted as a mixed-type inhibitor based on the cathode. The EIS, SEM, FTIR and UV-visible spectroscopy analyses indicated that the inhibitor molecules were adsorbed on the surface of mild steel to form a protective film, which prevented corrosion resulting from the corrosive medium. The adsorption of RLE on the surface of mild steel followed the Langmuir adsorption isotherm model. Adsorption thermodynamics parameters showed that both physical and chemical adsorption existed. Theoretical calculations showed that folic acid and catechin played a greater role in corrosion inhibition by RLE. The degradation rate of RLE reached 82% at 28 d. Consequently, it can be concluded that RLE is a good biodegradable corrosion inhibitor.
Conflicts of interest
There are no conflicts to declare.
Acknowledgements
This work was financially supported by the Funded Projects of Henan Science and Technology Development Plan (Grant No. 162300410005).
References
- B. Qian, J. Wang and M. Zheng, et al., Synergistic effect of polyaspartic acid and iodide ion on corrosion inhibition of mild steel in H2SO4, Corros. Sci., 2013, 75(7), 184–192 CrossRef CAS.
- M. A. Deyab, M. M. Osman and A. E. Elkholy, et al., Green approach towards corrosion inhibition of carbon steel in produced oilfield water using lemongrass extract, RSC Adv., 2017, 7(72), 45241–45251 RSC.
- M. Faustina, A. Maciuk and P. Salvina, et al., Corrosion inhibition of C38 steel by alkaloids extract of Geissospermum laeve in 1 M hydrochloric acid: electrochemical and phytochemical studies, Corros. Sci., 2015, 92, 287–300 CrossRef.
- F. El-Taib Heakal, M. A. Deyab and M. M. Osman, et al., Performance of Centaurea cyanus aqueous extract towards corrosion mitigation of carbon steel in saline formation water, Desalination, 2018, 425, 111–122 CrossRef CAS.
- M. Lebrini, F. Robert and A. Lecante, et al., Corrosion inhibition of C38 steel in 1 M hydrochloric acid medium by alkaloids extract from Oxandra asbeckii plant, Corros. Sci., 2011, 53(2), 687–695 CrossRef CAS.
- F. Zhang, Y. Tang and Z. Cao, et al., Performance and theoretical study on corrosion inhibition of 2-(4-pyridyl)-benzimidazole for mild steel in hydrochloric acid, Corros. Sci., 2012, 61, 1–9 CrossRef CAS.
- J. Zhang, X. L. Gong and H. H. Yu, et al., The inhibition mechanism of imidazoline phosphate inhibitor for Q235 steel in hydrochloric acid medium, Corros. Sci., 2011, 53(10), 3324–3330 CrossRef CAS.
- S. E. Nataraja, T. V. Venkatesha and K. Manjunatha, et al., Inhibition of the corrosion of steel in hydrochloric acid solution by some organic molecules containing the methylthiophenyl moiety, Corros. Sci., 2011, 53(8), 2651–2659 CrossRef CAS.
- P. Mourya, S. Banerjee and M. M. Singh, Corrosion inhibition of mild steel in acidic solution by Tagetes erecta (marigold flower) extract as a green inhibitor, Corros. Sci., 2014, 85, 352–363 CrossRef CAS.
- X. H. Li, S. D. Deng and H. Fu, et al., Synergistic inhibition effects of bamboo leaf extract/major components and iodide ion on the corrosion of steel in H3PO4 solution, Corros. Sci., 2014, 78, 29–42 CrossRef CAS.
- K. Abiola and A. O. James, The effects of aloe vera extract on corrosion and kinetics of corrosion process of zinc in HCl solution, Corros. Sci., 2010, 52(2), 661–664 CrossRef.
- E. E. Oguzie, Evaluation of the inhibitive effect of some plant extracts on the acid corrosion of mild steel, Corros. Sci., 2008, 50(11), 2993–2998 CrossRef CAS.
- G. Gunasekaran and L. R. Chauhan, Eco-friendly inhibitor for corrosion inhibition of mild steel in phosphoric acid medium, Electrochim. Acta, 2004, 49(25), 4387–4395 CrossRef CAS.
- A. Y. El-Etre, Inhibition of C-steel corrosion in acidic solution using the aqueous extract of zallouh root, Mater. Chem. Phys., 2008, 108(2–3), 278–282 CrossRef CAS.
- G. Ji, P. Dwivedi and S. Sundaram, et al., Inhibitive effect of Chlorophytum borivilianum root extract on mild steel corrosion in HCl and H2SO4 solutions, Ind. Eng. Chem. Res., 2013, 52(31), 10673–10681 CrossRef CAS.
- M. Shabani-Nooshabadi and M. Kazemi-Darafshani, Root and shoot extracts of Ajuga chamaecistus subsp. scoparia as natural inhibitors for 304 stainless steel corrosion in strong acidic medium, Surf. Eng. Appl. Electrochem., 2017, 53(6), 560–569 CrossRef.
- A. H. Al-Moubaraki, A. A. Al-Howiti and M. M. Al-Dailami, et al., Role of aqueous extract of celery (Apium graveolens, L.) seeds against the corrosion of aluminium/sodium hydroxide systems, J. Environ. Chem. Eng., 2017, 5, 4194–4205 CrossRef CAS.
- H. Elgahawi, M. Gobara and A. Baraka, et al., Eco-friendly corrosion inhibition of AA2024 in 3.5% NaCl using the extract of Linum usitatissimum seeds, J. Bio. Tribo. Corros., 2017, 3(4), 55–67 CrossRef.
- G. Ji, S. Anjum and S. Sundaram, et al., Musa paradisica peel extract as green corrosion inhibitor for mild steel in HCl solution, Corros. Sci., 2015, 90, 107–117 CrossRef CAS.
- A. Singh, Y. Lin and E. E. Ebenso, et al., Gingko biloba fruit extract as an eco-friendly corrosion inhibitor for J55 steel in CO2 saturated 3.5% NaCl solution, J. Ind. Eng. Chem., 2015, 24, 219–228 CrossRef CAS.
- G. B. Dehghani and B. Ramezanzadeh, et al., Potential of borage flower aqueous extract as an environmentally sustainable corrosion inhibitor for acid corrosion of mild steel: electrochemical and theoretical studies, J. Mol. Liq., 2019, 277, 895–911 CrossRef.
- M. T. Majd, S. Asaldoust and G. Bahlakeh, et al., Green method of carbon steel effective corrosion mitigation in 1 M HCl medium protected by Primula vulgaris flower aqueous extract via experimental, atomic-level MC/MD simulation and electronic-level DFT theoretical elucidation, J. Mol. Liq., 2019, 284, 658–674 CrossRef CAS.
- H. H. Zhang, Q. J. Qiao and T. Huang, et al., Nutrient components and color protection of dehydrated radish (Raphanus sativus L.) leaf, Food Res. Dev., 2014, 35(19), 116–120 CAS.
- R. M. P. Gutiérrez and P. R. Lule, Raphanus sativus (radish): their chemistry and biology, Sci. World J., 2004, 4, 811–837 CrossRef PubMed.
- M. Aboyeji, A. O. Adekiya and O. Dunsin, et al., Growth, yield and vitamin C content of radish (Raphanus sativus L.) as affected by green biomass of Parkia biglobosa and Tithonia diversifolia, Agrofor. Syst., 2019, 93, 803–812 CrossRef.
- M. I. Reznik, Preparation of vitamin C drink from horse-radish leaves, Gigiena I Sanitariia, 1951, 11(4), 34 CAS.
- S. S. Beevi, M. L. Narasu and B. B. Gowda, Polyphenolics profile, antioxidant and radical scavenging activity of leaves and stem of Raphanus sativus L, Plant Foods Hum. Nutr., 2010, 65(1), 8–17 CrossRef CAS PubMed.
- N. Yilmaz, A. Fitoz and E. ümit, et al., A combined electrochemical and theoretical study into the effect of 2-((thiazole-2-ylimino)methyl)phenol as a corrosion inhibitor for mild steel in a highly acidic environment, Corros. Sci., 2016, 111, 110–120 CrossRef CAS.
- K. Hu, J. Zhuang and J. T. Ding, et al., Influence of biomacromolecule DNA corrosion inhibitor on carbon steel, Corros. Sci., 2017, 125, 68–76 CrossRef CAS.
- GB/T20778-2006 Evaluation of biodegradability of water treatment chemicals-Carbon dioxide evolution test, China Standards Press, Beijing, 2006 Search PubMed.
- L. L. Li, S. Mo and L. H. Qun, et al., Corrosion protection for mild steel by extract from the waste of lychee fruit in HCl solution: experimental and theoretical studies, J. Colloid Interface Sci., 2018, 520, 41–49 CrossRef PubMed.
- S. Deng and X. H. Li, Inhibition by ginkgo leaves extract of the corrosion of steel in HCl and H2SO4 solutions, Corros. Sci., 2012, 55, 407–415 CrossRef CAS.
- N. A. Odewunmia, S. A. Umoren and Z. M. Gasem, et al., L-Citrulline: an active corrosion inhibitor component of watermelon rind extract for mild steel in HCl medium, J. Taiwan Inst. Chem. Eng., 2015, 51, 177–185 CrossRef.
- H. Wang, M. Gao and Y. Guo, et al., A natural extract of tobacco rob as scale and corrosion inhibitor in artificial seawater, Desalination, 2016, 398, 198–207 CrossRef CAS.
- P. Muthukrishnan, B. Jeyaprabha and P. Prakash, Adsorption and corrosion inhibiting behavior of Lannea coromandelica leaf extract on mild steel corrosion, Arabian J. Chem., 2017, 10, S2343–S2354 CrossRef CAS.
- P. E. Alvarez, M. V. Fiori-Bimbi and A. Neske, et al., Rollinia occidentalis extract as green corrosion inhibitor for carbon steel in HCl solution, J. Ind. Eng. Chem., 2018, 58, 92–99 CrossRef CAS.
- S. Chen and D. Zhang, Study of corrosion behavior of copper in 3.5% NaCl solution containing extracellular polymeric substances of an aerotolerant sulphate-reducing bacteria, Corros. Sci., 2018, 136, 275–284 CrossRef CAS.
- V. V. Torres, R. S. Amado and F. Camila, et al., Inhibitory action of aqueous coffee ground extracts on the corrosion of carbon steel in HCl solution, Corros. Sci., 2011, 53(7), 2385–2392 CrossRef CAS.
- A. K. Satapathy, G. Gunasekaran and S. C. Sahoo, et al., Corrosion inhibition by Justicia gendarussa plant extract in hydrochloric acid solution, Corros. Sci., 2009, 51(12), 2848–2856 CrossRef CAS.
- M. Abdallah, Rhodanine azosulpha drugs as corrosion inhibitors for corrosion of 304 stainless steel in hydrochloric acid solution, Corros. Sci., 2002, 44(4), 717–728 CrossRef CAS.
- M. Dehdab, Z. Yavari and M. Darijani, et al., The inhibition of carbon-steel corrosion in seawater by streptomycin and tetracycline antibiotics: an experimental and theoretical study, Desalination, 2016, 400, 7–17 CrossRef CAS.
- S. A. Umoren, Y. Li and F. H. Wang, Synergistic effect of iodide ion and polyacrylic acid on corrosion inhibition of iron in H2SO4 investigated by electrochemical techniques, Corros. Sci., 2010, 52(7), 2422–2429 CrossRef CAS.
- E. E. Oguzie, V. O. Njoku and C. K. Enenebeaku, et al., Effect of hexamethyl pararosaniline chloride (crystal violet) on mild steel corrosion in acidic media, Corros. Sci., 2008, 50(12), 3480–3486 CrossRef CAS.
- H. S. Gadow and M. M. Motawea, Investigation of the corrosion inhibition of carbon steel in hydrochloric acid solution by using ginger roots extract, RSC Adv., 2017, 7, 24576–24588 RSC.
- X. Li, S. Deng and H. Fu, Inhibition of the corrosion of steel in HCl, H2SO4 solutions by bamboo leaf extract, Corros. Sci., 2012, 62, 163–175 CrossRef CAS.
- X. Li, S. Deng and H. Fu, Adsorption and inhibition effect of vanillin on cold rolled steel in 3.0 M H3PO4, Prog. Org. Coat., 2010, 67(4), 420–426 CrossRef CAS.
- A. Saxena, D. Prasad and R. Haldhar, et al., Use of sida cordifolia extract as green inhibitor for mild steel in 0.5 M H2SO4, J. Environ. Chem. Eng., 2018, 6(1), 694–700 CrossRef CAS.
- M. A. Hegazy, A novel schiff base-based cationic gemini surfactants: synthesis and effect on corrosion inhibition of carbon steel in hydrochloric acid solution, Corros. Sci., 2009, 51(11), 2610–2618 CrossRef CAS.
- A. O. Yüce, R. Solmaz and G. Karda, Investigation of inhibition effect of rhodanine-N-acetic acid on mild steel corrosion in HCl solution, Mater. Chem. Phys., 2012, 131(3), 615–620 CrossRef.
- P. C. Okafor and Y. Zheng, Synergistic inhibition behaviour of methylbenzyl quaternary imidazoline derivative and iodide ions on mild steel in H2SO4 solutions, Corros. Sci., 2009, 51, 850–859 CrossRef CAS.
- E. M. Sherif and S.-M. Park, Effects of 1,4-naphthoquinone on aluminum corrosion in 0.50 M sodium chloride solutions, Electrochim. Acta, 2006, 51, 1313–1321 CrossRef CAS.
- K. Zhang, B. Xu and W. Yang, et al., Halogen-substituted imidazoline derivatives as corrosion inhibitors for mild steel in hydrochloric acid solution, Corros. Sci., 2015, 90, 284–295 CrossRef CAS.
- Y. Qiang, S. Zhang and L. Guo, et al., Experimental and theoretical studies of four allyl imidazolium-based ionic liquids as green inhibitors for copper corrosion in sulfuric acid, Corros. Sci., 2017, 119, 68–78 CrossRef CAS.
- T. Gu, Z. Chen and X. Jiang, et al., Synthesis and inhibition of N-alkyl-2-(4-hydroxybut-2-ynyl)pyridinium bromide for mild steel in acid solution: Box–Behnken design optimization and mechanism probe, Corros. Sci., 2015, 90(78), 118–132 CrossRef CAS.
- N. Soltani, N. Tavakkoli and M. K. Kashani, et al., Silybum marianum extract as a natural source inhibitor for 304 stainless steel corrosion in 1.0 M HCl, J. Ind. Eng. Chem., 2014, 20(5), 3217–3227 CrossRef CAS.
- M. Mobin and M. Rizvi, Adsorption and corrosion inhibition behavior of hydroxyethyl cellulose and synergistic surfactants additives for carbon steel in 1.0 M HCl, Carbohydr. Polym., 2017, 156, 202–214 CrossRef CAS PubMed.
- Y. Qiang, S. Zhang and B. Tan, et al., Evaluation of ginkgo leaf extract as an eco-friendly corrosion inhibitor of X70 steel in HCl solution, Corros. Sci., 2018, 133, 6–16 CrossRef CAS.
- F. Zulkifli, N. Ali and M. S. M. Yusof, et al., Henna leaves extract as a corrosion inhibitor in acrylic resin coating, Prog. Org. Coat., 2017, 105, 310–319 CrossRef CAS.
- K. Yadav, M. A. Quraishi and B. Maiti, Inhibition effect of some benzylidenes on mild steel in 1 M HCl: an experimental and theoretical correlation, Corros. Sci., 2012, 55, 254–266 CrossRef.
- E. Naderi, A. H. Jafari and M. Ehteshamzadeh, et al., Effect of carbon steel microstructures and molecular structure of two new Schiff base compounds on inhibition performance in 1 M HCl solution by EIS, Mater. Chem. Phys., 2009, 115(2–3), 852–858 CrossRef CAS.
- Q. Zhang, Y. M. Tang and S. J. Qi, et al., The inhibition performance of long-chain alkyl-substituted benzimidazole derivatives for corrosion of mild steel in HCl, Corros. Sci., 2016, 102, 517–522 CrossRef.
- D. Hasson, H. Shemer and A. Sher, State of the art of friendly “green” scale control inhibitors: a review article, Ind. Eng. Chem. Res., 2011, 50(12), 7601–7607 CrossRef CAS.
|
| This journal is © The Royal Society of Chemistry 2019 |
Click here to see how this site uses Cookies. View our privacy policy here.  Open Access Article
 *a and
Ying Xu
 *ab
*ab


![[double bond, length as m-dash]](https://www.rsc.org/images/entities/char_e001.gif) O/C
O/C![[double bond, length as m-dash]](https://www.rsc.org/images/entities/char_e001.gif) N bending.33–35 The absorption at 1388 cm−1 could be the stretching vibration of C–N in the amides.32 The peak at 1058 cm−1 was attributed to the C–O groups.20 These findings indicated that RLE contained nitrogen and oxygen in its functional groups (O–H, C
N bending.33–35 The absorption at 1388 cm−1 could be the stretching vibration of C–N in the amides.32 The peak at 1058 cm−1 was attributed to the C–O groups.20 These findings indicated that RLE contained nitrogen and oxygen in its functional groups (O–H, C![[double bond, length as m-dash]](https://www.rsc.org/images/entities/char_e001.gif) O, C
O, C![[double bond, length as m-dash]](https://www.rsc.org/images/entities/char_e001.gif) N or C–O), which is in agreement with the structures of typical corrosion inhibitors. The FTIR spectrum of the corrosion products on the mild steel surface immersed in a 0.5 M H2SO4 containing 300 mg L−1 RLE is shown in Fig. 2(b), in which the absorption peaks of O–H, C
N or C–O), which is in agreement with the structures of typical corrosion inhibitors. The FTIR spectrum of the corrosion products on the mild steel surface immersed in a 0.5 M H2SO4 containing 300 mg L−1 RLE is shown in Fig. 2(b), in which the absorption peaks of O–H, C![[double bond, length as m-dash]](https://www.rsc.org/images/entities/char_e001.gif) O/C
O/C![[double bond, length as m-dash]](https://www.rsc.org/images/entities/char_e001.gif) N, C–N, C–O–C appeared at 3432 cm−1, 1632 cm−1, 1390 cm−1, 1126 cm−1, respectively.4,21,35,36 These observations suggested that RLE was adsorbed on the surface of mild steel.
N, C–N, C–O–C appeared at 3432 cm−1, 1632 cm−1, 1390 cm−1, 1126 cm−1, respectively.4,21,35,36 These observations suggested that RLE was adsorbed on the surface of mild steel.


![[thin space (1/6-em)]](https://www.rsc.org/images/entities/char_2009.gif) ν and 1000/T (Fig. 5), and the results are listed in Table 2. The linear regression coefficient was close to 1, which indicates that the corrosion of mild steel in the 0.5 M H2SO4 solution can be interpreted by the kinetic model.
ν and 1000/T (Fig. 5), and the results are listed in Table 2. The linear regression coefficient was close to 1, which indicates that the corrosion of mild steel in the 0.5 M H2SO4 solution can be interpreted by the kinetic model.

![[thin space (1/6-em)]](https://www.rsc.org/images/entities/char_2009.gif) ν/T vs. 1000/T. The slope of the straight lines is (ΔHa/RT), and the intercept of the straight lines is [ln(R/Nh) + ΔSa/R]. The values of ΔHa and ΔSa were calculated from the slopes and intercepts in Fig. 6 and are listed in Table 2. These data revealed that the ΔHa values of the dissolution reaction of mild steel in the presence of inhibitors were higher than those in their absence. The positive values indicated that the dissolution of mild steel was an endothermic process, which means that mild steel is difficult to dissolve.9 ΔSa < 0 indicated that the adsorption process was slow, and the complex compound formation was associated with the rate determination step, which means that the disorder decreases after the formation of the complex compound.43
ν/T vs. 1000/T. The slope of the straight lines is (ΔHa/RT), and the intercept of the straight lines is [ln(R/Nh) + ΔSa/R]. The values of ΔHa and ΔSa were calculated from the slopes and intercepts in Fig. 6 and are listed in Table 2. These data revealed that the ΔHa values of the dissolution reaction of mild steel in the presence of inhibitors were higher than those in their absence. The positive values indicated that the dissolution of mild steel was an endothermic process, which means that mild steel is difficult to dissolve.9 ΔSa < 0 indicated that the adsorption process was slow, and the complex compound formation was associated with the rate determination step, which means that the disorder decreases after the formation of the complex compound.43

![[thin space (1/6-em)]](https://www.rsc.org/images/entities/char_2009.gif) ln(1 × 10⁶ Kads)
ln(1 × 10⁶ Kads)

![[thin space (1/6-em)]](https://www.rsc.org/images/entities/char_2009.gif) Kads vs. 1/T (Fig. 8), respectively. ΔH0ads < 0 indicated that the adsorption process was exothermic; consequently, it gradually moved towards desorption in adsorption reactions with increasing temperature.46 In addition, ΔS0ads < 0 meant that the inhibitor molecule was chaotic before it was adsorbed on the surface of mild steel. With the reaction, the inhibitor molecule was adsorbed on the surface of mild steel in an orderly manner (chaotic degree decreases).46,47
Kads vs. 1/T (Fig. 8), respectively. ΔH0ads < 0 indicated that the adsorption process was exothermic; consequently, it gradually moved towards desorption in adsorption reactions with increasing temperature.46 In addition, ΔS0ads < 0 meant that the inhibitor molecule was chaotic before it was adsorbed on the surface of mild steel. With the reaction, the inhibitor molecule was adsorbed on the surface of mild steel in an orderly manner (chaotic degree decreases).46,47


![[thin space (1/6-em)]](https://www.rsc.org/images/entities/char_2009.gif) |Z| vs. log
|Z| vs. log![[thin space (1/6-em)]](https://www.rsc.org/images/entities/char_2009.gif) f is −1, and the maximum phase angle is −90°. It was observed from Table 6 that the value of slope (S) gradually approached 1 (0.37–0.70), and the phase angles (α) were close to 90° (40.3–65.3) in the intermediate frequency range. This illustrated that the corrosion inhibition effect of RLE was outstanding for mild steel in a 0.5 M H2SO4 solution. However, the slopes (S) and phase angles (α) deviated from those of the ideal capacitance at the intermediate frequency. The main reason is the deviation from the ideal intermediate frequency capacitance.60
f is −1, and the maximum phase angle is −90°. It was observed from Table 6 that the value of slope (S) gradually approached 1 (0.37–0.70), and the phase angles (α) were close to 90° (40.3–65.3) in the intermediate frequency range. This illustrated that the corrosion inhibition effect of RLE was outstanding for mild steel in a 0.5 M H2SO4 solution. However, the slopes (S) and phase angles (α) deviated from those of the ideal capacitance at the intermediate frequency. The main reason is the deviation from the ideal intermediate frequency capacitance.60


