DOI:
10.1039/C9RA04211C
(Paper)
RSC Adv., 2019,
9, 22355-22365
Submicron fibers as a morphological improvement of amorphous zirconium oxide particles and their utilization in antimonate (Sb(V)) removal†
Received
4th June 2019
, Accepted 4th July 2019
First published on 18th July 2019
Abstract
Mesoporous and large surface area zirconium oxide aggregate granules with good adsorption properties were synthesized using a simple precipitation method. Since utilization of these small and fragile particles is considered rather difficult in larger scale column operation, the product was formed into a fibrous form to improve its usability. The submicron fibers were obtained from an optimized electroblowing synthesis that resulted in elastic and uniform fibers with a tetragonal structure and high length-to-diameter ratio. In antimonate (Sb(V)) adsorption experiments, the higher calcination temperature (350 °C) of the fibers did not seem to decrease the Sb(V) adsorption capacity excessively since the high theoretical adsorption capacities were 113 mg g−1 and 58 mg g−1 for the aggregate and fibers, respectively. Both materials had fast kinetics, fibers being faster in the beginning of the reaction. Moreover, both materials offered efficient Sb(V) removal in the studied pH range from 1 to 11 by reaching over 99.9% adsorption in the optimal pH range. X-ray absorption near edge spectroscopy (XANES) revealed that Sb(V) stays as pentavalent antimony after being adsorbed by these materials and based on the isoelectric point shifts in the zeta potential measurement, adsorption occurs mainly by an inner-sphere complexation reaction. Finally, our study showed that pressure buildup in a flow-through column packed with zirconium oxide fibers was significantly lower than in a column packed with aggregates. Thus, zirconium oxide aggregates can be formed into submicron fibers with enhanced column operation properties without a too large compromise in the adsorption properties.
1. Introduction
Zirconium oxide is a versatile and well-studied material with multiple applications, including as catalysts, gas sensors, ceramics and fuel cells.1–4 Zirconium oxide can be synthesized in amorphous, cubic, tetragonal and monoclinic forms, the stability and occurrence of which depend on crystallite size, dopants, synthesis pH and temperature.5–7 Monoclinic zirconium oxide is found to be stable below 1170 °C and cubic above 2370 °C whereas temperatures between 1170 °C and 2370 °C stabilize the tetragonal form.8 The tetragonal zirconium oxide can however exist at room temperature in a metastable state that can be achieved for instance by limiting the crystal size to below 30 nm.9 In ceramics, the tetragonal structure is often preferred due to its superior mechanical properties such as fracture toughness, and strength.10
In addition to different crystal structures, zirconium oxide can be prepared in different morphologies, such as nanopowders, microspheres, grains, films and fibers.7,11–15 One method to produce nanocrystalline zirconium oxide is a precipitation method in which zirconium precursor, which is first dissolved into acid, is precipitated with base causing the formation of small colloids that can stay monodispersed or form aggregates during a drying process.16 Precipitated materials usually have a large specific surface area and porosity but the use of such small particles is rather challenging in some applications, for example, in fixed-bed columns.17 In industrial scale columns, pressure surges are breaking these fragile aggregate particles leading to column blockages and leakages of nanoparticles out of the columns. This problem could be avoided by formatting zirconium oxide into a fiber. Nano- and submicron fibers are often produced by a spinning technique including electro- and blowspinning, and eletroblowing that are applicable to the synthesis of various materials including zirconium oxide.18,19 The electroblowing synthesis enhances the production rate of fibers compared to electrospinning since additional gas flow induces faster evaporation of solvents that enables greater solution feeding rates.20 The production rate of fibers can be further increased by adding needles to the synthesis unit. Nanofibers in general show some excellent properties such as high specific surface area and good mechanical strength, and handling of woven fiber mats is simple compared to small particles.14 The forementioned different morphologies and structures have a determining impact on surface properties, such as specific surface area, porosity and pore size, which are the main factors contributing to the adsorption through available sorption sites.11,21
Contamination of toxic Sb in natural waters have raised concerns of its effects on human health and environment. Weathering of rock minerals, soil runoff and anthropogenic sources such as mining and smelting industries are releasing antimony into the natural waters.22 In non-polluted areas, a typical antimony concentration in water is less than 1 μg L−1 but near industrial areas the concentration can be over 100 times that of the natural level.22 Antimony is a metalloid, resembling arsenic and phosphorus, that occurs in two oxidation states: antimonite (Sb(III)) and antimonate (Sb(V)), in natural waters from which the latter is the prevalent in oxidizing conditions. In the oxidizing environment, Sb(III) is thermodynamically unstable, but Sb(V) have also been found from anoxic systems.22 Sb(V) has two hydroxyl species: Sb(OH)5 that exists below pH 2.7 and Sb(OH)6− that is a prevalent above this pH-value.23 This makes Sb(OH)6− a more important species from the uptake point of view. Respectively, three hydroxyl species of Sb(III) in the order of increasing pH are Sb(OH)2+, Sb(OH)3 and Sb(OH)4−.23 As a more soluble and mobile species, Sb(V) was selected for this study.
Because of the hazardous nature of antimony, several authorities have set maximum concentration limits of antimony for drinking water. Commonly, the maximum level for antimony in drinking water is regulated to 5–6 μg L−1.24–26 Therefore, several methods for separation of antimony have been suggested including coagulation, liquid extraction, membrane separation, electrochemical methods, adsorption and bioremediation.27–32 For years, antimony separation has been conducted with coagulation method that combines Fe or Al salt precipitation and adsorption. The more common Fe precipitation has effective particularly for Sb(III) but coexisting anions such as PO43− and SO42− are hampering already weaker separation of Sb(V).33 The removal efficiency could be improved by using selective adsorption since adsorption is a simple, efficient and inexpensive method for metal separation from water, especially on trace level concentrations.27
Some zirconium based materials such as zirconium oxide,12,26 iron-zirconium bimetal oxide,26 zirconium oxide decorated carbon nanofibers,14 zirconium-based metal–organic framework34 and Zr-loaded saponified orange waste35 are proven to be efficient Sb(V) adsorbents. However, most of these materials are composites or hybrids that chemical and physical properties can greatly differ from those of pure zirconium oxide. In fact, zirconium oxide possesses several excellent properties as an adsorbent. It is practically insoluble over a wide range of pH and is resistant to strong reducing and oxidizing conditions. Moreover, as a metal oxide, zirconium oxide should have a vast amount of surface hydroxyl groups that are proposed to strongly interact with anions.21,26 The non-toxicity of zirconium oxide further enables its applicability in antimony removal, from industrial wastewater to daily drinking water purification.
Thus, in this study, we synthesized granular zirconium oxide aggregate material by using easy and inexpensive precipitation method that is known to result in material with excellent adsorption capabilities. The morphology of the product was then improved by electroblowing zirconium oxide into submicron fibers. The electroblowing synthesis is more challenging but fibers should provide a high specific surface area indicating good adsorption capacity, and better usability in columns due to its mechanical performance. Hence, our goal is to find out, if a well-working precipitated zirconium oxide grains can be formatted into submicron fibers without losing too much of its great adsorption capabilities. Thus, Sb(V) adsorption properties of granular and fibrous zirconium oxides are compared with each other by the same author resulting a coherent comparison between materials. The main focus is to study morphology, structure and surface properties of these two materials and their influence on Sb(V) adsorption capability. Our study investigated the effect of pH, contact time and competing ions on Sb(V) adsorption and determined the Sb(V) adsorption capacities of the materials. In addition, pressure buildups in the columns packed with fibers and aggregate grains was examined.
2. Materials and methods
2.1 Chemicals
Sb2O5 (99.995% trace metal basis) was purchased from Sigma-Aldrich and NaNO3 (>99%) from VWR Chemicals. NaHCO3, Na2SO4 and H2NaPO4 used in competition experiments were analytical grade. A stock solution of 1000 mg L−1 Sb(V) was made by dissolving Sb2O5 in 4.5 M hydrochloric acid. Nitric acid (Romil SpA super purity, 67–69 wt%) and hydrochloric acid (Merck suprapur, 30%) were used for sample dilution for ICP-MS measurement. In all samples and solutions deionized water (Millipore, 18.2 MΩ cm at 25 °C) was used. Chemicals used in synthesis are listed as ESI, Section S1.†
2.2 Synthesis
Granular ZrO2. Granular ZrO2 (GZR) was synthesized by a precipitation method.12 In a typical batch, 45.8 g of ZrCl4 was dissolved into 2 L of 3 M HCl under constant stirring. ZrO2 was precipitated by slowly adding concentrated ammonia until pH reached 7.8. The precipitate was let to settle for 30 min after which supernatant was discarded. The product was washed several times with deionized water until the interface between the slurry and supernatant remained turbid after settling for 1 h. The separated slurry was dried in an oven at 70 °C for 4 days. The synthesis resulted in approximately 30 g of final product that was ground and sieved through a 74 μm (200 mesh) sieve for experiments.
Fibrous ZrO2. ZrO2 fibers (FZR) were produced by electroblowing a solution containing ZrOCl2 and polyvinylpyrrolidone (PVP) followed by calcination. In the synthesis, 34 g of ZrOCl2·8H2O was first dissolved in 91 mL of water and the obtained solution was mixed with 12 wt% PVP/ethanol solution. The fibers were prepared by electroblowing using a self-made apparatus based on the work by Holopainen and Ritala.36 Compressed air was led to a gas–water separator followed by a pressure regulator and finally through a 2.5 mm metal adapter. An A 27 G (0.21 mm ∅) needle was placed at the center of the adapter. Additional gas was fed to system from the both sides of the apparatus to keep the relative humidity below 15% at 22 ± 1 °C. The gas flow rate was adjusted to 40 NL min−1 using a gas flow meter. After the appropriate conditions were achieved the high-voltage power source connected to the metal adapter was switched on to set the potential between the inlet and collector at 15 kV and the PVP/Zr solution was pumped through the needle with a syringe pump. The fibers were collected on grounded cylindrical side and vertical back collectors made of steel grid. The prepared fibers were calcined in air at 350 °C for 6 h with a heating rate of 5 °C min−1.
2.3 Characterization
Composition analysis. Thermogravimetric and differential scanning calorimetry analysis (TGA-DSC, Netzsch STA 449 F3 Jupiter) was conducted to determine the purity of zirconium oxide materials. Products were heated from 40 to 1000 °C with a heating rate of 10 °C min−1 in a helium atmosphere. The vaporized gases were analyzed with an Agilent 7890B/5977A gas chromatograph-mass selective detector (GC-MSD) system.
Morphology and structure analysis. Morphology of the zirconium oxide materials was analyzed using a field emission scanning electron microscope (FESEM, Hitachi S-4800). Samples were coated with a 4 nm thick Au–Pd alloy before imaging. Crystal structures of the products were analyzed using a powder X-ray diffraction (XRD) technique (PANalytical X'Pert 3 Powder, Cu Kα1). Data was collected in a continuous mode with a step size of 0.01° using a 10 s counting time per step with a 2θ range from 5° to 70°. A specific surface area and porosity of the materials were analyzed using a Brunauer–Emmett–Teller (BET) N2 adsorption measurement (Micrometrics ASAP 2020). Samples were degassed by heating before the analysis after which N2 adsorption measurement was conducted at −196 °C by adsorption/desorption method.
Titration. ZrO2 materials were titrated using a batch method in which 20 mg of adsorbent was mixed with 10 mL of water. Different amounts (0–175 μL) of 0.1 M NaOH were added into the samples and the samples were agitated for 24 h in a constant rotary mixer (50 rpm) before pH measurement. The NaOH additions and the pH measurements were repeated until the pH reached a constant value.
Zeta potential. Isoelectric points (IEP) were determined with a Malvern Zetasizer Nano ZC. The experiment was conducted by a batch method in which 20 mg of GZR or FZR was mixed with 10 mL of 0.01 M NaNO3 or solutions containing 10 or 40 mg L−1 Sb(V) in addition to 0.01 M NaNO3. The pH of each sample was set separately into a range of 4 to 10 using a small volume of HCl or NaOH solution. The samples were equilibrated for one day followed by equilibrium pH measurement. The samples were let to settle for a few minutes before determination of equilibrium potential with the Zetasizer.
XANES. Both FZR and GZR were loaded with 30 mg g−1 Sb(V) at pH 4.0 by mixing 50 mg adsorbent with 50 mL of 30 mg L−1 Sb(V) solution. The samples were equilibrated 24 h before the phase separation. The concentration of Sb(V) in supernatant was measured to ensure loading degree of the samples and the adsorbents were dried at 35 °C. The dried samples were mixed with cellulose and pressed into pellets. X-ray adsorption near edge structure (XANES) Sb K-edge spectra of Sb loaded GZR and FZR were measured together with Sb2O5 and Sb2O3 standard samples at PETRA III P64 beamline, The Deutsches Elektronen-Synchrotron (DESY), Germany.37 The spectra was collected in a fluorescence mode at −196 °C and a Si311 monochromator was used.
2.4 Batch adsorption methods
Effect of pH. The effect of pH on Sb(V) sorption on the materials was examined over the pH range from 1 to 11. Batch samples were prepared using 2 g L−1 adsorbent concentration, and 10 mg L−1 (0.082 mmol L−1) Sb(V) in 0.01 M NaNO3 solution. The pH of the solution was adjusted with a small amount of either NaOH or HCl. The samples were equilibrated for 24 h before phase separation that was carried out by centrifugation at 2100g for 10 min followed by syringe filtration (Acrodisc LC 0.2 μm PVDF). Equilibrium pH values were determined after the phase separation. Sample aliquots were taken and diluted with an acid mixture of HCl and HNO3 for Sb concentration measurement with an Agilent 7800 ICP-MS.
Kinetics. The adsorption kinetics were studied by weighting 200 mg of zirconium oxide materials into beakers and mixing them with 100 mL of solution containing 10 mg L−1 Sb(V) in 0.01 M NaNO3 (pH 4.0). A suspension was constantly stirred with a magnetic bar to keep it homogeneous. Samples were taken at specific time intervals, the first sample being immediate and the last one being taken after one week. The samples were phase separated by a short centrifugation (2100g) and syringe filtration (0.2 μm) so that the separation would be as fast as possible.
Effect of coexisting ions. The influence of coexisting ions or complexes NO3−, H2CO3, SO42− and H2PO4− on Sb(V) uptake were studied in four different concentrations 0, 1, 5 and 10 mM. The same Sb(V) and adsorbent concentrations (10 mg L−1 and 2.0 g L−1, respectively) were used as before and pH was adjusted to 4.0 with either HCl or NaOH. Samples were equilibrated 24 h before the phase separation.
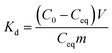
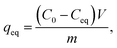
Adsorption isotherms. The effect of temperature to adsorption capacity was investigated by isotherm method in three temperatures 13, 22 and 33 °C. In this experiment, adsorbent dose of 0.25 g L−1 was used and initial Sb(V) concentration was ranging from 1 to 30 mg L−1 in 0.01 M NaNO3 at pH 4.0. The solutions were balanced to wanted temperature before mixing with the adsorbents. The mixed samples were equilibrated in these same temperatures 24 h before the phase separation that was conducted in the same manner as described earlier.Results of the pH and kinetic studies were presented as distribution coefficients, Kd, as a function of pH or time. The distribution coefficient describes the distribution of elements between solid and solution phases. Kd was calculated using eqn (1):
| |
 | (1) |
where
Kd (mL g
−1) is the distribution coefficient,
C0 and
Ceq are the initial and equilibrium concentrations (mg L
−1) respectively,
V is the sample volume (mL) and
m is the mass (g) of dry adsorbent. The Sb(
V) adsorption capacities of the materials were calculated with
eqn (2):
| |
 | (2) |
where
qeq (mg g
−1) is the adsorption capacity, and the other factors are the same as in the previous equation but the volume unit is liters (L).
2.5 Pressure test
Pressure buildup in the columns packed with 0.25 g of GZR or FZR was determined with solution feeding rates of 5, 25, 50 and 75 mL h−1 that were controlled with a peristaltic pump. Both GZR and FZR were packed into low-pressure Bio-Rad Econo-columns that were 0.7 cm in diameter. Columns were connected to a pressure sensor and pressure buildup was measured 30 minutes after starting the peristaltic pump. Pressure was released before moving on the next feeding rate.
3. Results and discussion
3.1 Structural and chemical analysis
The synthesis pH of GZR was set to 7.8 that would favor the formation of tetragonal structure of zirconia which is well known to be the active phase considering the materials sorption properties.38 The random agglomeration of small crystals resulted in precipitation of a course, hard cake in a slightly pink color (Fig. 1a and b). The obtained 30 g of hydrous zirconium dioxide (ZrO2·1.1H2O according to TG analysis, Fig. S1†) released some CO2 that was most probably absorbed from the air during the synthesis (TGA-MS graph, Fig. S1†). A clear exothermic peak at 450 °C appears in DSC due to the formation and orientation of tetragonal crystallites and broader peak above 800 °C indicating phase transformation to monoclinic.39
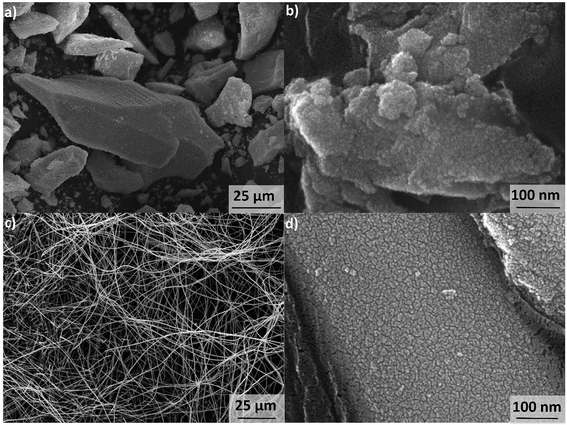 |
| | Fig. 1 SEM images of GZR (a) and (b) and FZR (c) and (d). | |
The spun fiber mats retained their physical form after the calcination (350 °C) and formation of zirconium dioxide. The mats showed some elasticity when bended indicating mechanical strength, but the product was relatively easy to grind into a powder. The low magnification SEM image points out that fibers are intact, smooth and uniform with a mean diameter from 300 to 500 nm (Fig. 1c). The fibers have a cylindrical shape with a high length to diameter ratio, and no beads or fused fibers are visible. However, with high magnification the fiber shows surface roughness that could arise from crystallite structure of the fiber (Fig. 1d). The total mass loss of the calcined fiber in TGA is only 2.7% from which approximately a half is the loss of readsorbed water between 40 and 200 °C (TGA from 40 to 200 °C, Fig. S2†). Above 400 °C, where PVP starts to decompose, a 1.5% weight loss was measured that is linked to burning of polymer residues.40 Moreover, FZR shows CO2 releases: first at 500 °C and later at 900 °C and 1000 °C (TGA-MS graph, Fig. S2†). Since the total mass loss during the analysis is rather small, the product can be regarded as relatively pure. Nevertheless, this minor residue could weaken materials adsorption properties by blocking the material's surface. However, a relatively high porosity and good adsorption capacity in the isotherm experiment was observed indicating that residual polymer did not significantly interfere with adsorption. A strong increase in the DSC was observed above 800 °C indicating transformation of tetragonal crystallites to monoclinic (Fig. S2†).
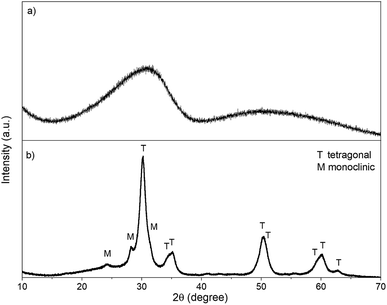
XRD. Due to the lack of long-range orientation of crystals in GZR, crystal structure could not be verified by XRD because only a very broad peak at the 2θ angle of ∼30.5° is observed (Fig. 2). In addition, a Raman spectroscopy analysis of the GZR (and FZR) was unsuccessful because of strong fluorescence induced by the material. However, Deshmane and Adewuyi39 suggested that the broad peak in XRD would belong to the extremely small tetragonal phase nuclei. Unlike GZR, FZR is showing a crystalline structure with some broadening in the diffractogram. The difference between materials is expected because GZR was annealed only at 70 °C whereas FZR was made by calcining at 350 °C. Based on the peak intensities of FZR, tetragonal phase is the dominant structure. However, burning of PVP has probably raised the local temperature of material above the set 350 °C resulting in monoclinic peaks with lower intensities since ZrO2 is known to transforms from amorphous to tetragonal and finally to monoclinic structure during the calcination process with increasing temperature.15,41,42 The broadening of the FZR peaks is probably due to a small crystallite size of ZrO2 crystallites in the material but the peaks are nonetheless sharp compared to the GZR peak. A rough estimation of the crystallite sizes was calculated using Scherrer's equation. By using a shape factor of 0.9, the approximate crystallite size of GZR would be 0.77 nm that is significantly smaller than 7.4 nm crystallite size of FZR.
 |
| | Fig. 2 The XRD pattern of (a) GZR and (b) FZR. | |
BET. The specific surface area, total pore volume and pore diameter were determined for GZR and FZR using the BET method, Table 1. Even if it could be assumed that small diameter fibers have a larger specific surface area than relatively big particles, the case is opposite. GZR is an aggregate of small crystals whereas fiber has a rather uniform surface and a larger crystallite size. In addition, the aggregate structure of GZR increases its porosity compared to dense FZR. Despite the significant differences between the materials, their pore diameters are almost the same and classified as mesopores. Because of GZR's larger pore volume and specific surface area it could provide better adsorption capacity. The specific surface area of GZR, 248 m2 g−1, is in a good agreement with literature values (53–321 m2 g−1) of products synthesized with a similar method.43–45 Correspondingly, the specific surface area of FZR, 72 m2 g−1, is in the higher end of literature values (5.9–106.3 m2 g−1) for pure and doped zirconium oxide nanofibers.14,41,46–48
Table 1 Specific surface area, pore volume and pore diameter of GZR and FZR
| |
ABETa (m2 g−1) |
Vtotalb (cm3 g−1) |
Dporec (nm) |
| ABET: BET surface area. Vtotal: total volume of pores determined by the BET desorption method. Dpore: average pore diameter determined from BET desorption branch. |
| GZR |
248 |
0.103 |
3.3 |
| FZR |
72 |
0.055 |
3.3 |
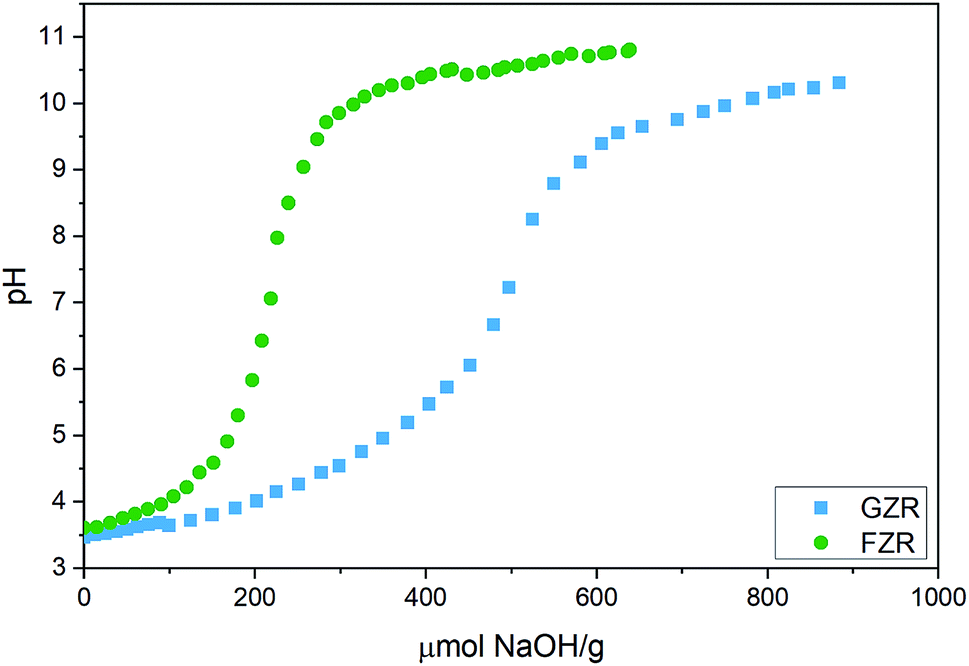
Titration. Potentiometric titration was conducted to determine acidic nature of the zirconium oxide materials, Fig. 3. Acid dissociation constants, pKa, of GZR and FZR, which are the pH values at half inflection points, were calculated from the titration data. The pKa1 values differ only slightly, being 4.1 for FZR and 4.3 for GZR, which are close to the literature value 4.0 for deprotonation reaction of ≡ZrOH2+ group.49 According to these values, FZR is a stronger acid but only with a small difference. In contrast, inflection points of GZR and FZR that are at 505 and 220 μmol g−1, respectively, differ considerably. Based on the difference between these points, GZR has significantly more surface hydroxyl groups than FZR that is probably a result of the higher specific surface area of GZR. The high amount of OH groups and the larger specific surface area together enable a higher adsorption capacity of GZR. When amount of hydroxyl groups are applied together with the specific surface areas, hydroxyl site densities can be calculated for GZR (1.2 sites per nm2) and FZR (1.8 sites per nm2).
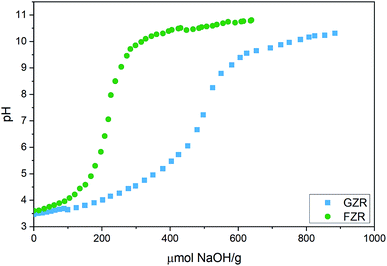 |
| | Fig. 3 Potentiometric titration curve of GZR and FZR in deionized water plotted as a function of added NaOH per gram of dry adsorbent. | |
Zeta potential. The zeta potentials of unloaded GZR and FZR were measured as well as the zeta potentials of GZR and FZR loaded with 5 mg g−1 and 20 mg g−1 of Sb(V), Fig. 4. The zeta potential changes as a function of pH due to protonation and deprotonation reactions of surface ≡ZrOH groups as seen below:49,50| |
≡ZrOH2+ ![[left over right harpoons]](https://www.rsc.org/images/entities/char_21cb.gif) ≡ZrOH + H+ ≡ZrOH + H+
| (3) |
| | |
≡ZrOH ≡ZrO− + H+
| (4) |
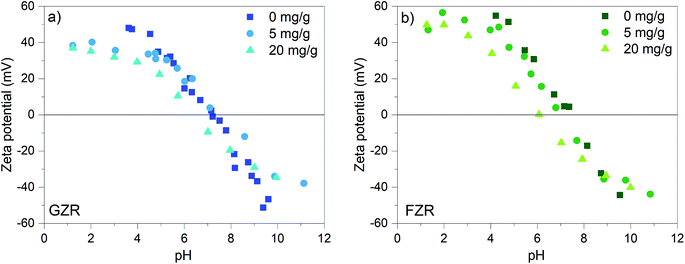 |
| | Fig. 4 Zeta potential (mV) of GZR and FZR loaded with 0, 5, and 20 mg g−1 Sb(V) as a function of pH in 0.01 M NaNO3, after 24 h equilibration time. | |
At low pH, the surface groups are positive ≡ZrOH2+ and in alkaline conditions the surface charge is negative because of ≡ZrO− groups. At the isoelectric points (IEP), the surface group charges are in balance and the net charge of the material is zero. The isoelectric point of FZR and GZR in 0.01 M NaNO3 are at pH 7.4 and 7.2, respectively, which are in the typical range from 4 to 11 observed for ZrO2.51 By loading the materials with 5 mg g−1 of Sb(V), the IEP of FZR decreases slightly compared to unloaded material but no difference can be observed in the case of GZR. When materials were loaded with 20 mg g−1 of Sb(V), the IEP shift is more obvious and visible for both materials. The IEP of FZR with 20 mg g−1 Sb(V) loading is 6.0 and that of GZR is 6.2. The observed decrease of the IEP value during adsorption is proposed to be due to an inner-sphere complexation of Sb(OH)6−.26,52,53 Essington and Stewart54 suggested that Sb(V) adsorption on gibbsite, Al(OH)3, would happen through both inner- and outer-sphere complexation reactions (5) and (6), respectively, presented below for zirconia:
| | |
≡ZrOH + Sb(OH)6− ≡ZrOSb(OH)5− + H2O
| (5) |
| | |
≡ZrOH + H+ + Sb(OH)6− ≡ZrOH2+–Sb(OH)6−
| (6) |
where the charge of surface groups changes in the chemical inner-sphere complexation reaction whereas the charge in the physical outer-sphere complexation remains unchanged.
XANES. To discover the oxidation state of Sb after adsorption, XANES Sb K-edge spectra of Sb2O5 and Sb2O3 standards and 30 mg g−1 Sb loaded GZR and FZR samples were measured, Fig. 5. In the measured spectra, the absorption edge of Sb2O3 is evidently lower than that of Sb2O5. The absorption spectra of Sb(V) loaded samples seem similar to Sb2O5 standard indicating that the oxidation state of Sb(V) remains unchanged during adsorption on these materials. Therefore, a thought about reduction of Sb(V) to Sb(III) that has been reported for example in the case of zero-valent iron can be excluded.55,56
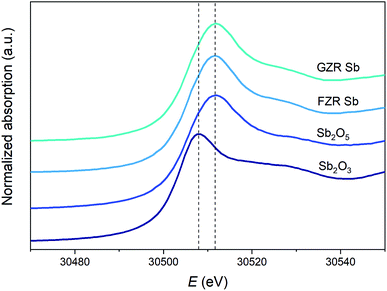 |
| | Fig. 5 Normalized XANES Sb K-edge spectra of Sb2O5 and Sb2O3 references, and 30 mg g−1 Sb loaded GZR and FZR samples. | |
3.2 Sb(V) uptake
The effect of pH. The uptake properties of adsorbents can strongly depend on pH conditions. For that reason the effect of pH on Sb(V) adsorption properties of both materials was investigated. The optimal pH for the Sb(V) uptake is from 2 to 6 and from 2 to 7 for FZR and GZR, respectively, Fig. 6. At this pH range they perform at an excellent level of Sb(V) uptake by reaching Kd over 600![[thin space (1/6-em)]](https://www.rsc.org/images/entities/char_2009.gif) 000 mL g−1. In fact, the equilibrium Sb(V) concentration was below the ICP-MS detection limit of 0.07 μg L−1 with almost all the samples in this pH range. At this optimal pH range, adsorption is facilitated by electrostatic attraction between positively charged adsorbent surface and negatively charged Sb(OH)6−. Below pH 2, Kd value decreases towards more acidic conditions, that can be attributed to electrically neutral Sb(OH)5 species that becomes prevalent instead of Sb(OH)6−. A decrease of the Kd as a function pH in the alkaline end can be explained by gradually emerging negative surface charge of the materials that repulses the prevailing Sb(OH)6− species, Fig. 4 and 6. However, the rising pH do not totally prevent adsorption but probably increases an energy barrier between Sb(OH)6− and the negatively charged surface slowing down the adsorption reaction.
000 mL g−1. In fact, the equilibrium Sb(V) concentration was below the ICP-MS detection limit of 0.07 μg L−1 with almost all the samples in this pH range. At this optimal pH range, adsorption is facilitated by electrostatic attraction between positively charged adsorbent surface and negatively charged Sb(OH)6−. Below pH 2, Kd value decreases towards more acidic conditions, that can be attributed to electrically neutral Sb(OH)5 species that becomes prevalent instead of Sb(OH)6−. A decrease of the Kd as a function pH in the alkaline end can be explained by gradually emerging negative surface charge of the materials that repulses the prevailing Sb(OH)6− species, Fig. 4 and 6. However, the rising pH do not totally prevent adsorption but probably increases an energy barrier between Sb(OH)6− and the negatively charged surface slowing down the adsorption reaction.
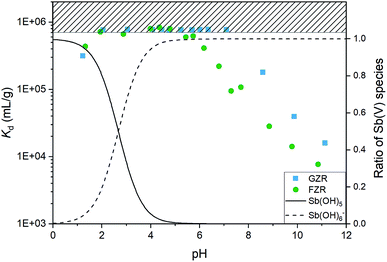 |
| | Fig. 6 The distribution coefficient (Kd) of Sb(V) after 1 day equilibrium time for GZR and FZR as a function of pH in 0.01 M NaNO3 and the relative abundance of Sb(OH)5 and Sb(OH)6− species obtained from PHREEQC modelling utilizing sit-database of the program. | |
The decrease of the Kd value in GZR system starts at the IEP when the net charge of the surface becomes negative. Even though the Kd value decreases from pHIEP onwards, GZR performs on good level since it is able to uptake still 99.8% (Kd 180000 mL g−1) of Sb(V) at pH 8 and even in the most alkaline sample 97.0% (Kd 16000 mL g−1). Different from GZR, the Sb(V) uptake of FZR decreases already below material's pHIEP. The decrease could be attributed to larger surface coverage on FZR surface causing greater repulsion between adsorbed and solute Sb(OH)6−. Despite the possible repulsion, FZR is able to uptake even 99.5% (Kd 108000 mL g−1) at pH 8 and 93.8% (Kd 7700 mL g−1) at pH 11.
Kinetics. An adsorption kinetic study was conducted to determine adsorption rates of Sb(V) on GZR and FZR surfaces, Fig. 7. The adsorption kinetics is very fast for both materials, FZR being slightly faster in the beginning of the experiment. FZR achieves 99% (Kd > 2000000 mL g−1) adsorption in 2 min and GZR in 11 min, and they reach the detection limit, 0.025 μg L−1, after 7 and 2 hours, respectively. On this basis, both materials are suitable for a continuous purification process where fast kinetics is essential for an effective separation. At low Sb concentrations where high capacity is unnecessary, FZR probably performs better than GZR, but when a higher adsorption capacity is required, GZR should provide more efficient removal.
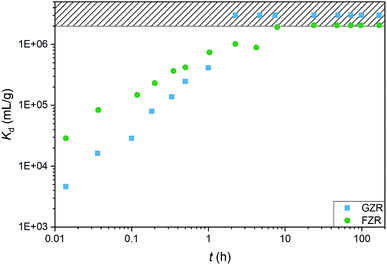 |
| | Fig. 7 The Sb(V) adsorption kinetics on GZR and FZR presented as Kd (mL g−1) as a function of time (h) in 10 ppm Sb(V) and 0.01 M NaNO3 at pH 4.0 ± 0.2. | |
The kinetic data was analyzed according to the pseudo-first and pseudo-second-order rate laws in their nonlinear forms.57 The pseudo-first-order equation can be presented as
| | |
qt = qeq[1 − exp(−k1t)]
| (7) |
where
t (min) is time,
k1 (min
−1) is the pseudo-first-order rate constant,
qt (mg g
−1) is amount of adsorbed Sb(
V) at a given time and
qeq (mg g
−1) is an equilibrium capacity. Adsorption following the pseudo-first-order model kinetics is supposed to be limited by an intraparticle diffusion.
58 Whereas, in the pseudo-second-order kinetics, surface adsorption is assumed to be the rate limiting step, where adsorption is due to a chemical interaction between the adsorbate (Sb(OH)
6−) in a solution phase and the adsorbent surface.
58,59 The pseudo-second-order rate kinetics can be expressed as
| |
 | (8) |
with
k2 (g mg
−1 min
−1) pseudo-second-order rate constant. When the results are presented as
qt as a function of
t,
eqn (7) and
(8) can be fitted to the graph from which the rate constants can be calculated. Fittings are given as ESI, Fig. S3.
† The kinetic parameters calculated from the data before reaching the detection limit are presented in Table S1 as ESI.
† The high coefficient of determination (
R2) of the pseudo-second-order rate model (
R2 is 0.988 for GZR and 0.992 for FZR) indicates it to be more probable than the pseudo-first-order reaction (
R2 is 0.920 for GZR and 0.887 for FZR). This indicates chemisorption to possibly be the rate limiting step in the Sb(
V) adsorption process where sorption takes place by exchanging or sharing electrons between the sorbent and adsorbate.
58,60
Adsorption capacity. The Sb(V) adsorption capacity was determined by an isotherm method for GZR and FZR at pH 4.0 ± 0.1 in the 1–30 mg L−1 Sb(V) solution, Fig. 8. A slight increase in pH was observed during the experiment indicating release of OH− ions into solution that could be caused by inner-sphere complexation or ligand exchange reaction. At low equilibrium concentration, the adsorption capacity increases strongly when the concentration increases and at higher concentrations the adsorption capacity approaches the maximum capacity asymptotically. Moreover, temperature affects Sb(V) adsorption on GZR by increasing adsorption capacity with the increase of temperature, indicating an endothermic adsorption process or enhanced intraparticle diffusion. In contrast to GZR, Sb(V) adsorption on FZR is practically unaffected by the temperature. The difference between the capacities of GZR (113 mg g−1) and FZR (58 mg g−1) at 22 °C could originate from the higher calcination temperature of FZR. High calcination temperatures are known to increase crystallite size and thereby decreasing the specific surface area and porosity leading to the lower adsorption capacities. Both Langmuir and Freundlich equations, numbered as (9) and (10), respectively, were fitted to the data series to obtain adsorption parameters:61| |
 | (9) |
where qeq (mg g−1) is the adsorption capacity and Ceq (mg L−1) is the equilibrium concentration of Sb(V) in both equations. The Langmuir parameter qm (mg g−1) is the maximum Sb(V) adsorption capacity and kL (mg L−1) is an adsorption equilibrium constant. The kF (g mg−1 L−1) is the Freundlich adsorption constant and n is an exponential parameter. For the favorable adsorption reaction, the n parameter is usually between 1 and 10. The analyzed parameters for adsorption are given in Table 2 together with the coefficient of determination (R2).
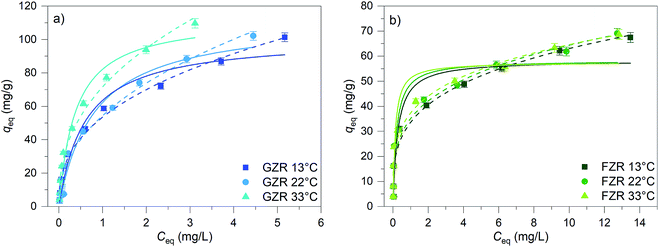 |
| | Fig. 8 The Sb(V) isotherms of GZR and FZR at pH 4.0 ± 0.1 after 24 h equilibrium time at 13, 22 and 33 °C. The initial concentration of Sb(V) was 1–30 mg L−1 in 0.01 M NaNO3 and adsorbent concentration was 0.25 g L−1. Solid lines present Langmuir and dashed lines Freundlich fittings. | |
Table 2 Langmuir and Freundlich adsorption parameters for GZR and FZR obtained from Sb(V) isotherms at 13, 22 and 33 °C
| |
T (°C) |
Langmuir |
Freundlich |
| qm (mg g−1) |
kL (L mg−1) |
R2 |
kF (g mg−1 L−1) |
n |
R2 |
| GZR |
13 |
101 |
1.7 |
0.956 |
54 |
2.6 |
0.989 |
| 22 |
113 |
1.2 |
0.947 |
54 |
2.3 |
0.971 |
| 33 |
113 |
2.6 |
0.969 |
72 |
2.5 |
0.982 |
| FZR |
13 |
58 |
3.9 |
0.885 |
34 |
3.7 |
0.950 |
| 22 |
58 |
5.1 |
0.887 |
35 |
3.8 |
0.959 |
| 33 |
58 |
8.1 |
0.873 |
37 |
4.2 |
0.966 |
A high correlation with the Langmuir model is an indication of constant adsorption site energy and asymptotic approach of the full monolayer surface coverage at high concentrations whereas the empirical multilayer Freundlich model assumes that the adsorbent has different adsorption sites.62 The R2 values of model fittings show that Freundlich model describes Sb(V) adsorption better than Langmuir model suggesting heterogeneous adsorption. However, as Freundlich model cannot be used to obtain the theoretical maximum adsorption capacity, the theoretical capacities were based on the Langmuir parameter qm that is 113 mg g−1 (0.928 mmol g−1) for GZR and 58 mg g−1 (0.476 mmol g−1) for FZR at 22 °C. Because of the rather low correlation with the Langmuir model, an experimental adsorption capacity of FZR, 69 mg g−1, exceeds the result of Langmuir model fitting slightly. The capacity of FZR is in a good agreement with earlier Sb(V) adsorption studies on zirconium based materials such as zirconium oxide26 at pH 7.0, 55 mg g−1, zirconium oxide decorated carbon nanofibers14 at pH 7.0, 57 mg g−1, and iron-zirconium bimetal oxide26 at pH 7.0, 51 mg g−1. However, GZR shows even greater capacity towards Sb(V) being approximately twice that reported in literature for zirconium oxide.
From the results of the adsorption capacity experiment and the BET surface area measurement, a surface site density can be calculated. The surface site density of GZR is 2.3 sites per nm2 and that of FZR is 4.0 sites per nm2. The site density of FZR is higher but the larger specific surface area of GZR dominates the capacity difference observed in the adsorption isotherms. When the surface site densities are compared with the hydroxyl site densities presented before (1.2 sites per nm2 for GZR and 1.8 sites per nm2 for FZR) a significant difference can be observed. On this basis, adsorption cannot be explained only with reactions between Sb(V) and hydroxyl groups. It is likely that there are other kinds of reactive surface groups or mechanisms taking part in the adsorption process such as nucleation, reaction with non-hydrolyzed zirconium or oxygen vacancies.
Effect of coexisting ions. The coexisting ions and complexes can greatly affect Sb(V) adsorption properties of materials through a competitive adsorption. Therefore, the influence of NO3−, H2CO3, SO42− and H2PO4− on Sb(V) adsorption onto GZR and FZR were investigated, Fig. 9. Neither NO3− or H2CO3 notably decreased Sb(V) adsorption on either of the materials despite several times higher concentrations of NO3− and H2CO3 compared to Sb(V). Furthermore, HCl that was used in pH adjustment of the samples did not interfere with Sb(V) adsorption. The low interference caused by NO3− and Cl− on Sb(V) uptake is often observed26,34,35 since NO3− and Cl− ions are mainly retained by electrostatic attraction whereas Sb(V) is believed to form inner-sphere complexes with the ZrO2 surface. Moreover, the influence of SO42− on Sb(V) uptake was minor since the uptake was decreased from 100% to 99.5% in the case of FZR and for GZR the decrease was even smaller. The most significant competition was observed between H2PO4− and Sb(OH)6− since both antimony and phosphorus belong to the same elemental group 15 having resembling chemical properties. Su et al.21 observed that phosphate formed inner-sphere complexes on Ce0.2Zr0.8O2 surface and surface –OH groups had a major influence on phosphate removal. As our findings suggest the same adsorption behavior for Sb(V) on GZR and FZR, Sb(OH)6− and H2PO4− are most probably competing from the same adsorption sites resulting in lower uptake percentages of Sb(V). The observed decrease in the Sb(V) uptake was larger for FZR than GZR that could arise from differences in the amount of OH groups that is greater for GZR calcined in the lower temperature.
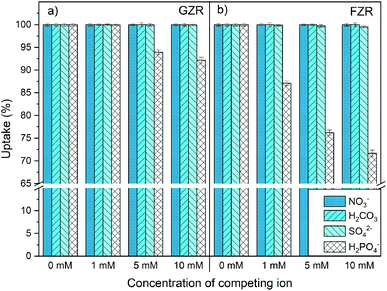 |
| | Fig. 9 Effect of 0–10 mM NO3−, H2CO3, SO42− and H2PO4− (prevalent species) on 10 mg L−1 Sb(V) adsorption onto (a) GZR and (b) FZR at pH 4.0. | |
3.3 Pressure test
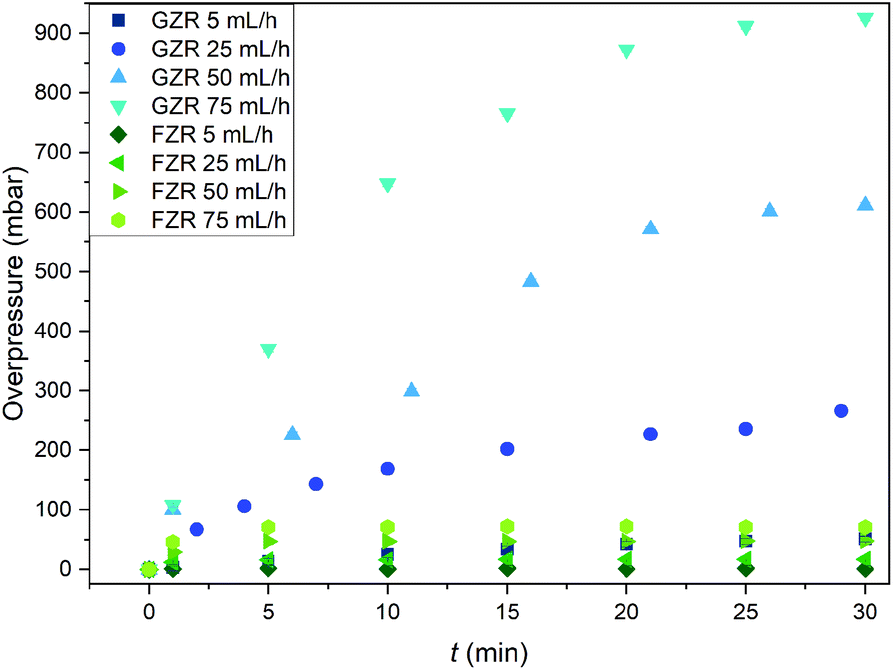
The pressure buildup in the GZR and FZR columns were measured to determine their functioning in packed bed columns since evolution of high pressures can cause severe problems in the purification process, Fig. 10. At the feeding rate of 5 mL h−1, which can be considered as a normal feeding rate for packed bed column of this size, the overpressure is low (50 mbar) for GZR and even lower for FZR. However, at higher feeding rates the column packed with GZR is generating significantly more backpressure than FZR. At the highest feeding rate, the overpressure in the GZR column is 930 mbar whereas the overpressure in the FZR column is only 70 mbar that is only small fraction compared to GZR. The difference originates from the physical form of the materials. Small <74 μm GZR particles are packing tightly in the column creating notably higher flow resistance than loosely packed self-supported FZR fibers that are forming 3D webs. Due to the lower flow resistance, formatting zirconia into the fiber could improve the column functioning by retaining low pressures even at higher flow rates. Furthermore, no breaking or fragmentation of the fibers was observed during the experiment that indicates material to be suitable for column separation even with high flow rates.
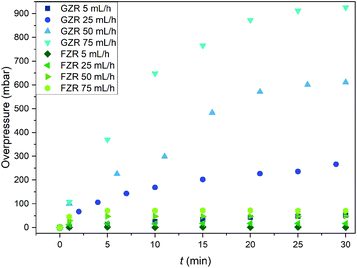 |
| | Fig. 10 The overpressure (mbar) generated in the columns packed with 0.25 g of GZR or FZR at solution feed rates of 5, 25, 50 and 75 mL h−1 during 30 min period. | |
4. Conclusions
In this study, two zirconium oxide materials grains and fibers were synthesized by precipitation and electroblowing methods, respectively, and products compared with each other. The precipitated zirconium oxide formed uneven aggregate grains with broad variation in size and shape that showed amorphous or nanocrystalline structure in XRD. In addition, elastic fibers with cylindrical shape and dominating tetragonal structure were obtained from electroblowing synthesis with an average diameter of 300–500 nm. Both synthesized zirconium oxide materials showed efficient Sb(V) removal in a wide pH range enabling their use in various conditions. Furthermore, good adsorption capacities were observed in the isotherm experiment in which adsorption capacity of GZR was higher than that of FZR. The good adsorption capacities are probably due to the large specific surface areas and porosities of the materials that were higher for GZR. Both materials had fast kinetics FZR being faster in the beginning of the reaction whereas GZR reached the detection limit earlier because of GZR's higher adsorption capacity. The materials followed pseudo-second-order rate model indicating chemical interaction between surface and Sb(V) ions that is supported by the IEP shift, negligible competition between NO3− and Sb(V) and the efficient Sb(V) uptake also in alkaline conditions where surface charge of the products are negative. This indicates that even though the product morphologies are greatly different from each other the suggested adsorption mechanism stays the same.
Hence, well-working zirconium oxide aggregate can be formatted into submicron fibers but the adsorption capacity is slightly weakened because of higher calcination temperature of fibers that decreases the specific surface area and porosity. The major benefit of FZR was its better mechanical stability, lower pressure buildup in the column and faster adsorption kinetics that could benefit antimony removal in dynamic column operation. Nonetheless, when considering application of these materials in industrial scale, further study is needed to determine optimal conditions for such process by column experiments. In addition, regeneration of the materials would extend materials usability and therefore should be investigated in the future. Overall, these two materials have a great potential to uptake Sb(V) from different water solutions.
Conflicts of interest
There are no conflicts to declare.
Acknowledgements
A XANES experiment of this study was carried out at PETRA III P64 at DESY, a member of the Helmholtz Association (HGF). We thank W. Caliebe for assistance in measurements at P64 beamline. This work was supported by University of Helsinki (Doctoral School in Chemistry and Molecular Sciences). The authors also acknowledge the support of Fortum Power and Heat Oy.
References
- Y. Shao, Z. Xu, H. Wan, H. Chen, F. Liu, L. Li and S. Zheng, J. Hazard. Mater., 2010, 179, 135–140 CrossRef CAS.
- A. V. Borhade, D. R. Tope and J. A. Agashe, J. Mater. Sci.: Mater. Electron., 2018, 29, 7551–7561 CrossRef CAS.
- R. Zhang, R. He, W. Zhou, Y. Wang and D. Fang, Mater. Des., 2014, 62, 1–6 CrossRef CAS.
- A. Malolepszy, M. Mazurkiewicz, L. Stobinski, B. Lesiak, L. Kover, J. Toth, B. Mierzwa, A. Borodzinski, F. Nitze and T. Wagberg, Int. J. Hydrogen Energy, 2015, 40, 16724–16733 CrossRef CAS.
- E. Djurado, P. Bouvier and G. Lucazeau, J. Solid State Chem., 2000, 149, 399–407 CrossRef CAS.
- M. Kogler, E. Koeck, S. Vanicek, D. Schmidmair, T. Goetsch, M. Stoeger-Pollach, C. Hejny, B. Kloetzer and S. Penner, Inorg. Chem., 2014, 53, 13247–13257 CrossRef CAS.
- D. G. Lamas, A. M. Rosso, M. S. Anzorena, A. Fernandez, M. G. Bellino, M. D. Cabezas, N. E. Walsoe de Reca and A. F. Craievichc, Scr. Mater., 2006, 55, 553–556 CrossRef CAS.
- M. Li, Z. Feng, G. Xiong, P. Ying, Q. Xin and C. Li, J. Phys. Chem. B, 2001, 105, 8107–8111 CrossRef CAS.
- R. Garvie, J. Phys. Chem., 1965, 69, 1238–1243 CrossRef CAS.
- K. Tsukuma and M. Shimada, J. Mater. Sci., 1985, 20, 1178–1184 CrossRef CAS.
- H. Tel, Y. Altas, F. Gur and A. Ugur, Radiochim. Acta, 2010, 98, 215–219 CAS.
- R. Koivula, R. Harjula and H. Manni, EP2243547A1, 2010.
- S. Starschich, T. Schenk, U. Schroeder and U. Boettger, Appl. Phys. Lett., 2017, 110, 182905 CrossRef.
- J. Luo, X. Luo, J. Crittenden, J. Qu, Y. Bai, Y. Peng and J. Li, Environ. Sci. Technol., 2015, 49, 11115–11124 CrossRef CAS.
- Y. Zhao, Y. Tang, Y. Guo and X. Bao, Fibers Polym., 2010, 11, 1119–1122 CrossRef CAS.
- H. Cui, Q. Li, S. Gao and J. K. Shang, J. Ind. Eng. Chem., 2012, 18, 1418–1427 CrossRef CAS.
- H. Cui, Y. Su, Q. Li, S. Gao and J. K. Shang, Water Res., 2013, 47, 6258–6268 CrossRef CAS.
- Z. Shi, J. Ju, Y. Liang, W. Huang, W. Kang and B. Cheng, Chem. Lett., 2017, 46, 131–134 CrossRef CAS.
- H. Liu, B. Liu, X. Wang, L. Zhu, C. Feng, G. Zhang and D. Xu, J. Sol-Gel Sci. Technol., 2015, 76, 482–491 CrossRef CAS.
- M. Pokorny, V. Rassushin, L. Wolfova and V. Velebny, Polym. Eng. Sci., 2016, 56, 932–938 CrossRef CAS.
- Y. Su, W. Yang, W. Sun, Q. Li and J. K. Shang, Chem. Eng. J., 2015, 268, 270–279 CrossRef CAS.
- M. Filella, N. Belzile and Y. Chen, Earth-Sci. Rev., 2002, 57, 125–176 CrossRef CAS.
- S. C. Wilson, P. V. Lockwood, P. M. Ashley and M. Tighe, Environ. Pollut., 2010, 158, 1169–1181 CrossRef CAS.
- USEPA, National Primary Drinking Water Regulations, 2009 Search PubMed.
- Council of the European Union, Council Directive 98/83/EC of 3 November 1998 on the quality of water intended for human consumption, 1998 Search PubMed.
- X. Li, X. Dou and J. Li, J. Environ. Sci., 2012, 24, 1197–1203 CrossRef CAS.
- G. Ungureanu, S. Santos, R. Boaventura and C. Botelho, J. Environ. Manage., 2015, 151, 326–342 CrossRef CAS.
- B. Sargar, M. Rajmane and M. Anuse, J. Serb. Chem. Soc., 2004, 69, 283–298 CrossRef CAS.
- X. Guo, Z. Wu and M. He, Water Res., 2009, 43, 4327–4335 CrossRef CAS PubMed.
- Y. Zhu, M. Wu, N. Gao, W. Chu, N. An, Q. Wang and S. Wang, J. Hazard. Mater., 2018, 341, 36–45 CrossRef PubMed.
- M. E. H. Bergmann and A. S. Koparal, J. Hazard. Mater., 2011, 196, 59–65 CrossRef CAS.
- Z. Qi, T. P. Joshi, R. Liu, Y. Li, H. Liu and J. Qu, J. Hazard. Mater., 2018, 343, 36–48 CrossRef CAS.
- M. Arnold, P. Kangas, A. Mäkinen, E. Lakay, N. Isomäki, G. Laven, M. Gericke, P. Pajuniemi, T. Kaartinen and L. Wendling, Mine Water Environ., 2019, 38, 431–446 CrossRef CAS.
- J. Li, X. Li, T. Hayat, A. Alsaedi and C. Chen, ACS Sustainable Chem. Eng., 2017, 5, 11496–11503 CrossRef CAS.
- B. K. Biswas, J. Inoue, H. Kawakita, K. Ohto and K. Inoue, J. Hazard. Mater., 2009, 172, 721–728 CrossRef CAS PubMed.
- J. Holopainen and M. Ritala, J. Eur. Ceram. Soc., 2016, 36, 3219–3224 CrossRef CAS.
- W. A. Caliebe, V. Murzin, A. Kalinko and M. Görlitz, AIP Conf. Proc., 2019, 2054, 060031 CrossRef.
- S. Ardizzone and C. Bianchi, J. Electroanal. Chem., 1999, 465, 136–141 CrossRef CAS.
- V. G. Deshmane and Y. G. Adewuyi, Microporous Mesoporous Mater., 2012, 148, 88–100 CrossRef CAS.
- Y. Du, P. Yang, Z. Mou, N. Hua and L. Jiang, J. Appl. Polym. Sci., 2006, 99, 23–26 CrossRef CAS.
- R. Ruiz-Rosas, J. Bedia, J. M. Rosas, M. Lallave, I. G. Loscertales, J. Rodriguez-Mirasol and T. Cordero, Catal. Today, 2012, 187, 77–87 CrossRef CAS.
- Z. Yu, C. Xu, K. Yuan, X. Gan, C. Feng, X. Wang, L. Zhu, G. Zhang and D. Xu, J. Hazard. Mater., 2018, 346, 82–92 CrossRef CAS.
- M. Alvarez and M. Torralvo, Colloids Surf., A, 1994, 83, 175–182 CrossRef CAS.
- V. Reddy, D. Hwang and J. Lee, Korean J. Chem. Eng., 2003, 20, 1026–1029 CrossRef CAS.
- W. Xia, F. Wang, X. Mu and K. Chen, Fuel Process. Technol., 2017, 166, 140–145 CrossRef CAS.
- J. Y. Koo, S. Hwang, M. Ahn, M. Choi, D. Byun and W. Lee, J. Am. Ceram. Soc., 2016, 99, 3146–3150 CrossRef CAS.
- Y. Sun, J. Qu, Q. Guo, J. Song, G. Wei, X. Xi, G. Hou and T. Qi, Ceram. Int., 2017, 43, 12551–12556 CrossRef CAS.
- H. Wang, Y. Duan and W. Zhong, ACS Appl. Mater. Interfaces, 2015, 7, 26414–26420 CrossRef CAS.
- J. Blackwell and P. Carr, J. Liq. Chromatogr., 1991, 14, 2875–2889 CrossRef CAS.
- S. Muhammad, S. T. Hussain, M. Waseem, A. Naeem, J. Hussain and M. T. Jan, Iran. J. Sci. Technol., Trans. A: Sci., 2012, 36, 481–486 CAS.
- D. Konrad, Ion exchangers, De Gruyter, Berlin, 1991 Search PubMed.
- S. Goldberg and C. Johnston, J. Colloid Interface Sci., 2001, 234, 204–216 CrossRef CAS.
- R. Liu, W. Xu, Z. He, H. Lan, H. Liu, J. Qu and T. Prasai, Chemosphere, 2015, 138, 616–624 CrossRef CAS.
- M. E. Essington and M. A. Stewart, Soil Sci. Soc. Am. J., 2016, 80, 1197–1207 CrossRef CAS.
- C. Dai, Z. Zhou, X. Zhou and Y. Zhang, Water, Air, Soil Pollut., 2014, 225, 1799 CrossRef.
- P. Dorjee, D. Arnarasiriwardena and B. Xing, Microchem. J., 2014, 116, 15–23 CrossRef CAS.
- J. Simonin, Chem. Eng. J., 2016, 300, 254–263 CrossRef CAS.
- Y. Ho and G. McKay, Process Biochem., 1999, 34, 451–465 CrossRef CAS.
- D. Robati, J. Nanostruct. Chem., 2013, 3, 55 CrossRef.
- Y. Ho and G. McKay, Process Saf. Environ. Prot., 1998, 76, 332–340 CrossRef CAS.
- J. Febrianto, A. N. Kosasih, J. Sunarso, Y. Ju, N. Indraswati and S. Ismadji, J. Hazard. Mater., 2009, 162, 616–645 CrossRef CAS.
- K. Y. Foo and B. H. Hameed, Chem. Eng. J., 2010, 156, 2–10 CrossRef CAS.
Footnote |
| † Electronic supplementary information (ESI) available. See DOI: 10.1039/c9ra04211c |
|
| This journal is © The Royal Society of Chemistry 2019 |
Click here to see how this site uses Cookies. View our privacy policy here. 
 Open Access Article
 This Open Access Article is licensed under a Creative Commons Attribution-Non Commercial 3.0 Unported Licence
 *,
Valtteri Suorsa
*,
Valtteri Suorsa