
 Open Access Article
 This Open Access Article is licensed under a Creative Commons Attribution-Non Commercial 3.0 Unported Licence
Growth and properties of spinel structure Zn1.8Co0.2TiO4 single crystals by the optical floating zone method
Ying Liuab,
Dapeng Xu a,
Tian Cuia,
Huamin Yuac,
Xianfeng Lia and
Liang Li*a
a,
Tian Cuia,
Huamin Yuac,
Xianfeng Lia and
Liang Li*a
aState Key Laboratory of Superhard Materials, College of Physics, Jilin University, Changchun 130000, PR China. E-mail: lliang@jlu.edu.cn; Fax: +86 431 85167046; Tel: +86 431 85167955
bChangchun Institute of Technology, Changchun 130012, PR China
cAviation University Air Force, Changchun 130022, PR China
First published on 22nd August 2019
Abstract
The spinel structure Zn1.8Co0.2TiO4 single crystals with 5 mm diameter and 30 mm length were successfully grown by an optical floating zone method. The as-grown crystals were characterized by X-ray diffraction (XRD), Raman and X-ray photoelectron spectroscopy (XPS). Some Zn2+ ions at tetrahedral and octahedral sites should be replaced by doped transition metal Co2+ ions. The temperature-dependent Raman spectra of spinel Zn1.8Co0.2TiO4 crystals were also described. The optical phonon behaviors of Zn1.8Co0.2TiO4 are stable within the temperature range. The magnetic properties of Zn1.8Co0.2TiO4 were investigated by using Physical Property Measurement System.
1. Introduction
The diluted magnetic semiconductors (DMSs) have attracted a great deal of attention.1,2 As one of the most famous DMS materials, Co doped ZnO have been reported to possess ferromagnetic properties above room temperature.3,4 Spinel type compounds, including normal (AB2O4) and inverse (A2BO4), have been intensively investigated for several decades because of their usefulness in many important technological applications and other branches of solid state sciences.5,6 On the other hand, the inverse spinel structure Zn2TiO4 in cubic (Fd![[3 with combining macron]](https://www.rsc.org/images/entities/char_0033_0304.gif) m) is a versatile host material, ideal for engineering optical and magnetic properties.7 In addition, due to its excellent dielectric and photoelectrochemical properties, it is also applied in microwave devices.8,9
m) is a versatile host material, ideal for engineering optical and magnetic properties.7 In addition, due to its excellent dielectric and photoelectrochemical properties, it is also applied in microwave devices.8,9
Doping with spin-unpaired 3d transition metals results both in a bandgap decrease and the appearance of magnetism.10,11 Some studies have been conducted on the photoluminescence of Zn2TiO4 doped with transition metals and rare-earth ions, such as Cu2+, V5+, Cr3+ and Sn4+. Up to now, there has been little research on the magnetism of Zn2TiO4 doped with Co2+ ions. However, the reported magnetic results of Co2TiO4 (ref. 12) and ZnCoTiO4 (ref. 13) can be used as a key reference in the study of the magnetism of Zn2TiO4 doped Co2+, because from another perspective, it can also be regarded as Co2TiO4 doped Zn2+. The complex magnetic order of spinel Co2TiO4 indicates the existence of a quasi-long-range ferromagnetic state below TN.12
It is well known that doped impurities and defects can affect the magnetic behavior of the materials.14–16 Single crystals are more suitable for studying the intrinsic characteristics of materials. The optical floating zone technique is highly suited to the growth of high purity single crystals, especially metal oxides. Besides, based on the result of L. Mustafa17 and G. D. Nipan,18 we choose an optimization doping content (10%). Therefore, the aims of this work are the growth of Zn1.8Co0.2TiO4 single crystals by optical floating zone method and investigations of the effects of Co dopant on the system and magnetic properties of Zn1.8Co0.2TiO4 for the first time.
2. Experimental
Polycrystalline sample of Zn1.8Co0.2TiO4 was obtained by the solid-state reaction technique. High purity (99.99% pure) ZnO, TiO2 and Co2O3 powders were weighed and mixed. Then the powders were grounded with ethanol in an agate ball-milling machine to obtain a homogeneous mixture and heated in air at 1473 K for 20 h with intermediate grinding. The pretreated mixtures were reground and packed into a cylindrical shape rubber tube. Then they were hydrostatically pressed up to 70 MPa in a cold isostatic press, forming a cylindrical rod. Finally, the rods were sintered at 1500 K for 10 h in air, using as the feed and seed rods.The crystals growth of Zn1.8Co0.2TiO4 were carried out by the infrared-heating floating-zone furnace (Crystal Systems Inc. Model: FZ-T-10000-H-VP-VI, Japan) using 1000 W ×4 halogen lamps in four mirror as heating sources. The crystals were cut along their crystals axis directions and finely polished.
The X-ray diffraction (XRD) measurements were taken on a Rigaku D-max-r A 12 kW X-ray diffractometer using a Cu Kα radiation source. Structural refinements using the Rietveld method19 were carried out via MAUD software. To determine the orientation of the crystals, a Bruker D8 Discover AXS with GADDS XRD2 was employed. The Raman spectra (RS) were recorded by a Jobin-Yvon LABRAM-HR800 high resolution Raman spectroscope with λex = 514.5 nm. The chemical properties of crystals were analyzed by X-ray photoelectron spectroscopy (XPS), which is an ESCALAB 250 electron energy spectrometer with Mg Kα (12![[thin space (1/6-em)]](https://www.rsc.org/images/entities/char_2009.gif) 530.6 eV) as the X-ray excitation source. The magnetic susceptibility χ versus temperature T and magnetization M versus magnetic field H measurements were performed by using Physical Property Measurement System (Quantum Design, model: PPMS-16).
530.6 eV) as the X-ray excitation source. The magnetic susceptibility χ versus temperature T and magnetization M versus magnetic field H measurements were performed by using Physical Property Measurement System (Quantum Design, model: PPMS-16).
3. Results and discussion
In order to obtain a more stable crystal growth environment and reduce the generation of gas bubbles in the molten zone, crystals were grown in the air atmosphere and the seed and feed rods were rotated in opposite directions at the same rate of 6 rpm. The growth rate was 10 mm h−1. The air flow of 0.1 L min−1 and the pressure of 0.1 MPa were applied. Moreover, a stable melting zone is very important to obtain a high-quality single crystal, which sometime dependent on the surface tension. And the surface tension of the melting zone dependent on the intrinsic properties, dopants and temperature of materials. In our case, due to the doped Co2+ ions affect the surface tension of the melting zone, the heating power needs to be reduced during the growth of Zn1.8Co0.2TiO4 crystals to keep the stable of the melting zone.The powder X-ray diffraction patterns of Zn1.8Co0.2TiO4 single crystal are shown in Fig. 1a. The pattern can be identified as the spinel Zn2TiO4 structure (JCPDF no. 25-1164), which indicates that Co doping does not disturb the structure of Zn2TiO4. No additional peaks, such as CoO, Co3O4 or CoTiO3 are observed indicating that no impurity exists in the Zn1.8Co0.2TiO4 single crystal. The XRD results are analyzed by the Rietveld method using the MAUD program20 and sig = 1.21. The lattice parameter: space group is Fdm, a = b = c = 8.4660 Å, which is smaller than the pure Zn2TiO4 (8.48 Å).21 Fig. 1b displays the XRD2 pattern of the thin slice cut perpendicular to the growth direction and the photograph of as-grown Zn1.8Co0.2TiO4 single crystal which is crack-free and black cylindrical rods with 5 mm in diameter and 30 mm in length. There is only one strong peak appears at 2θ = 70.37°, belonging to (620) plane. It indicates that the as-grown crystal is a single crystal with parallel to the (620) direction.
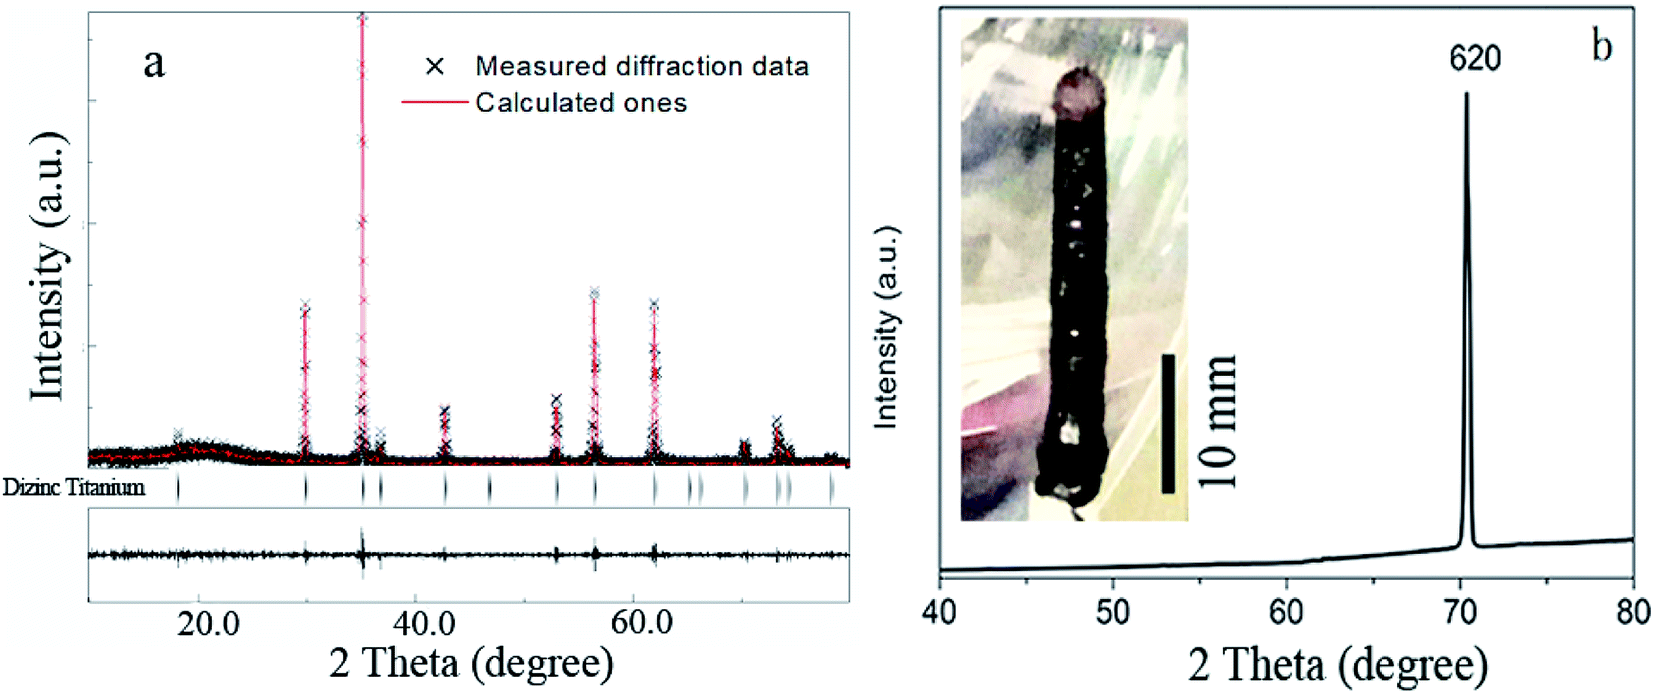 | ||
| Fig. 1 (a) Rietveld refined XRD of Zn1.8Co0.2TiO4 powder. The bottom line shows the difference profile between measured and calculated patterns. (b) XRD2 pattern tested along the growth direction, the insert shows photograph of as-grown Zn1.8Co0.2TiO4 single crystal in an infrared-heating furnace. | ||
The chemical states of each element are crucial to study the properties of Zn1.8Co0.2TiO4 crystal, especially the magnetic properties. In order to clarify the components and chemical states of elements of the Zn1.8Co0.2TiO4 single crystals, XPS was performed and the XPS of Zn-2p, Ti-2p, Co-2p and O-1s were obtained, as shown in Fig. 2. For the XPS spectrum of Zn-2p, two main peaks assigned to Zn-2p3/2 and Zn-2p1/2 can be observed at 1021.7 and 1044.8 eV (Fig. 2a), respectively, which were ascribed to Zn2+. Fig. 2b presents the Ti-2p XPS spectrum of the sample. The binding energy at 458.6 and 464.4 eV corresponded to Ti-2p3/2 and Ti-2p1/2, respectively.22 It was noticed that only Ti4+ species and no Ti3+ species were observed in the Zn1.8Co0.2TiO4 single crystal.
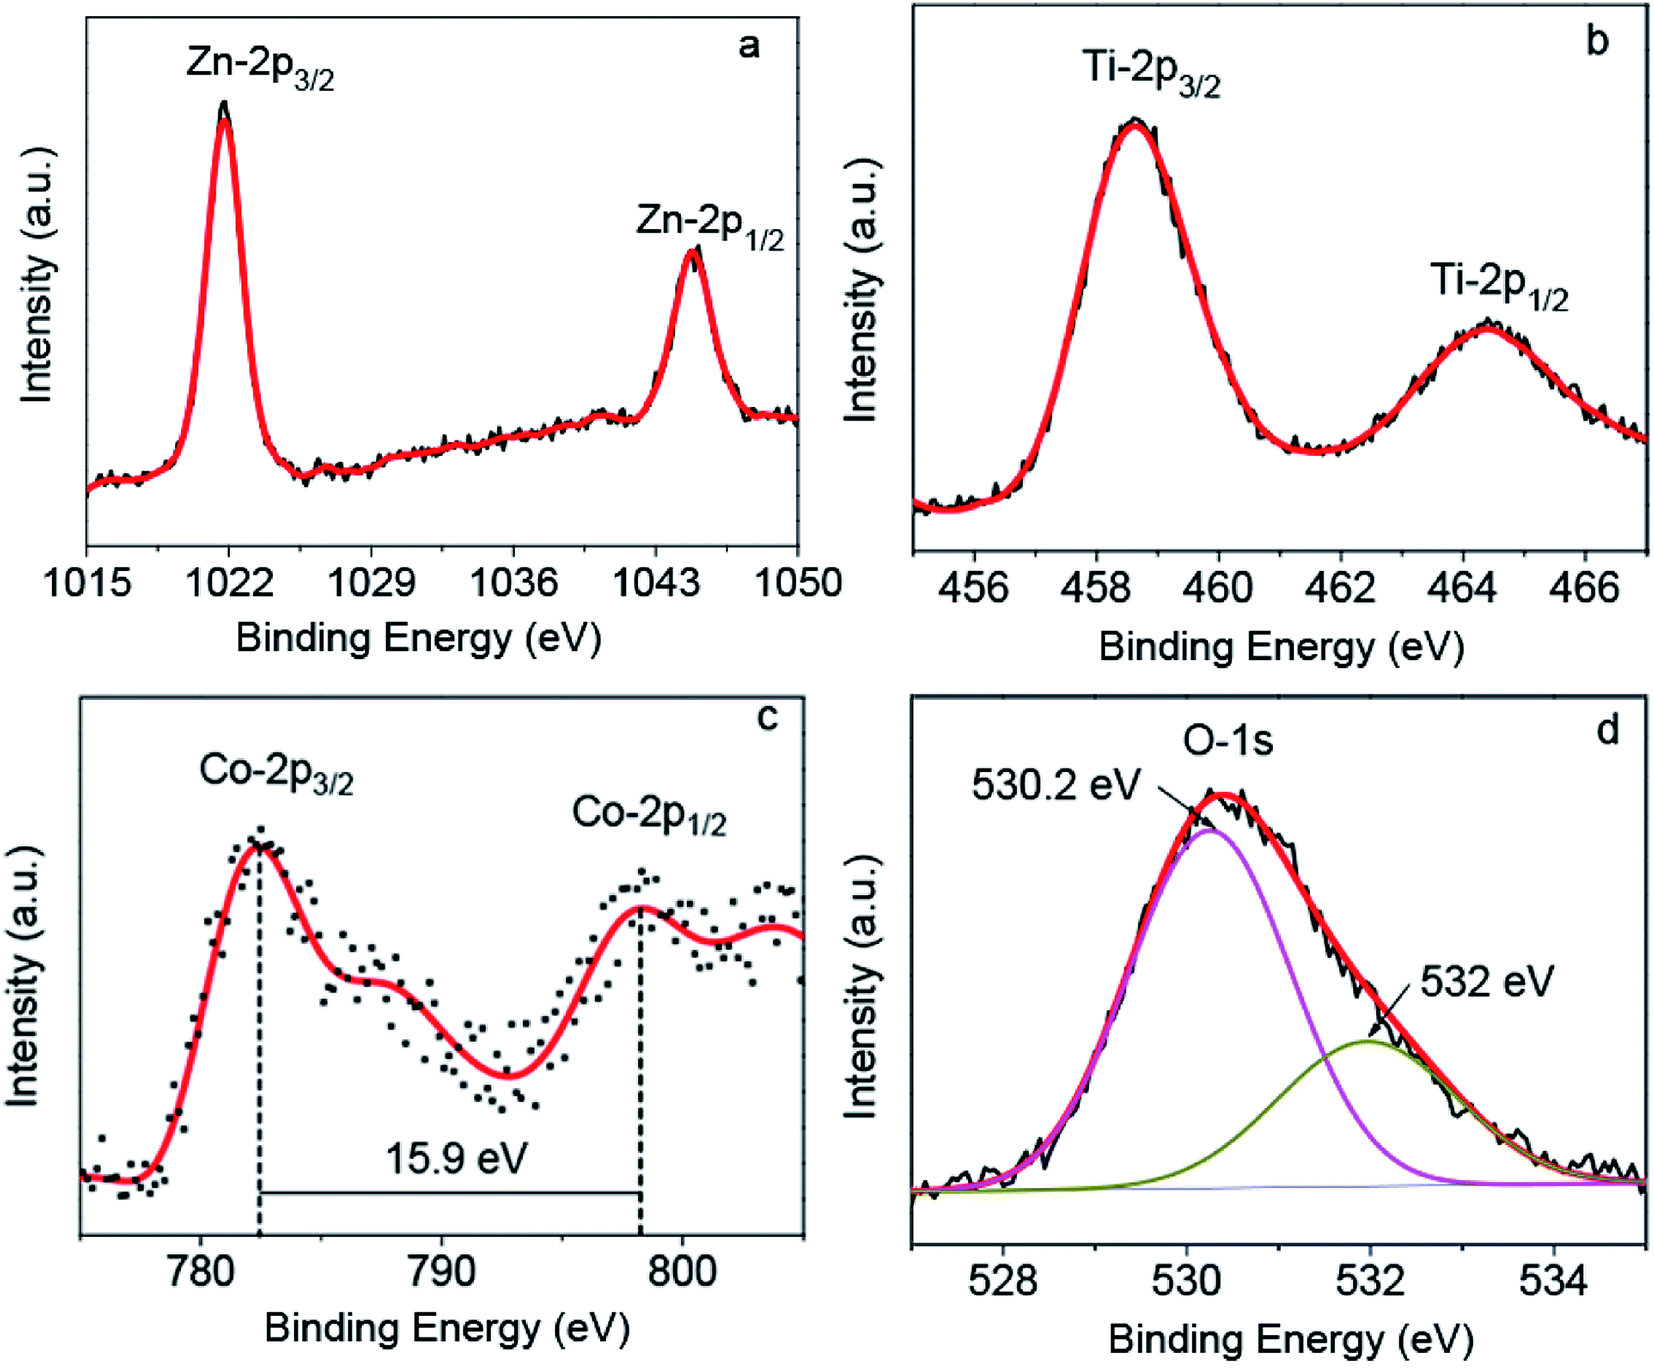 | ||
| Fig. 2 (a) Zn-2p, (b) Ti-2p, (c) Co-2p and (d) O-1s XPS of Zn1.8Co0.2TiO4 single crystal powder. | ||
The Co-2p XPS spectrum of the sample is presented in Fig. 2c. It shows four peaks: a doublet and its corresponding shake-up satellites at slightly higher energies. The binding energies of 782.4 and 798.3 eV were obtained for Co-2p3/2 and Co-2p1/2, respectively. The energy difference of 15.9 eV between these two binding energy values for cobalt characteristic of Co2+ only, and no additional signatures for the Co3+ state (ΔE = 15.0 eV) and metallic Co.23–25 Hence, we concluded that Co in our sample was 2+ state.
The XPS spectrum of O-1s was recorded and fitted into two peaks displayed in Fig. 2d. The peak at the low binding energy (530.1 eV) was assigned to the oxygen in the spinel lattice and the peak at the high binding energy (532 eV) was ascribed to the surface OH groups.26 There is a small peak at 531.3 eV, which should be attributed to the general characteristic peak of oxygen defects, indicating that there were some oxygen defects in the grown Zn1.8Co0.2TiO4 crystal.
Fig. 3 gives the Raman spectra for the as-grown Zn1.8Co0.2TiO4 crystals at room temperature. It can be seen that the Raman modes of 259 (F2g), 306 (F2g), 481 (Eg) and 724 cm−1 (A1g) appear. The observed Raman spectra agree well with those of spinel Zn2TiO4.17 The difference is that there is a lack of Raman peak representing F2g mode at 348 cm−1, and the weak Raman peak at 481 cm−1 has superimposed with the wide and strong peak at 535 cm−1 behind it. The modes, located at 154 and 535 cm−1, do not belong to the Raman-active modes of spinel Zn1.8Co0.2TiO4. The mode at 535 cm−1 was assigned to an order-disorder effect. The peak of 535 cm−1 in Zn2TiO4 is weaker than almost all other Raman peaks. However, it becomes the second strongest peak in the as-grown Zn1.8Co0.2TiO4 crystal. Thereby, the order-disorder effect becomes stronger due to the doped Co2+.
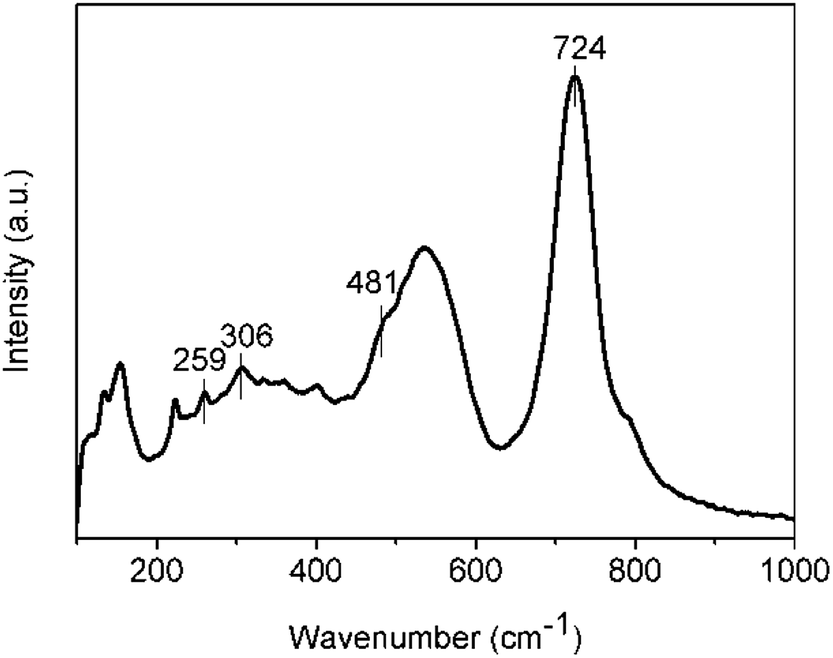 | ||
| Fig. 3 The room-temperature Raman spectra for as-grown Zn1.8Co0.2TiO4 crystals. | ||
The Zn2TiO4 is an inverse spinel, and structure formula can be written as (Zn(TiZn)O4), with a space group of Fdm and typically described by a 56-atom unit cell. In this unit cell, 32 oxygen atoms comprise a face-centered cubic lattice with associated interstitial octahedral (O) and tetrahedral (T) sites. These T-sites are occupied by half of the divalent Zn cations, while O-sites are randomly filled with a stoichiometric mixture of divalent Zn and tetravalent Ti cations. While the doping Co2+ occupied T-sites and O-sites. And then the O-sites are occupied by three kinds of ions, including Co2+, Zn2+ and Ti4+. The structure is more complicated and the disorder effect of the O-sites becomes stronger. Therefore, the order-disorder effect significant enhanced by the doping of Co2+ and the bond at 535 cm−1 become very strong. On the other hands, the full width at half maximum (FWHM) of the A1g mode at 724 cm−1 is 51 cm−1, which is 11 cm−1 more than the pure Zn2TiO4 crystals, in which the FWHM of the A1g mode is 40 cm−1.22 The FWHM can give the information about uniform of the bonds. The Co2+ ions replace the Zn at the T-sites and disturb the Zn–O tetrahedral should be the main reason for the boarder of the A1g mode at 724 cm−1. The Raman spectra can indicate that the as-grown Zn1.8Co0.2TiO4 crystals are still spinel structure, and Co2+ ions replace part of Zn2+ ions, making the ions occupy randomly in tetrahedral and octahedral sites, resulting in enhancement of order-disorder effect.
To investigate temperature effects on the spinel structure of Zn1.8Co0.2TiO4, the temperature-dependent Raman spectra were measured. A total of 18 temperature-measuring points were employed from 93 to 773 K at 40 K intervals. The Raman spectra obtained at each point are shown in Fig. 4a. The temperature-dependent Raman wavenumber of the 259 (F2g), 306 (F2g), 481 (Eg) and 724 cm−1 (A1g) four peaks and FWHM of the A1g mode were obtained, as shown in Fig. 5a and b, respectively. With the temperature increasing from 93 to 773 K, the common features are: (1) all the Raman peaks shifted towards the low wavenumber direction, (2) the peaks were broadened, (3) the intensity gradually decreased, (4) peaks with relative low intensity at low temperature disappear. Moreover, the vibration mode of 481 cm−1 (Eg) becomes fuzzier because the widths were too wide to be recognized when the temperature increases and superimposed with the peak of 535 cm−1.
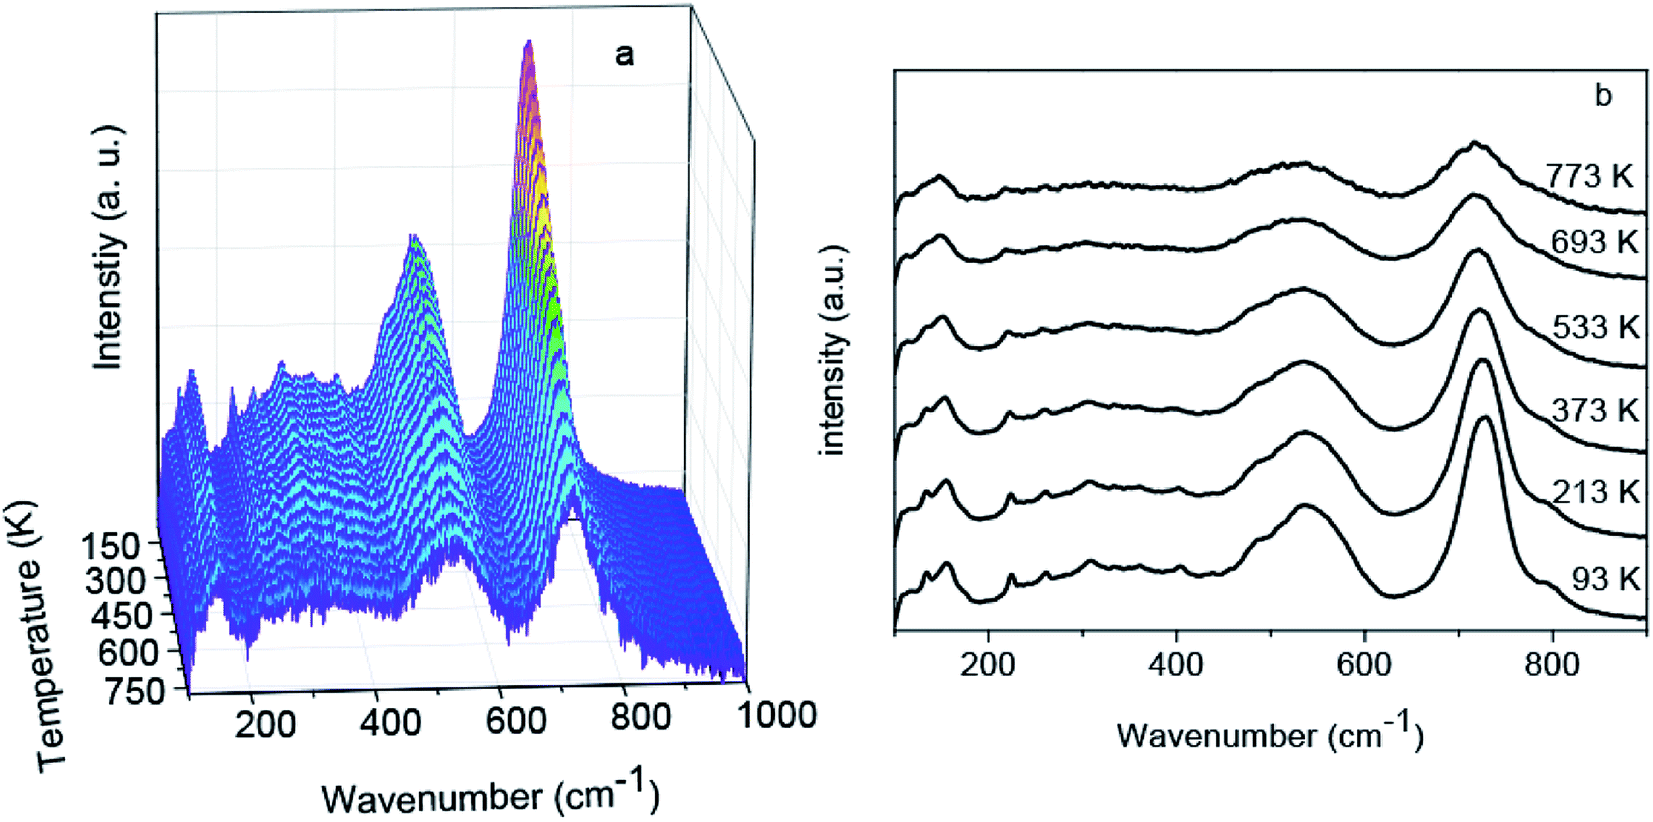 | ||
| Fig. 4 (a) Full temperature-dependent Raman spectra of the Zn1.8Co0.2TiO4 crystal in the range from 93 to 773 K. (b) Selected temperature-dependent Raman spectra. | ||
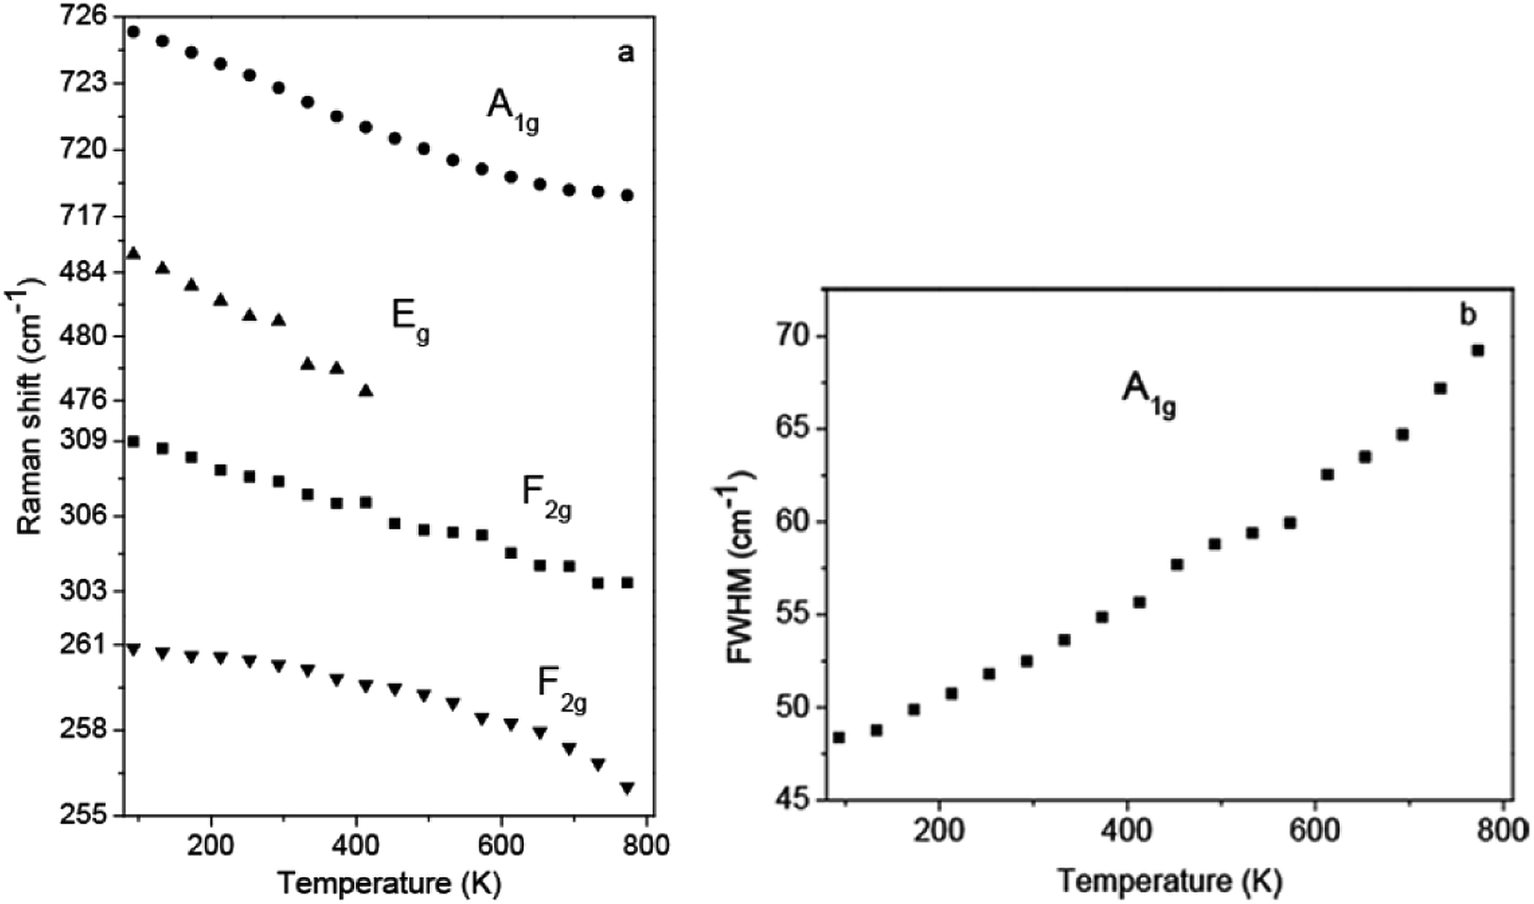 | ||
| Fig. 5 (a) Temperature-dependent Raman shift for the selected Raman bonds. (b) Linewidth of A1g modes as a function of temperature. | ||
The A1g mode located at 724 cm−1 corresponds to the local lattice effect in the tetrahedral (T) sublattice, while the modes at 306 and 481 cm−1 reflect local lattice effects in the octahedral (O) sublattice.27 The relative intensity reflects the relative content of the corresponding mode compared with other modes. For undoped Zn2TiO4, when the temperature rising from 87 to 873 K, the intensity of A1g mode at 724 cm−1 becomes the second strongest and the Raman bands from O-site become the strongest.22 The change of the relative Raman intensities of T and O sites indicates that the dislocation of Zn2+ cations from the T site to the O site, while Ti4+cations may migrate from the O site to the T site.22 In contrast, relative Raman intensities of T and O sites did not change after the Co2+ ions were doped in Zn2TiO4, as shown in Fig. 4b. The Raman intensity of A1g mode, as the strongest bond, is significantly higher than the others during the whole temperature range. Therefore, the doping of Co2+ ions impeded the migration of Zn2+ and Ti4+ cations between O and T sites. Furthermore, no new Raman peak is observable, indicating that the spinel structure of Zn1.8Co0.2TiO4 is stability at temperatures ranging from 93 to 773 K.
The magnetic properties of Zn1.8Co0.2TiO4 single crystal powder are investigated. The temperature dependence of magnetic susceptibility (χ) under zero field cooling (ZFC) and field cooling (FC) conditions were measured at an external magnetic field of 500 Oe from 300 to 3 K as illustrated in Fig. 6. The two curves are superimposable exactly and increased as the temperature decreases. No separation of ZFC and FC was observed, indicating that there is no a glassy spin magnetic moment. The magnetic susceptibility (χ) is composed of two parts, which can be written as:
| χ(T) = C/(T − T0) + χPP |
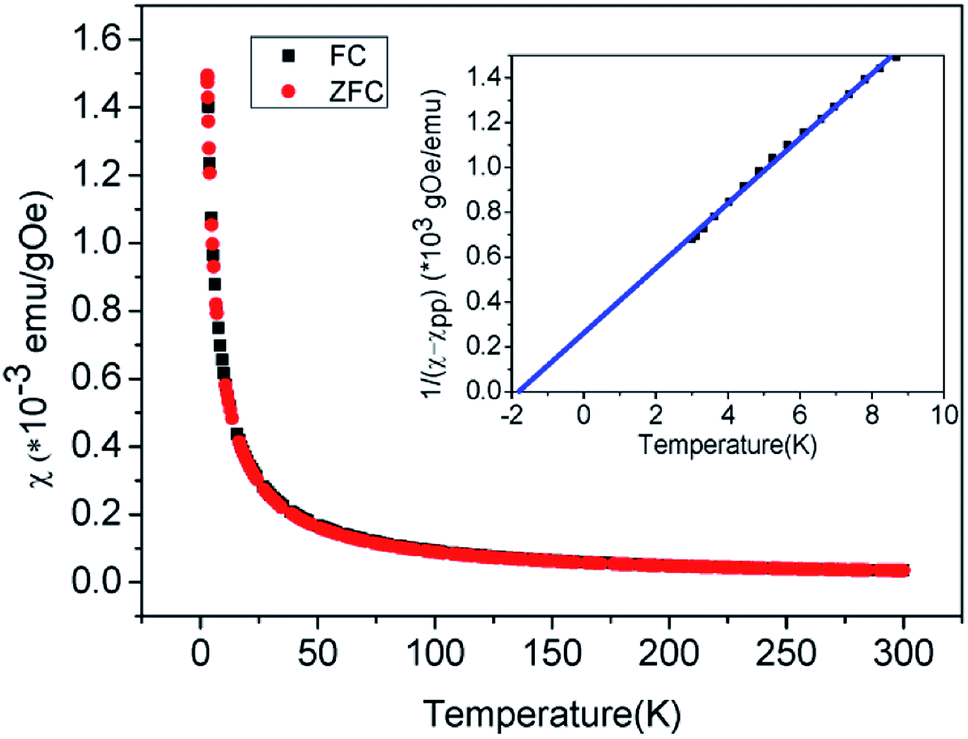 | ||
| Fig. 6 Temperature dependence of magnetic susceptibility for Zn1.8Co0.2TiO4 single crystal powder. The insert shows that temperature trend of the inverse Curie–Weiss susceptibility, with a linear fit to the data (a straight line). | ||
The isothermal magnetization measurements were carried out in a magnetic field that varied between −30 and 30 kOe at different temperatures (300, 60, 20 and 5 K), as shown in Fig. 7. The magnetizations increase linearly at 300, 60 and 20 K, exhibiting an obvious paramagnetic behavior. This indicates that the sample has not underwent a transition from paramagnetism to antiferromagnetism at the temperature of 20 K. As the temperature decreased to 5 K, the curve exhibits a little hysteresis, which indicates that a weak ferromagnetism is superposed on the antiferromagnetic curve. Furthermore, no saturation of the magnetization is observed below 30 kOe, due to the fact that the antiferromagnetic interactions not completely overcome in 30 kOe field. The existence of ferromagnetic state below TN was observed to be the same as that of Co2TiO4 compound.12 Ferromagnetism comes from the different Co2+ cations located in tetrahedral or octahedral sites, since the octahedral coordination requires orbital contributions, which are not present in the tetrahedral coordination. In other words, the ferromagnetism found also indicates that doped Co2+ ions take the place of some Zn2+ ions in tetrahedral and octahedral sites.
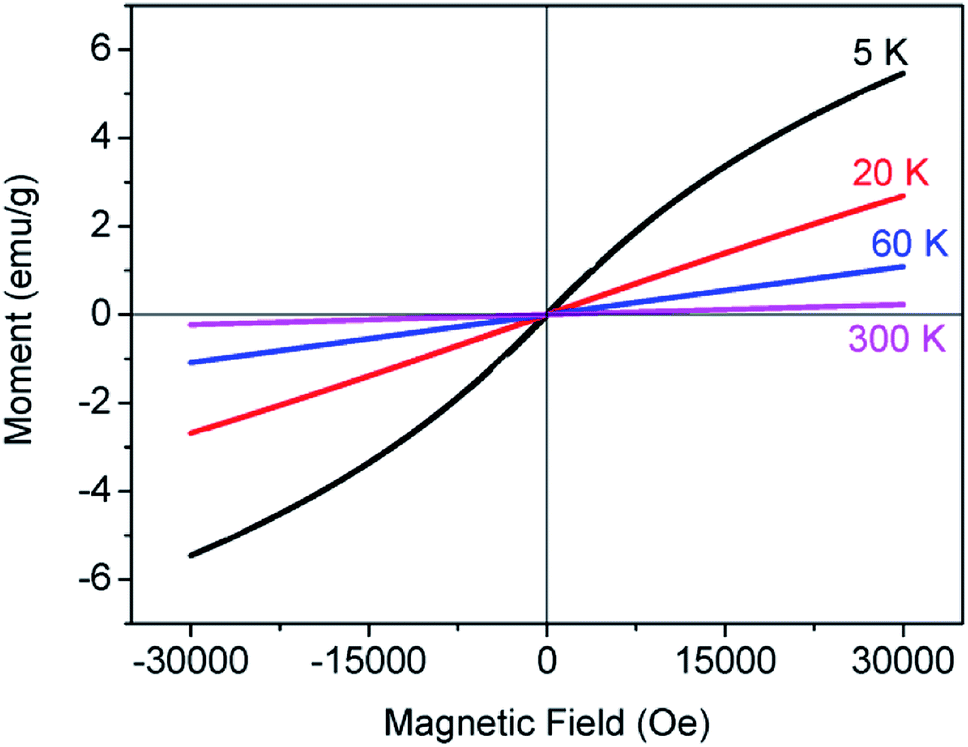 | ||
| Fig. 7 M–H curves at different temperatures for Zn1.8Co0.2TiO4 single crystal powder. | ||
4. Conclusions
In summary, the Zn1.8Co0.2TiO4 single crystals were grown by optical floating zone method. The XRD, Raman and XPS results indicated that Co2+ ions are replaced some Zn2+ at T and O sites. The temperature-dependent Raman spectra of spinel Zn1.8Co0.2TiO4 crystal were also described. The result shows that the optical phonon behaves of Zn1.8Co0.2TiO4 is stable in the temperature range and doped Co2+ ions impeded the migration of Zn2+ and Ti4+ cations between octahedral and tetrahedral sites. The temperature dependence of magnetic susceptibility and the magnetization as a function of the applied magnetic field were performed, indicating that when the temperature up to 5 K, the sample underwent paramagnetism to antiferromagnetism transition. The effective magnetic moment is 2.70 μB/Co.Conflicts of interest
There is no conflicts of interest regarding the publication of this paper.Acknowledgements
The financial support from the National Key Research and Development Program (No. 2017YFA0403704), the National Natural Science Foundation of China (Grant No. 11304113, 11474127, 11574112) and the Fundamental Research Funds for the Central Universities are greatly appreciated.References
- H. Ohno, D. Chiba, F. Matsukura, T. Omiya, E. Abe, T. Dietl, Y. Ohno and K. Ohtani, Nature, 2000, 408, 944 CrossRef CAS PubMed.
- R. Flederling, M. Keim, G. Reuscher, W. Ossau, G. Schmidt, A. Waag and L. W. Molenkamp, Nature, 1999, 402, 787 CrossRef CAS.
- M. Venkatesan, C. B. Fitzgerald, J. G. Lunney and J. M. D. Coey, Phys. Rev. Lett., 2004, 93, 177206 CrossRef CAS PubMed.
- M. H. F. Sluiter, Y. Kawazoe, P. Sharma, A. Inoue, A. R. Raju and U. V. Waghmare, Phys. Rev. Lett., 2005, 94, 187204 CrossRef PubMed.
- H. Martinho, N. O. Moreno, J. A. Sanjurjo, C. Rettori, A. J. Garcia-Adeva, D. L. Huber, S. B. Oseroff, W. Ratcliff, S. W. Cheong, P. G. Pagliuso, J. L. Sarrao and G. B. Martins, Phys. Rev. B: Condens. Matter Mater. Phys., 2001, 64, 024408 CrossRef.
- B. N. Kim, K. Hiraga, K. Morita and Y. Sakka, Nature, 2001, 413, 288 CrossRef CAS PubMed.
- Y. Inaguna, A. Aimi, Y. Shirako, D. Sakurai, D. Mori, H. Kojizani, M. Akaogi and M. Nakayama, J. Am. Chem. Soc., 2014, 136, 2748 CrossRef PubMed.
- Y. Yang, R. Scholz, H. J. Fan, D. Hesse, U. Gosele and M. Zacharias, ACS Nano, 2009, 3, 555 CrossRef CAS PubMed.
- L. Li, F. Li, T. Cui, Q. Zhou and D. Xu, Phys. Status Solidi A, 2012, 209, 12 Search PubMed.
- D. Shoemaker and R. Seshadri, Phys. Rev. B: Condens. Matter Mater. Phys., 2010, 82, 214107 CrossRef.
- J. Ruiz-Fuertes, T. Bernert, M. He, B. Winkler, V. L. Vinograd and V. Milman, Appl. Phys. Lett., 2014, 105, 071911 CrossRef.
- S. Nayak, S. Thota, D. C. Joshi, M. Krautz, A. Waske, A. Behler, J. Eckert, T. Sarkar, M. S. Andersson and R. Mathieu, et al., Phys. Rev. B: Condens. Matter Mater. Phys., 2015, 92, 214434 CrossRef.
- D. Ruiz-Leóna, F. Mompeanb, J. Prado-Gonjalb, F. M. José, G.-H. Mar and R. Schmidt, J. Eur. Ceram. Soc., 2018, 38, 4986 CrossRef.
- M. Li, J. Li, L.-Q. Chen, B.-L. Gu and W. Duan, Phys. Rev. B: Condens. Matter Mater. Phys., 2015, 92, 115435 CrossRef.
- G. S. Chang, J. Forrest, E. Z. Kurmaev, A. N. Morozovska, M. D. Glinchuk, J. A. McLeod, A. Moewes, T. P. Surkova and N. H. Hong, Phys. Rev. B: Condens. Matter Mater. Phys., 2012, 85, 165319 CrossRef.
- R. Murugan, G. Vijayaprasath, T. Mahalingam and G. Ravi, Ceram. Int., 2016, 42, 11724 CrossRef CAS.
- L. Mustafa, S. Anjum, S. Waseem, H. Khurshid and S. Javed, Mater. Today: Proc., 2015, 2, 5638–5644 Search PubMed.
- G. D. Nipan, A. I. Stognij and V. A. Ketsko, Oxide ferromagnetic semiconductors: coatings and films, Russ. Chem. Rev., 2012, 81, 458 CrossRef CAS.
- H. Rietveld, A profile refinement method for nuclear and magnetic structures, J. Appl. Crystallogr., 1969, 2, 65–71 CrossRef CAS.
- L. Lutterotti, S. Matthies, H.-R. Wenk, A. S. Schultz and J. W. Richardson Jr, Combined texture and structure analysis of deformed limestone from time-of-flight neutron diffraction spectra, J. Appl. Phys., 1997, 81, 594–600 CrossRef CAS.
- R. B. Rankin, A. Campos, H. Tian, R. Siriwardane, A. Roy, J. J. Spivey, D. S. Sholl and J. K. Johnson, Characterization of bulk structure in zinc orthotitanate: A Density Functional Theory and EXAFS Investigation, J. Am. Ceram. Soc., 2008, 91, 584–590 CrossRef CAS.
- L. Li, S. H. Gao, T. Cui, B. X. Li, Q. Zhou, H. M. Yuan and D. P. Xu, RSC Adv., 2017, 7, 35477 RSC.
- J. K. Kwak, K. H. Park, D. Y. Yun, D. U. Lee, T. W. Kim, D. I. Son, J. H. Han and J. Y. Lee, J. Korean Phys. Soc., 2010, 57, 1803 CrossRef CAS.
- J. G. Kim, D. L. Pugmire, D. Bhattagila and M. A. Langell, Appl. Surf. Sci., 2000, 165, 70 CrossRef CAS.
- S. C. Petitto, E. M. Marsh, G. A. Carson and M. A. Langell, J. Mol. Catal. A: Chem., 2008, 281, 49 CrossRef CAS.
- A. C. Tavares, M. I. da Silva Pereira, M. H. Mendonca, M. R. Nunes, F. M. Costa and C. M. Sá, J. Electroanal. Chem., 1998, 449, 91 CrossRef CAS.
- M. Mączka, M. Ptak, M. Kurnatowska and J. Hanuza, Mater. Chem. Phys., 2013, 138, 682 CrossRef.
- M. H. Pegah, E. Panaitescu, D. Heiman, L. Menon and L. H. Lewis, J. Mater. Res., 2013, 28, 10 Search PubMed.
- X. Che, L. Li and G. Li, Appl. Phys. Lett., 2016, 108, 143102 CrossRef.
| This journal is © The Royal Society of Chemistry 2019 |