
 Open Access Article
 This Open Access Article is licensed under a Creative Commons Attribution-Non Commercial 3.0 Unported Licence
Study on the thermal decomposition mechanism of graphene oxide functionalized with triaminoguanidine (GO-TAG) by molecular reactive dynamics and experiments†
Chongmin Zhang a,
Xiaolong Fu*b,
Qilong Yan*c,
Jizhen Lia,
Xuezhong Fana and
Guofang Zhangb
a,
Xiaolong Fu*b,
Qilong Yan*c,
Jizhen Lia,
Xuezhong Fana and
Guofang Zhangb
aXi'an Modern Chemistry Research Institute, Xi'an, 710065, China
bKey Laboratory of Applied Surface and Colloid Chemistry, MOE/School of Chemistry and Chemical Engineering, Shaanxi Normal University, Xi'an 710062, China. E-mail: fuxiaolong204@163.com
cScience and Technology on Combustion, Internal Flow and Thermostructure Laboratory, Northwestern Polytechnical University, Xi'an 710072, China. E-mail: qilongyan@nwpu.edu.cn
First published on 16th October 2019
Abstract
Graphene oxide (GO) has a catalytic effect on the thermal decomposition of energetic materials above the melting point. To further enhance the catalytic activity of GO, it has been functionalized with the high nitrogen ligand triaminoguanidine (TAG). However, theoretical studies on the reactivity of functionalized GO (e.g., GO-TAG) have not been carried out. Therefore, the thermal decomposition of each TAG, GO and GO-TAG is studied by molecular dynamic simulations using a reactive force-field (ReaxFF) with experimental verification, and the results are reported herein. The results show that the GO nanolayer has a tendency to aggregate into a large carbon cluster during its degradation. The main decomposition products of TAG are NH3, N2 and H2. For GO-TAG, the main decomposition products are H2O, NH3, N2 and H2. GO has a significant acceleration effect on the decomposition process of TAG by decreasing the decomposition temperature of TAG. This phenomenon is in agreement with the experimental results. The initial decomposition of TAG is mainly caused by hydrogen transfer in the molecule. The edge carbon atoms of GO promote the decomposition of TAG molecules and reduce the decomposition activation energy of TAG by 15.4 kJ mol−1. Therefore, TAG will quickly decompose due to the catalytic effect of GO. This process produces a “new” GO that catalyzes the decomposition of components such as TAG. At the same time, many free radicals (HN2, H2N and free H) are generated during the decomposition of TAG to catalyze the decomposition of other components, which in turn, enhance the catalytic capability of GO.
1 Introduction
The increasing enhancement of the burn rate of propellants has become increasingly important to improve the performance of a certain type of rocket motor.1,2 Graphene oxide (GO) has been reported to catalyze the thermal decomposition process of energetic materials (EMs).3–5 To further enhance the catalytic activity of GO, graphene oxide functionalized with triaminoguanidine (GO-TAG) has been synthesized and has high catalytic activity.6,7 TAG is an energetic, nitrogen-rich, flammable compound.8 Energetic derivatives of TAG usually have high positive enthalpy, good thermal stability and a high nitrogen content. TAG can be used in clean propellants as a raw material,9 leading to a large amount of gas production with little residue. The main gaseous products are nontoxic products, such as NH3, H2O and N2.Since the development of Molecular Dynamic simulations (MD) using the reactive force-field method (ReaxFF),10–12 it has become very popular in studying the thermal decomposition processes of EMs.13–15 The catalytic mechanisms of GO on EMs can be studied from a microscopic point of view by the MD method. The thermal decomposition process of pentaerythritol tetranitrate (PETN) in both a single molecule and the condensed phase were studied by the ReaxFF method.16 The results show that the activation barrier of the decomposition kinetics in the condensed phase is approximately 2 times lower than that of the single molecule due to the effect of intermolecular hydrogen transfer in the condensed phase. Han et al.17 studied the thermal decomposition of nitromethane (CH3NO2) using ReaxFF. The results show that at 3000 K, the first reaction in the thermal decomposition of nitromethane is intermolecular proton transfer. At 2000 K and 2500 K, the first reaction in its thermal decomposition process is usually an intramolecular isomerization reaction, which involves the cleavage of the C–N bond, the formation of a C–O bond, and finally, the production of methyl nitrate (CH3ONO). By employing the ReaxFF method, the detailed initial decomposition mechanism of EMs can be studied, which is of great significance for understanding the thermal decomposition properties of EMs.
Graphene has many interesting properties,18–21 such as being able to be used in energy storage,22–26 catalysis,27–31 and superconducting materials.32,33 GO, as a precursor of graphene, has been used in EMs, and it has been reported to catalyze the thermal decomposition of EMs.34,35 The preparation of graphene nanoparticle composites and their effects on the thermal decomposition of ammonium perchlorate (AP) have been studied.34 The results show that the Ni/graphene nanocomposite has high catalytic activity. The Ni/graphene nanocomposite is used to catalyze the thermal decomposition of AP, and the results indicate that the temperature corresponding to the maximum decomposition rate of AP is reduced by 97.3 °C, where the low temperature decomposition peak disappears.34 Functionalized graphene sheets may increase the burn rate of nitromethane.35 The results show that the vacancy defect of the graphene sheet, that is, the functionalized part of the oxygen-containing group, accelerates the thermal decomposition of nitromethane and its derivatives, and the final products are H2O, CO2 and N2. These studies indicate that graphene has a good catalytic effect on EMs and can decrease their decomposition temperatures, which implies that graphene is important for improving the combustion performance of propellants. Yan et al.6 studied the synthesis and properties of GO-TAG-Cu(II)/Cu(I). They used TAG as an energetic ligand to functionalize with GO and then coordinate with Cu ions. Their results show that these EMs are highly thermostable with low sensitivity and that the highest thermal decomposition peak temperature is above 495 °C with an impact sensitivity of greater than 81 J. This material will be a good candidate for use in low-vulnerability solid propellants and charges of deep-well perforating guns. However, the catalytic effect of GO-TAG on the thermal decomposition of energetic materials has not been reported to date.
In this work, the initial thermal decomposition mechanism and thermal decomposition products of TAG molecules and GO-TAG molecules are simulated by ReaxFF, whereas the thermal decomposition of TAG and GO-TAG are experimentally verified by differential scanning calorimetry (DSC) and thermogravimetry (TG). The evolutions of the major chemical species of GO, TAG and GO-TAG during their decomposition processes are presented with proposed reaction mechanisms. Our research focuses on the kinetics of the initial reactions, which are confirmed with experimental results.
2 Methods
2.1 ReaxFF force field
ReaxFF is a method for modeling chemical reactions with atomistic potential based on the reactive force field approach developed by van Duin et al.10 The total energy of the system is described by the sum of the bond energy (Ebond), over-coordination penalty energy (Eover), under-coordination correction energy (Eunder), valence angle energy (Eval), torsion angle energy (Etor), lone-pair electron energy (Elp), Coulomb interaction energies (ECoul), and van der Waals interaction energy (Evdw), as shown in eqn (1).| Esystem = Ebond + Eover + Eunder + Eval + Etor + Elp + ECoul + Evdw | (1) |
ReaxFF uses bond-order formalism in conjunction with polarizable charge descriptions to describe both reactive and nonreactive interactions between atoms. The bond order is described by the empirical formula:
 | (2) |
2.2 Simulation details
The initial crystal structure of TAG is obtained from experimental X-ray data.8 We first optimized the unit cell of the crystal structure by the ReaxFF-lg method and obtained the structural parameters, which are compared with the X-ray experimental data presented in Table 1. It can be seen from Table 1 that our computed lattice parameters a, b and c show very good agreement with the experimental data, with less than 0.5% deviation. The computational lattice angles α, β and γ are consistent with the experimental results, with almost no deviation. Therefore, our calculation of TAG based on the ReaxFF-lg method is credible and reliable.| Method | a (Å) | b (Å) | c (Å) | α (deg) | β (deg) | γ (deg) | |
|---|---|---|---|---|---|---|---|
| Ref. 8 | X-ray | 7.460 | 10.274 | 6.343 | 90.00 | 110.80 | 90.00 |
| This work | ReaxFF-lg | 7.438 | 10.251 | 6.312 | 90.00 | 110.86 | 90.00 |
Consequently, according to the abovementioned structural optimization results, actual TAG molecules can be obtained. Based on the work of Yan et al.,6 graphene oxide was grafted with TAG molecules to form GO-TAG molecules, and geometric optimization was performed. Then, we carried out isothermal–isobaric (NPT) MD simulation with a 0.25 fs time step to relax the internal stresses and to obtain the initial structures of TAG, GO and GO-TAG. The molecular structures and super cells of TAG, GO and GO-TAG are shown in Fig. 1 and 2, respectively. Here, we used a Berendsen thermostat (100 fs damping constant) and a Berendsen barostat (500 fs damping constant). After 100 ps of NPT simulation, we carried out 100 ps isothermal isochoric (NVT) MD simulations with a 0.25 fs time step at 1200 K, 1500 K, 2000 K, 2500 K, and 3000 K to analyze the thermal decomposition of TAG, GO and GO-TAG. The thermostat and barostat were same as those used in the NPT MD simulation. All MD simulations were carried out using ADF software package with a reactive force field of ReaxFF-lg.38
 | ||
| Fig. 1 Molecular structures of TAG (a), GO (b) and GO-TAG (c). | ||
 | ||
| Fig. 2 Super cells of TAG (a), GO (b) and GO-TAG (c). | ||
In the analysis, the bond order cutoff used in this work to confirm the generation of chemical bonds was set to 0.3 for all atom pairs. We considered that when the bond order between two atoms was greater than 0.3, a chemical bond formed. After that, we used the data calculated by this method to obtain the product distribution and reaction steps.
2.3 Thermal analysis
Differential scanning calorimeter (DSC) curves were recorded by a TA Instruments Q20 under a heating rate of 10 °C min−1 with a 50 ml min−1 N2 gas flow, and the sample mass was approximately 0.5 mg. Thermogravimetric (TG) analysis was carried out on a TA Instruments Q500 TGA with a heating rate of 10 °C min−1 under N2 gas flow.3 Results and discussion
3.1 Details of the initial reactions
For a reaction, the initial reaction mechanism should be understood first, which helps to understand the complete reaction pathway. Therefore, for the GO, TAG and GO-TAG systems, their first 100 ps decomposition products and pathways were studied. At the same time, to understand the effect of temperature on the decomposition products and pathways, their dynamic processes at 1200 K, 1500 K, 2000 K, 2500 K, 3000 K were determined. All results are from the average of three calculations.First, the decomposition process of GO was studied. Fig. 3 shows the evolution of key chemical species of GO at different temperatures from 1200 K to 3000 K. The decomposition of GO from 1200 K to 3000 K shows that during the decomposition process, the temperature has a strong influence on the distribution of the products. At low temperatures, there are few decomposition products, which proves that GO undergoes almost no decomposition. Only small amounts of H2O and H2 are generated. As the temperature increases, the decomposition of GO becomes increasingly intensive. It can be seen from the product diagram that the number of products significantly increases and that the growth of H2 is faster than that of H2O. H2O is formed in large quantities at the beginning of the reaction, but after approximately 40 ps, the amount of H2O no longer increases or even begins to decrease because at the initial stage of the reaction, the hydroxyl groups on GO can easily detach and form hydroxyl radicals and then generate H2O with a hydrogen atom. However, in the middle and late stages of the reaction, the oxygen atoms are held by GO and form epoxy groups or carbonyl groups or form oxygen-containing hetero rings with carbon atoms. These bonds render the oxygen atoms not easily detachable and thus reduce the formation of water. When the temperature is 3000 K, the formation of CO and CO2 takes place, which indicates that the reaction becomes more intensive, causing the carbonyl groups at the edge of GO and some oxygen-containing six-membered rings to begin to rupture and detach.
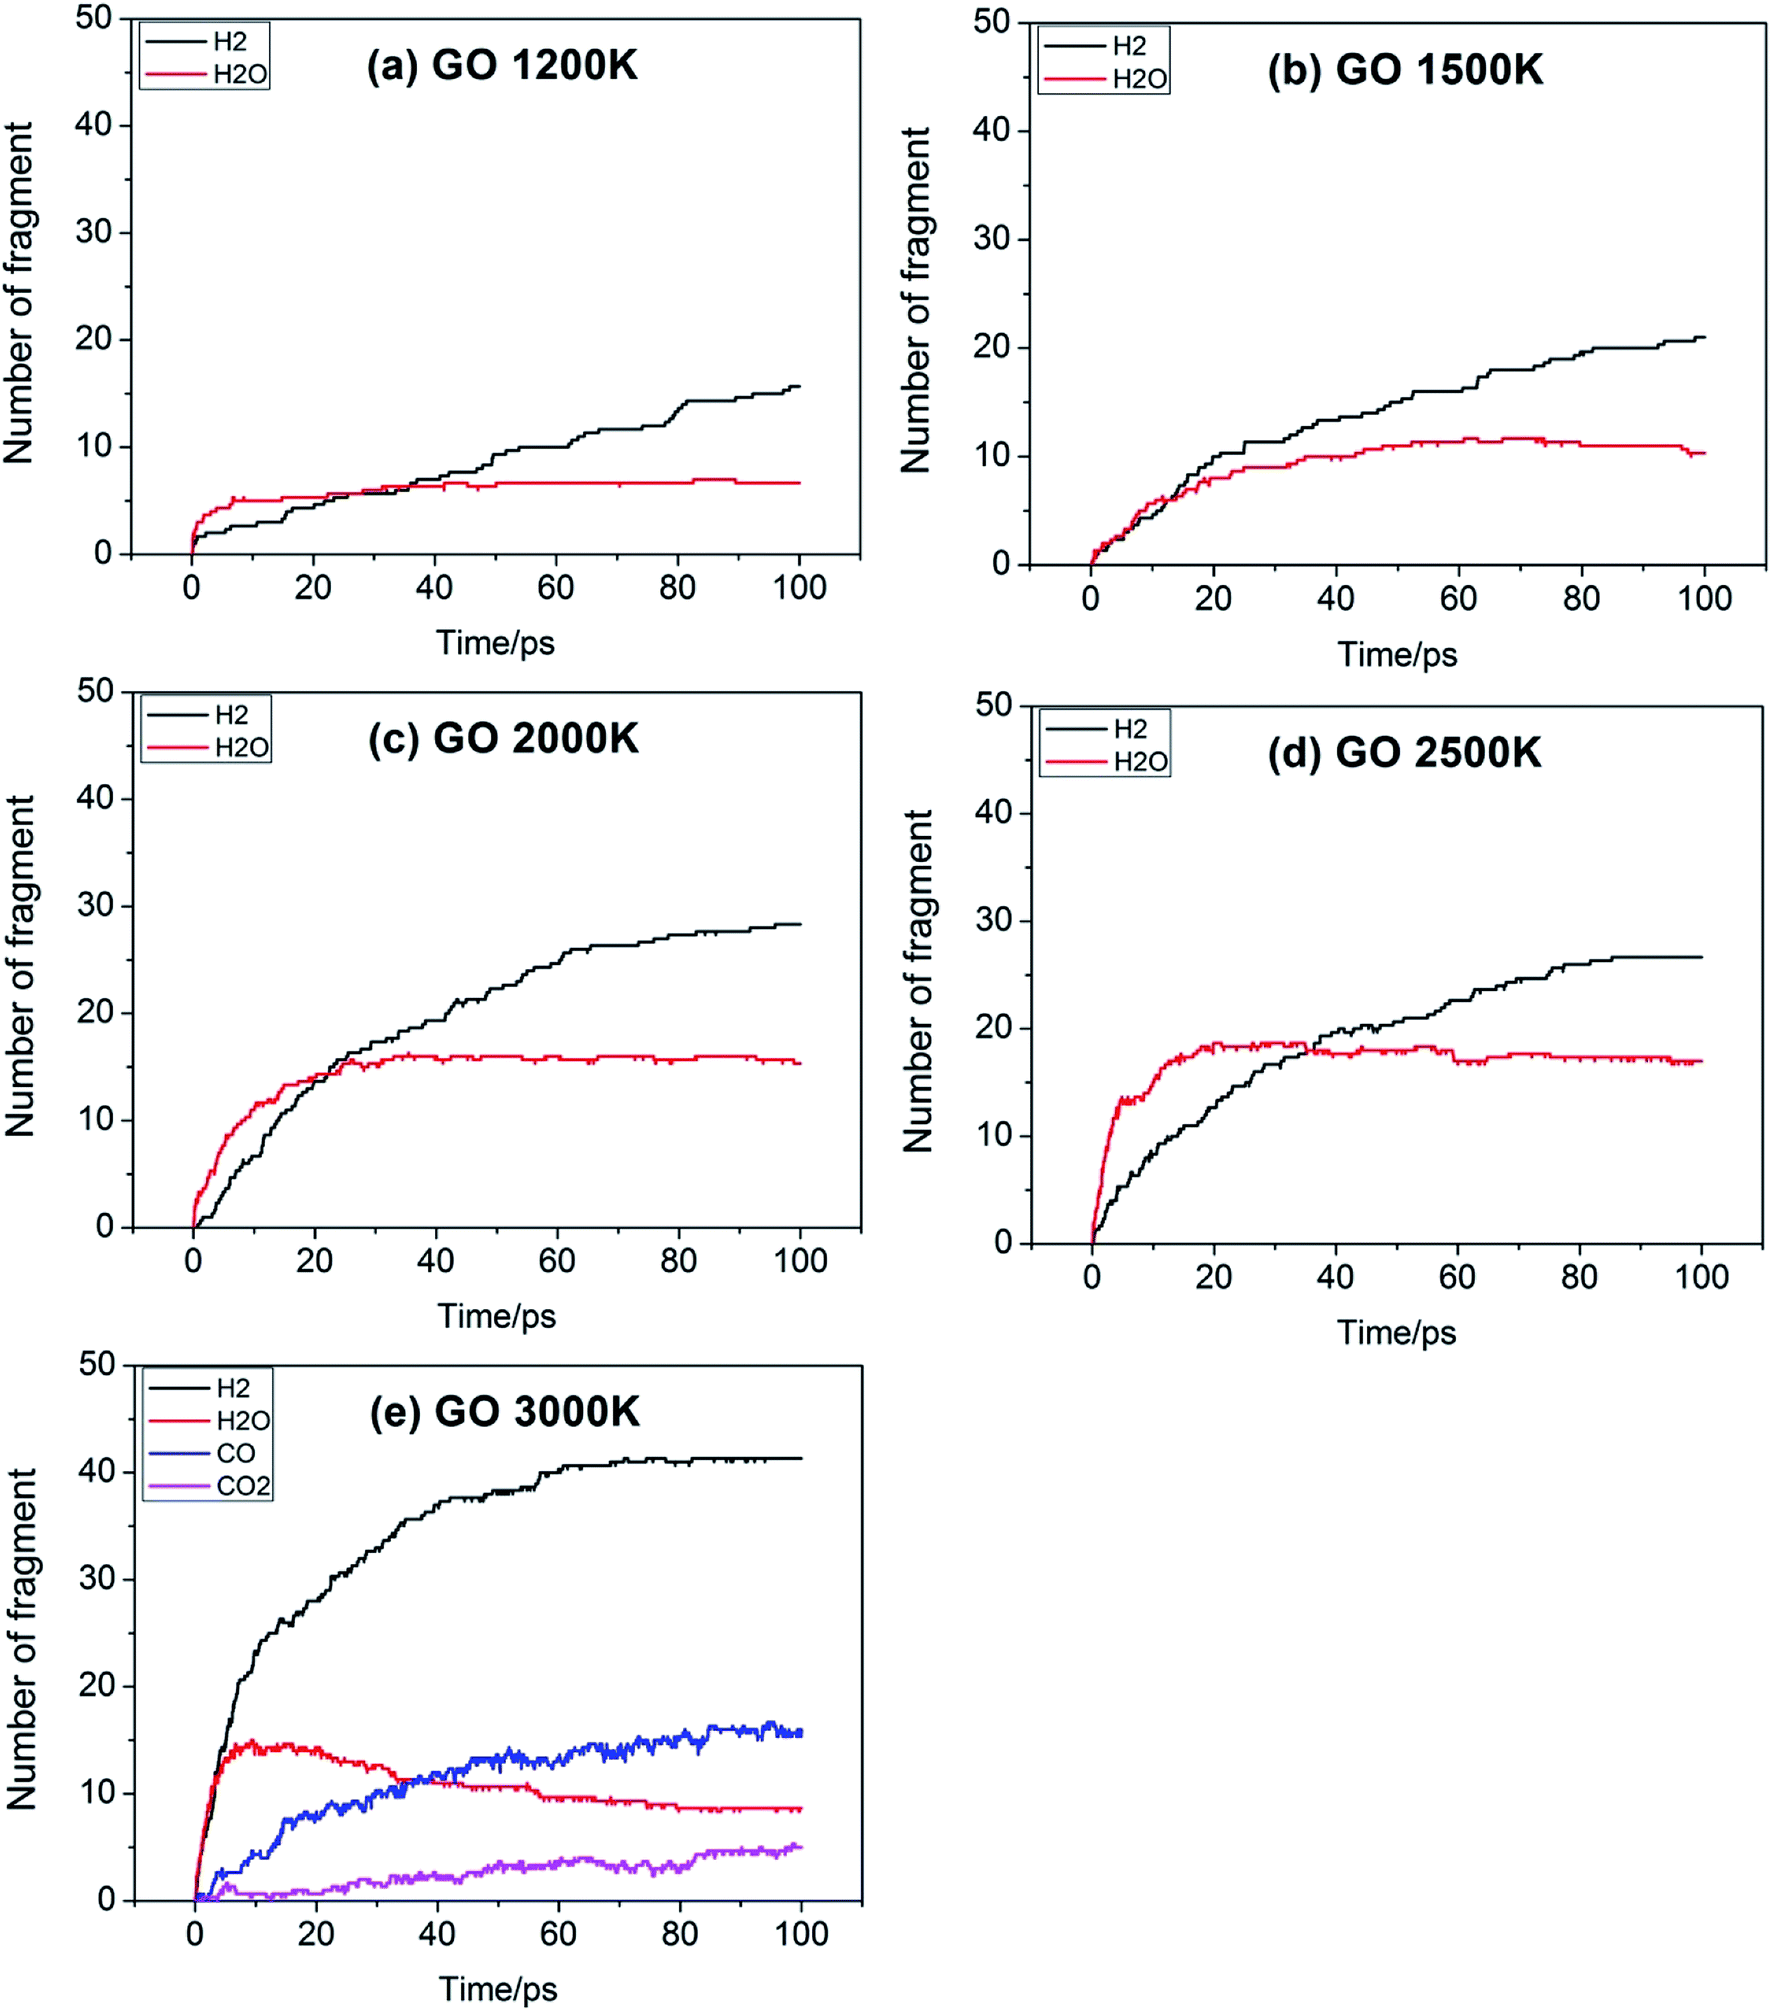 | ||
| Fig. 3 Evolution of key chemical species of GO at different temperatures from 1200 K to 3000 K. | ||
Table 2 shows the initial decay mechanism of GO at 3000 K. The decomposition process of graphene includes the rearrangement of functional oxygen groups at the edges and in the plane, which form oxygen-containing heterocyclic rings. Reactions (1) and (2) in Table 2 show the rearrangement of oxygen-containing groups at the edges and in the plane, respectively. Reaction (3) is the cracking of the six-membered ring on the graphene edges and the formation of a linear chain. It can be seen that the formation of a linear chain is also caused by the rearrangement of oxygen atoms. The two graphene sheets may be connected by C–O–C or C–C bonds (Reaction (4)) and then rearrange into an oxygen-containing heterocyclic ring or a six-membered ring with carbon, in which the two graphene sheets are firmly connected. As for small molecules, such as H2, H2O, H2O2, CO, CO2, they are usually formed by the reaction of hydrogen atoms and hydroxyl radicals with other molecules, and the reaction mechanism is relatively simple.
| Primary reactions | |
|---|---|
 |
(1) |
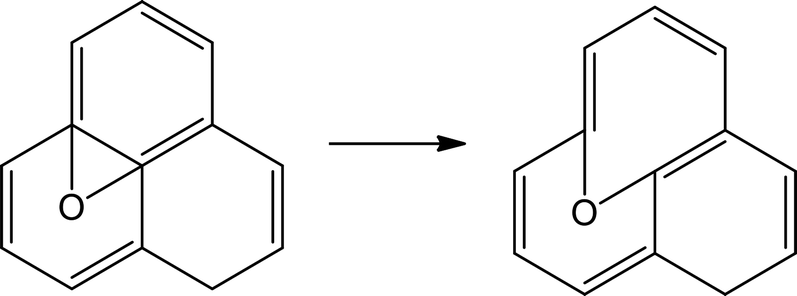 |
(2) |
 |
(3) |
 |
(4) |
Fig. 4 shows the evolution of key chemical species of TAG at different temperatures from 1200 K to 3000 K. Similar to the decomposition process of GO, as the temperature increases, small molecule products increase. At 1200 K, the decomposition products are NH3, H4N2, CH4N4, which proves that TAG has only undergone a preliminary decomposition, that is, breaking of the C–N bonds. However, the NH3 generated during this time is mainly due to the rearrangement of hydrogen atoms in the TAG molecule. At 1500 K, H2N2 and N2 begin to form, indicating that H4N2 undergoes further decomposition. As the temperature continues to rise, H2 appears and the amounts of H2N2, N2, and H2 increase, indicating that the decomposition of TAG is becoming increasingly intensive. When the temperature reaches 2500 K, the amount of NH3 does not change because the macromolecules in the system are almost completely decomposed. When the temperature reaches 3000 K, the amount of all products is basically unchanged, indicating that TAG has been completely decomposed.
 | ||
| Fig. 4 Evolution of key chemical species of TAG at different temperatures from 1200 K to 3000 K. | ||
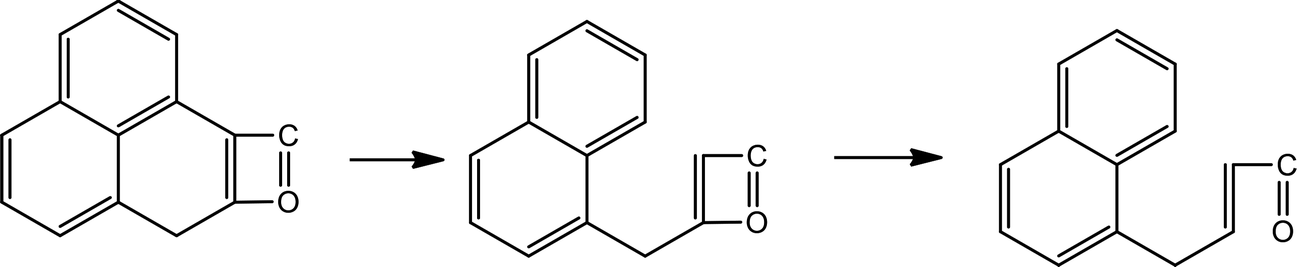
Table 3 shows the initial decay mechanism of TAG at 3000 K. The first reaction is the breaking of C–N bonds, and the H3N2 group detaches from carbon atoms after capturing a hydrogen atom (Reaction (5) in Table 3). The H4N2 generated in Reaction (5) is decomposed into H2N2 and H2 (Reaction (6)). H2N2 can continue to decompose, resulting in the formation of N2 and H2 (Reaction (7)). The CH4N4 group formed in Reaction (5) can be decomposed into HN2 radicals and CH3N2 (Reaction (8)), and the hydrogen atoms in the CH3N2 group can be rearranged to bind to carbon atoms and further decomposed into CHN and H2N radicals (Reaction (9)). The H2N and HN2 radicals formed in the previous reaction can react with free hydrogen radicals or hydrogen atoms on other groups to form NH3 and H2N2, respectively (Reaction (10) and (11)). N2 can also react with the free hydrogen atoms in the system to form HN2 radicals (Reaction (12)). There is another decomposition pathway for the CH3N2 group. If the hydrogen atoms do not rearrange, CH3N2 will be cleaved into a CN group and a H2N2 group. CN can react with other groups to form a nitrile molecule.
| Primary reactions | |
|---|---|
| CH8N6 → CH4N4 + H4N2 | (5) |
| H4N2 → H2N2 + H2 | (6) |
| H2N2 → N2 + H2 | (7) |
| CH4N4 → HN2 + CH3N2 | (8) |
| CH3N2 → CHN + H2N | (9) |
H2N + H ![[left over right harpoons]](https://www.rsc.org/images/entities/char_21cb.gif) NH3 NH3 |
(10) |
| HN2 + H → H2N2 | (11) |
| N2 + H → HN2 | (12) |
Fig. 5 shows the evolution of key chemical species of GO-TAG at different temperatures from 1200 K to 3000 K. At low temperatures, H2, H2O and NH3 are generated, with H2 being the most abundant decomposition product. As the temperature increases, N2, CO, etc. gradually form, indicating violent decomposition of GO and TAG. Similar to GO, the amount of H2 is greater than that of H2O and the amount of H2O no does not increase in the later stages of the reaction. Moreover, in the decomposition process of GO-TAG, almost no of H4N2 and H2N2 are detected because the small molecular groups generated by TAG during the decomposition process are captured by GO and grafted onto six-membered rings at the edge of GO.
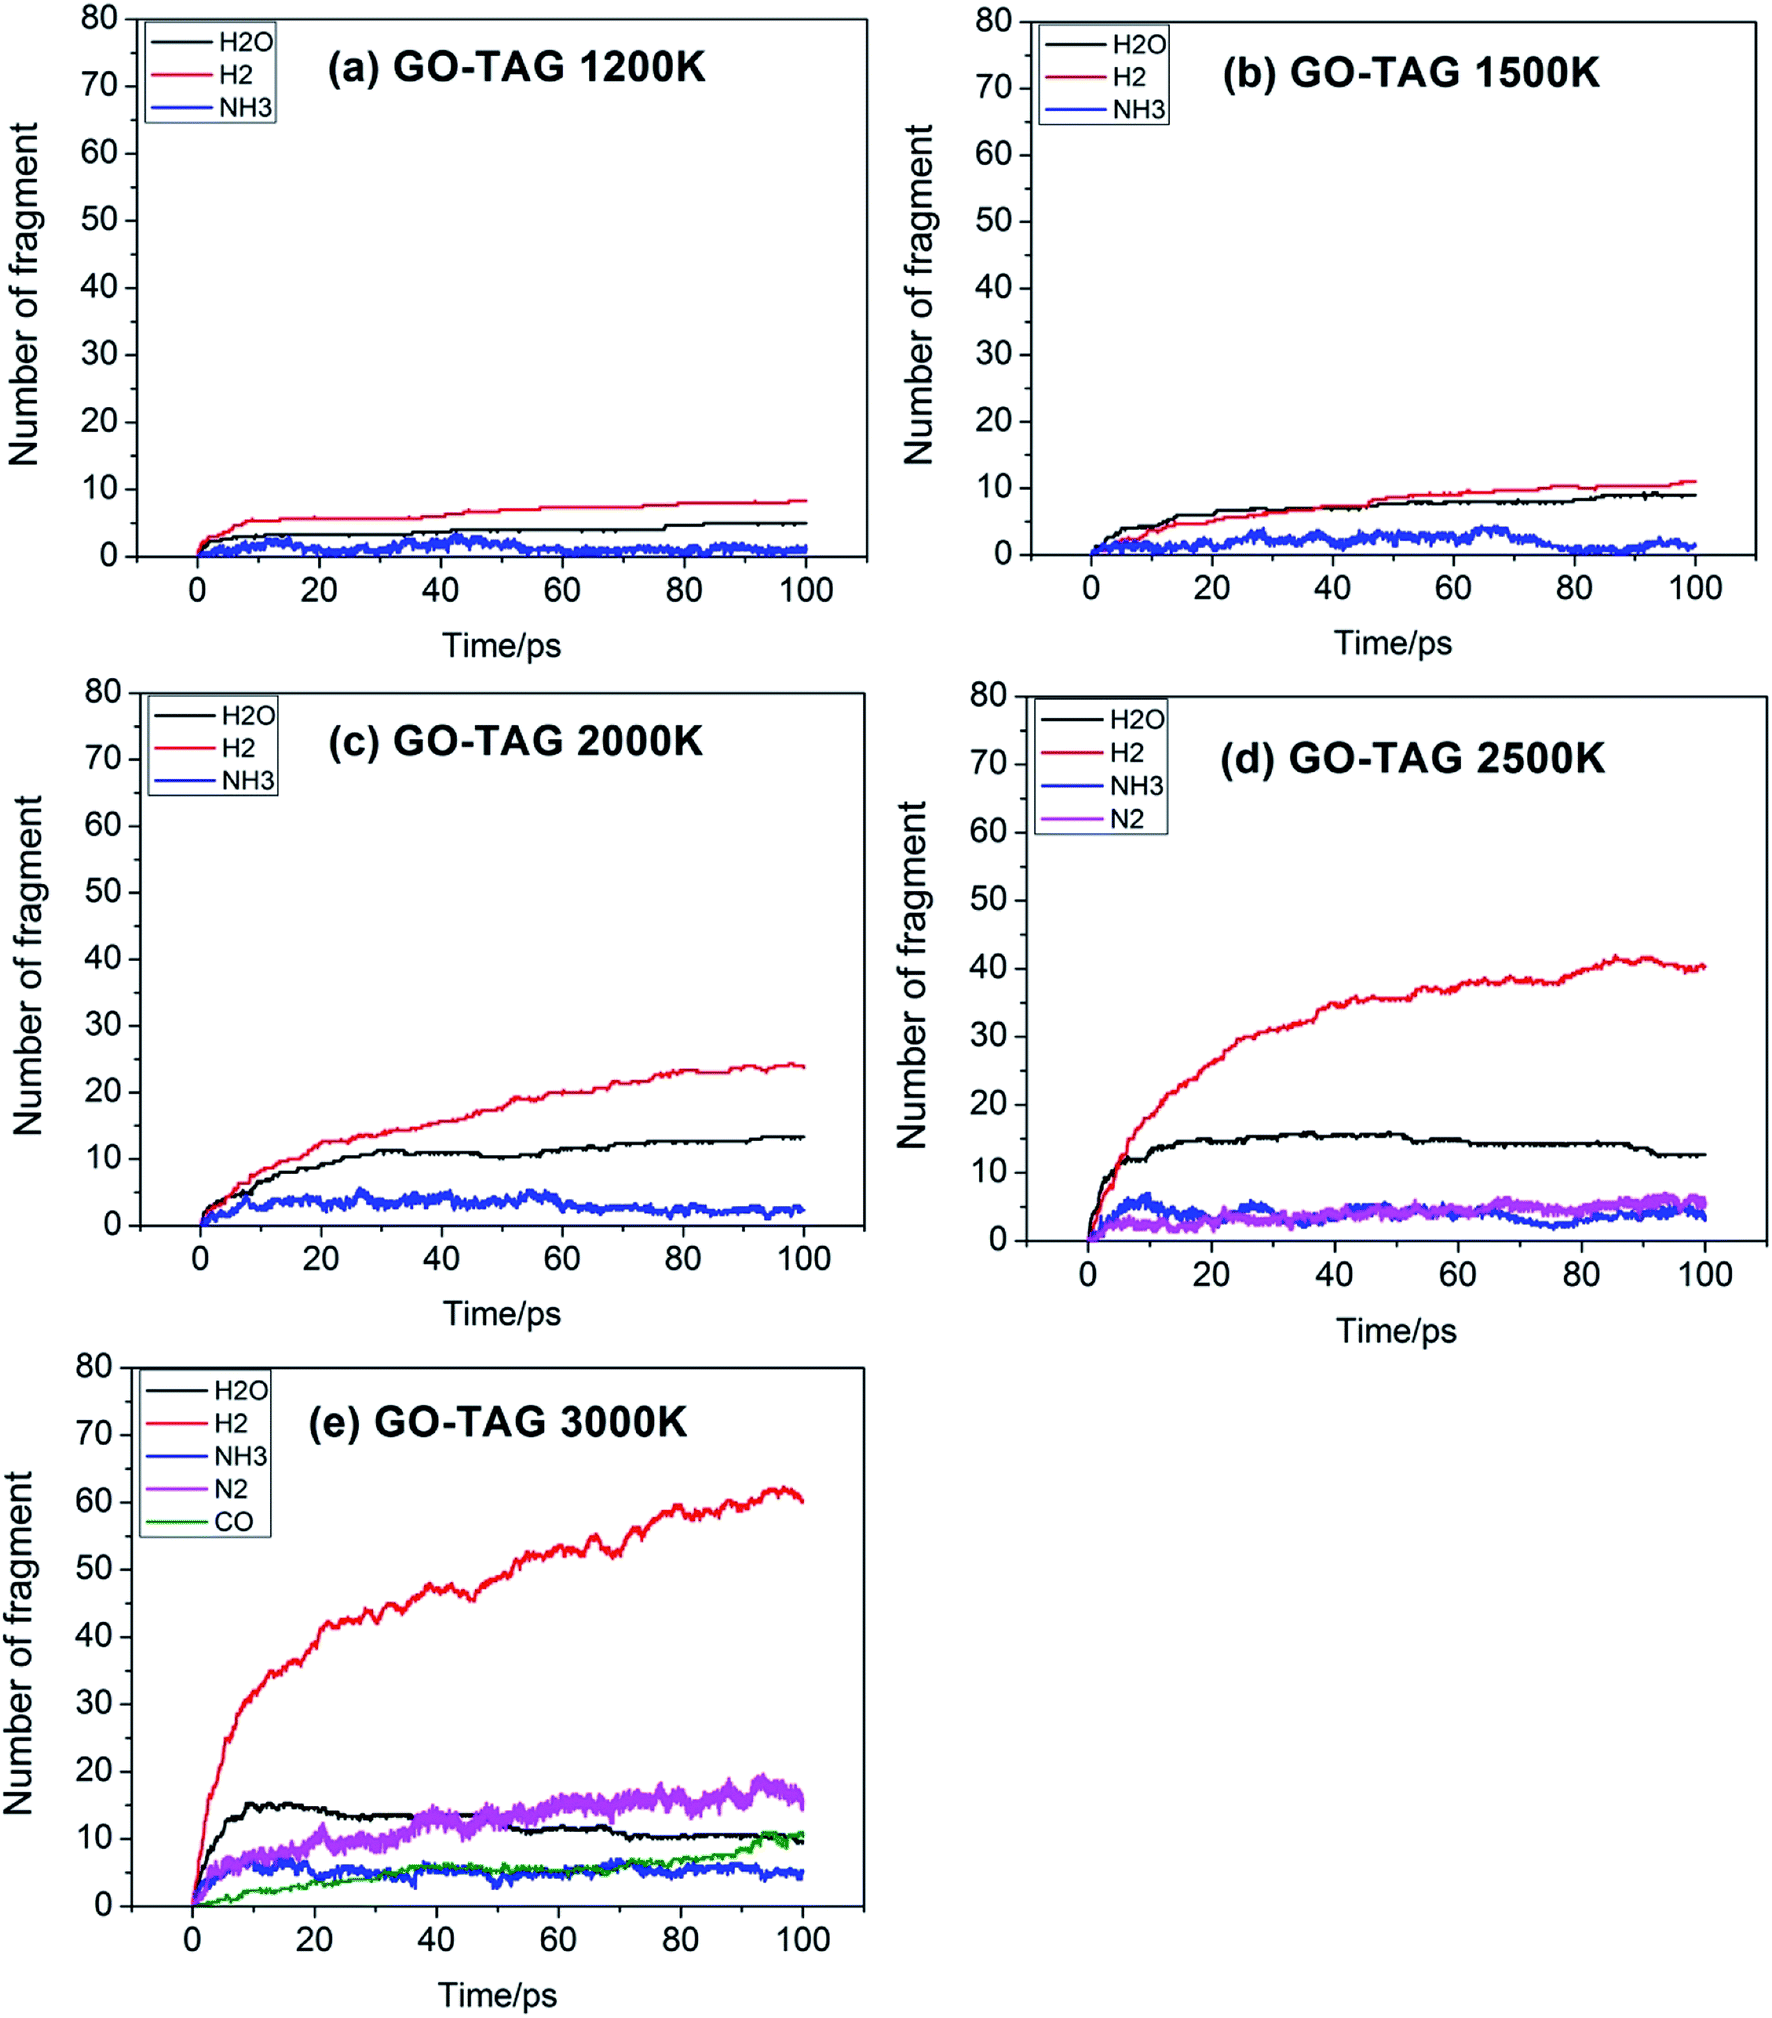 | ||
| Fig. 5 Evolution of key chemical species of GO-TAG at different temperatures from 1200 K to 3000 K. | ||
Table 4 shows the initial decay mechanism of GO-TAG at 3000 K. The first step is the breaking of C–N bonds in TAG, which leaves two nitrogen atoms on the carbonyl (Reaction (13) in Table 4). Hydrogen on nitrogen atoms is not stable and can be taken up by free groups, including ·OH, NH2, etc., or be rearranged to bond to carbon atoms before TAG is decomposed. After TAG is decomposed, CN4H4 attaches to a carbonyl group of GO, and the N–N bond on TAG may be broken. However, there are two ways of breaking this bond: one is direct cleavage, leaving –NH on the carbonyl group; the other is the bonding of –NH to an edge carbon atom on graphene to form a four-membered ring, followed by breakage of the N–N bond. On the other hand, the formed four-membered ring is unstable, leading to breakage of the C–N bond and transfer of the –NH to another carbon atom (Reaction (14)). This is a rearrangement process. Reaction (15) shows that when N![[double bond, length as m-dash]](https://www.rsc.org/images/entities/char_e001.gif) N is attached to the edge of graphene, a diazole ring can form. The structure of this ring is relatively stable, and no cracking of the ring was observed during the kinetic process. Like the decomposition process of graphene oxide, two sheets of graphene may also be connected by oxygen atoms to form a large graphene sheet, but in the decomposition of GO-TAG, nitrogen atoms can also act as a bridge, like oxygen atoms (Reaction (16)). At the same time, similar to the decompositions of TAG and GO, small molecular compounds and radicals, such as H2O, CO, CO2, NH3, N2, H2, HN2, H2N and free hydrogen, are also produced during the decomposition of GO-TAG. The generation mechanism is basically similar.
N is attached to the edge of graphene, a diazole ring can form. The structure of this ring is relatively stable, and no cracking of the ring was observed during the kinetic process. Like the decomposition process of graphene oxide, two sheets of graphene may also be connected by oxygen atoms to form a large graphene sheet, but in the decomposition of GO-TAG, nitrogen atoms can also act as a bridge, like oxygen atoms (Reaction (16)). At the same time, similar to the decompositions of TAG and GO, small molecular compounds and radicals, such as H2O, CO, CO2, NH3, N2, H2, HN2, H2N and free hydrogen, are also produced during the decomposition of GO-TAG. The generation mechanism is basically similar.
| Primary reactions | |
|---|---|
 |
(13) |
 |
(14) |
 |
(15) |
 |
(16) |
3.2 Apparent kinetics of the initial reactions
To study the effect of GO on TAG, the decomposition kinetics were investigated and are reported in this section. We used the ReaxFF force field to obtain the temperature rise curves of TAG and GO-TAG from 300 K–3000 K. Then, TAG and GO-TAG were each decomposed at temperatures of 1500 K, 2000 K, 2500 K, 3000 K and 3500 K, and the number of TAG molecules in each decomposition process was counted. Then, the decomposition activation energies of TAG and GO-TAG were analyzed based on the Arrhenius equation.It can be seen from Fig. 6 that the decomposition temperature of GO-TAG is lower than that of TAG, which is consistent with the experimental results and indicative of the acceleration effect of GO on the initial decomposition of TAG.
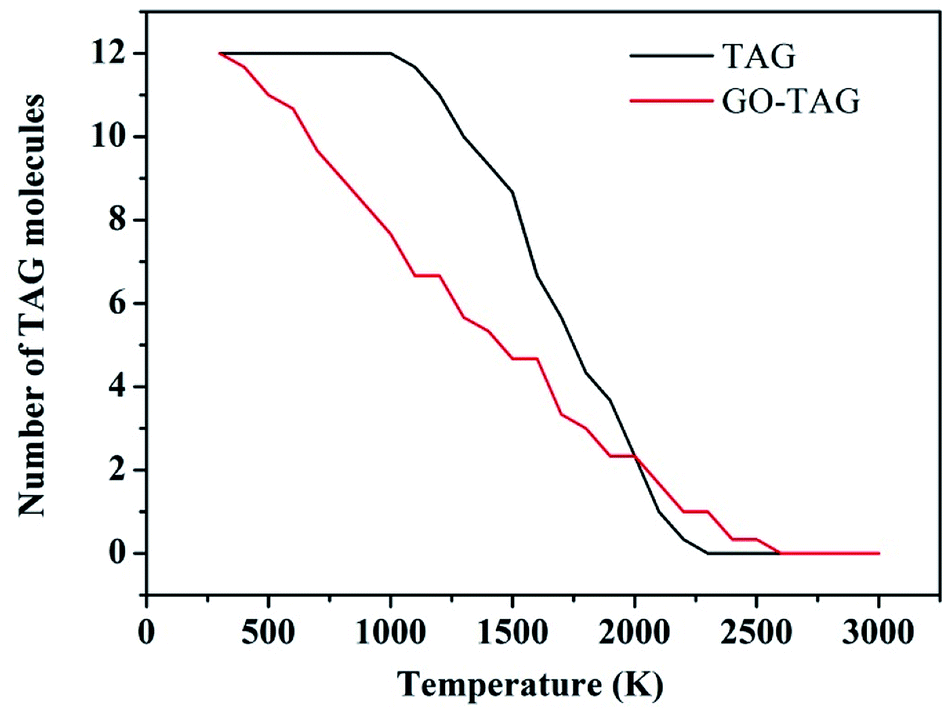 | ||
| Fig. 6 Evolution of TAG molecules at temperatures from 300 K to 3000 K. | ||
Fig. 7a shows the evolution curve of TAG at the different temperatures mentioned above. In the thermal decomposition process, the first step can be considered to be a one-step process. Thus, this step can be described by the first-order reaction rate equation. The behavior of the simulated time evolution profiles for the decomposition of the TAG system, as shown in Fig. 7a, proves that this assumption is reasonable.
 | ||
| Fig. 7 (a) Evolution of the pure TAG molecules over time at various temperatures, where the dotted lines are the curve fitted according to the first order reaction; (b) Arrhenius plot of the rate constants of pure TAG molecules at various temperatures; (c) evolution of TAG molecules over time at various temperatures in GO-TAG, where the dotted lines are the curve fitted according to the first order reaction; (d) Arrhenius plot of the rate constants of TAG molecules at various temperatures in GO-TAG. | ||
According to the first-order reaction kinetic eqn (3),
 | (3) |
Eqn (4) can be obtained by integrating eqn (3)
 | (4) |
Therefore, by using the data presented in Fig. 7a, the corresponding rate constant k can be calculated according to eqn (4) and is listed in Table 5.
The relationship between the reaction rate constant and temperature can be obtained from the Arrhenius eqn (5),
k = A![[thin space (1/6-em)]](https://www.rsc.org/images/entities/char_2009.gif) exp(−Ea/RT) exp(−Ea/RT)
| (5) |
Based on the data presented in Table 5, a graph of lnk versus 1/T can be constructed using the Arrhenius formula, as shown in Fig. 7b. It can be seen from the fitted curve that the intercept and slope are 31.47 and −11.30, respectively, which means that −Ea/R is −11.30 and lnA is 31.47. Therefore, the activation energy of the decomposition of TAG is calculated to be 94.0 kJ mol−1, and the pre-index factor is 4.65 × 10¹³.
The evolution of TAG molecules at different temperatures in GO-TAG is shown in Fig. 7c. Similar to the thermal decomposition process of TAG, the decomposition process of GO-TAG is described by a first-order reaction rate equation. Therefore, by using the data presented in Fig. 7c, the corresponding rate constant k can be calculated according to eqn (4) and is listed in Table 6.
Based on the data presented in Table 6, the plot of lnk versus 1/T can be generated by the Arrhenius formula, as shown in Fig. 7d. It can be seen from the fitted curve that the intercept and slope are 31.32 and −9.46, respectively, which means that −Ea/R is −9.46 and lnA is 31.32. Consequently, the activation energy of the decomposition of TAG is calculated to be 78.6 kJ mol−1, and the pre-index factor is 4.00 × 10¹³.
At the same time, we fit the TAG decomposition curve according to the obtained rate constants (Tables 5 and 6) and the first-order reaction formula as shown in Fig. 7a and c. It can be seen that the fitted curve and the statistical curve are basically consistent, which proves that the trend of the statistical curve is correct, especially at high temperatures. At low temperatures, it may be because the reaction rate is low, resulting in poor curve consistency.
Therefore, it can be seen from the activation energies listed in Tables 5 and 6 that when TAG and GO are combined, the decomposition activation energy of TAG is lowered, which proves that GO can accelerate the decomposition of TAG. This result is similar to the results observed by Yan et al.,6 where the decomposition temperature of GO-TAG was lower than that of pure TAG.
3.3 Image of the initial reactions
As seen from Fig. 8, at 5 ps, the H atom in the TAG molecule will start to transfer, which may cause the breaking of C–N bonds. At 5.5 ps, the N2H4 appears because of the H transfer. At 6 ps, the H atom in the N2H4 is transferring and making N2 and H2 appear at 7 ps. At 9 ps, the –NH2 group captures a H atom in hydrogen and leads to the formation of NH3. TAG molecule has completely decomposed at 10 ps. | ||
| Fig. 8 Evolution of the pure TAG molecules in the first 10 ps at 3000 K (the hydrogen atom is white, the nitrogen atom is blue, and the carbon atom is gray.). | ||
Moreover, the phenomenon of intramolecular and intermolecular hydrogen transfer was observed at 0.5 ps. In previous literature reports, Sergeev et al.16 studied the hydrogen transfer behavior during the thermal decomposition of PETN. Studies have shown that the decomposition activation energy of a PETN single molecule (156 kJ mol−1) is significantly different from the decomposition activation energy of the corresponding condensed phase (82 kJ mol−1). Researchers believe this energy is caused by hydrogen transfer within the system. In this work, we observed similar phenomena, so it can be considered that the transfer of hydrogen atoms in the system promotes the decomposition of TAG molecules.
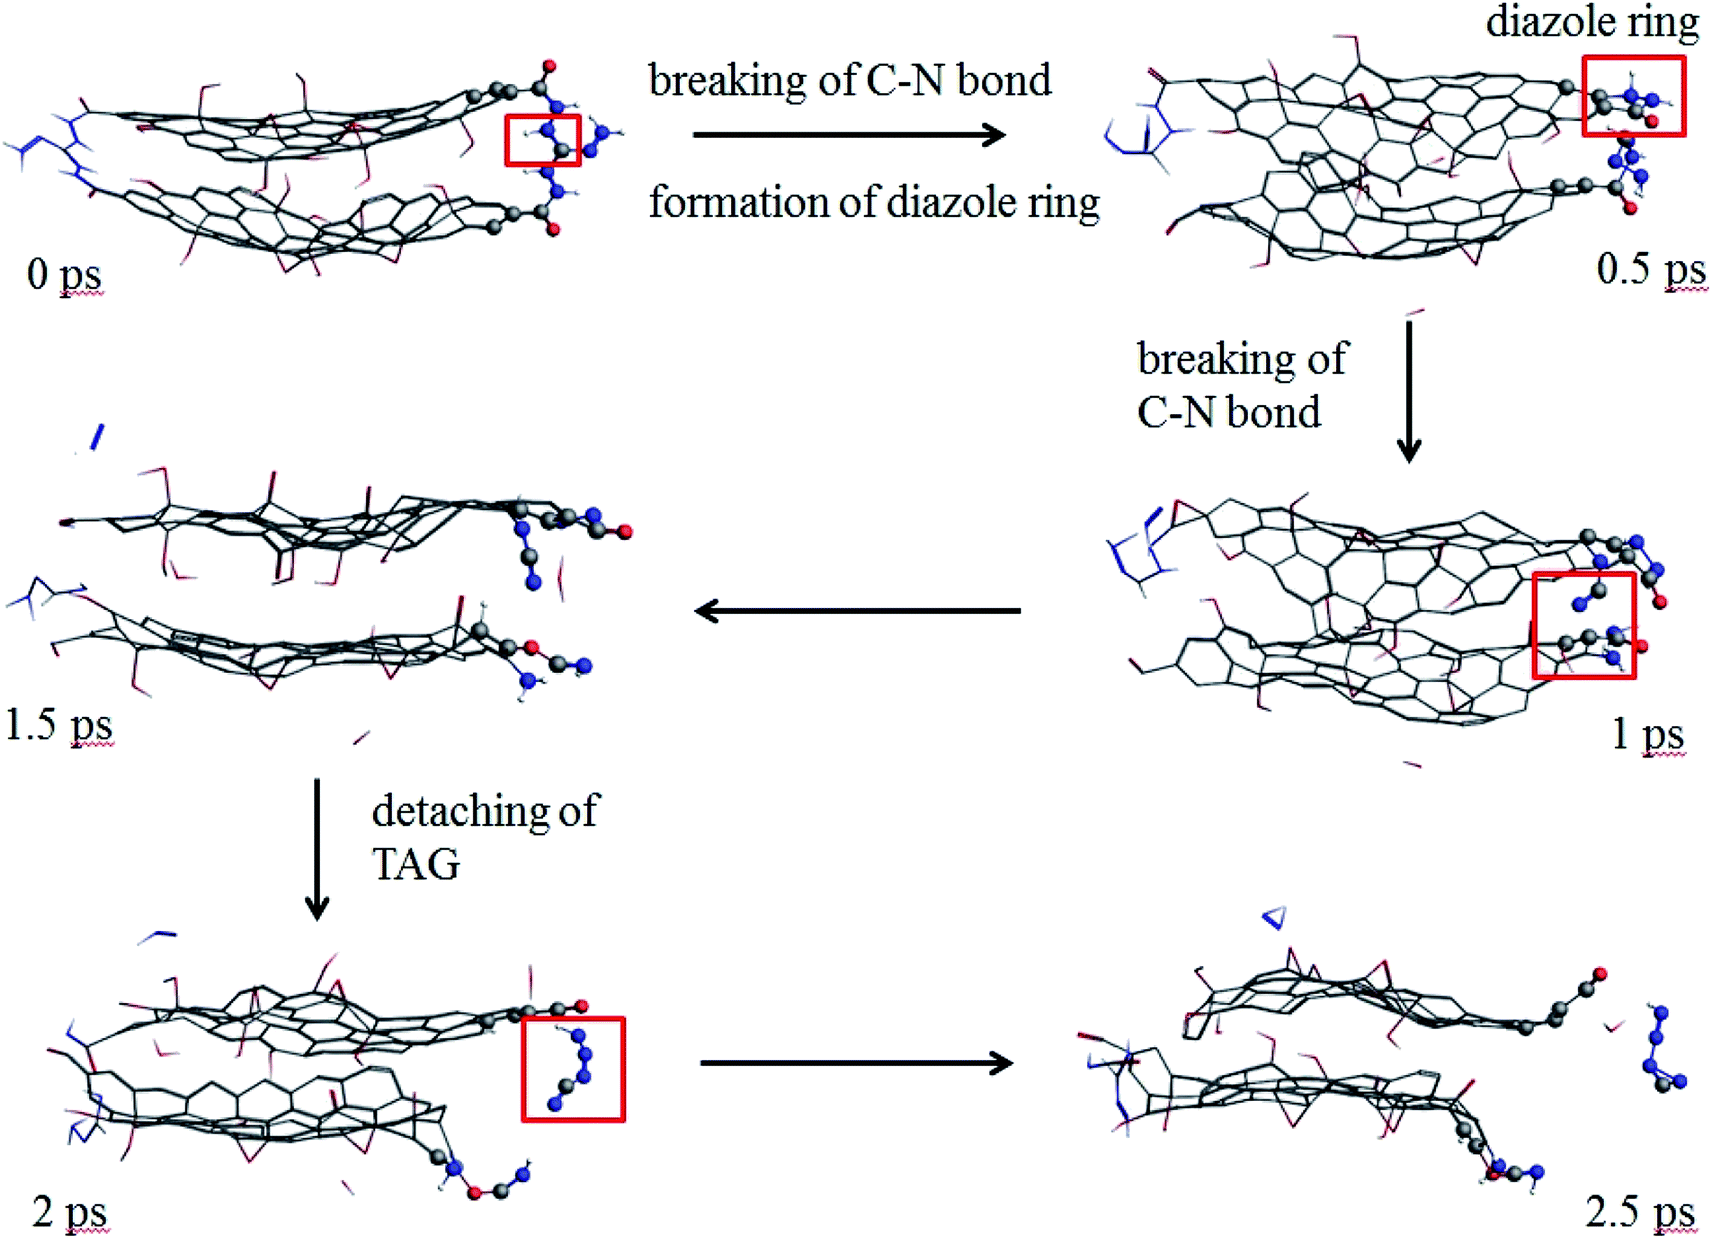
As seen from Fig. 9, at 0.5 ps, the carbon atoms at the edge of the GO promote the decomposition of TAG and form a diazole ring. At 2 ps, part of the TAG molecule is detached from GO. At 2.5 ps, the TAG molecule continues to decompose and has not formed a small molecular product.
 | ||
| Fig. 9 Evolution of GO-TAG molecules in the first 2.5 ps at 3000 K (the hydrogen atom is white, the nitrogen atom is blue, the oxygen atom is red, and the carbon atom is gray.). | ||
In GO-TAG, TAG was observed to decompose at 0.5 ps, earlier than the decomposition time of pure TAG molecules, proving that GO promotes the initial decomposition process of TAG.
3.4 Research of thermal stability
To verify the calculation results, the temperature rise of GO-TAG and TAG was studied by DSC and TG methods. The results are shown in Fig. 10. As seen from the DSC curve, the decomposition peak temperature of TAG is approximately 240 °C and that of GO-TAG is approximately 180 °C. This result shows that GO promotes the decomposition of TAG, and its decomposition temperature is approximately 60 °C lower than that of TAG. At the same time, the result of the TGA experiment shows that the accelerated decomposition of GO-TAG starts at 180 °C, while that of TAG starts at 241.2 °C; these results are consistent with the DSC experiment. This work has been described before.6 It can be seen from Fig. 6 that the calculation results of ReaxFF are in accordance with the experimental results, indicating that GO promotes the thermal decomposition TAG.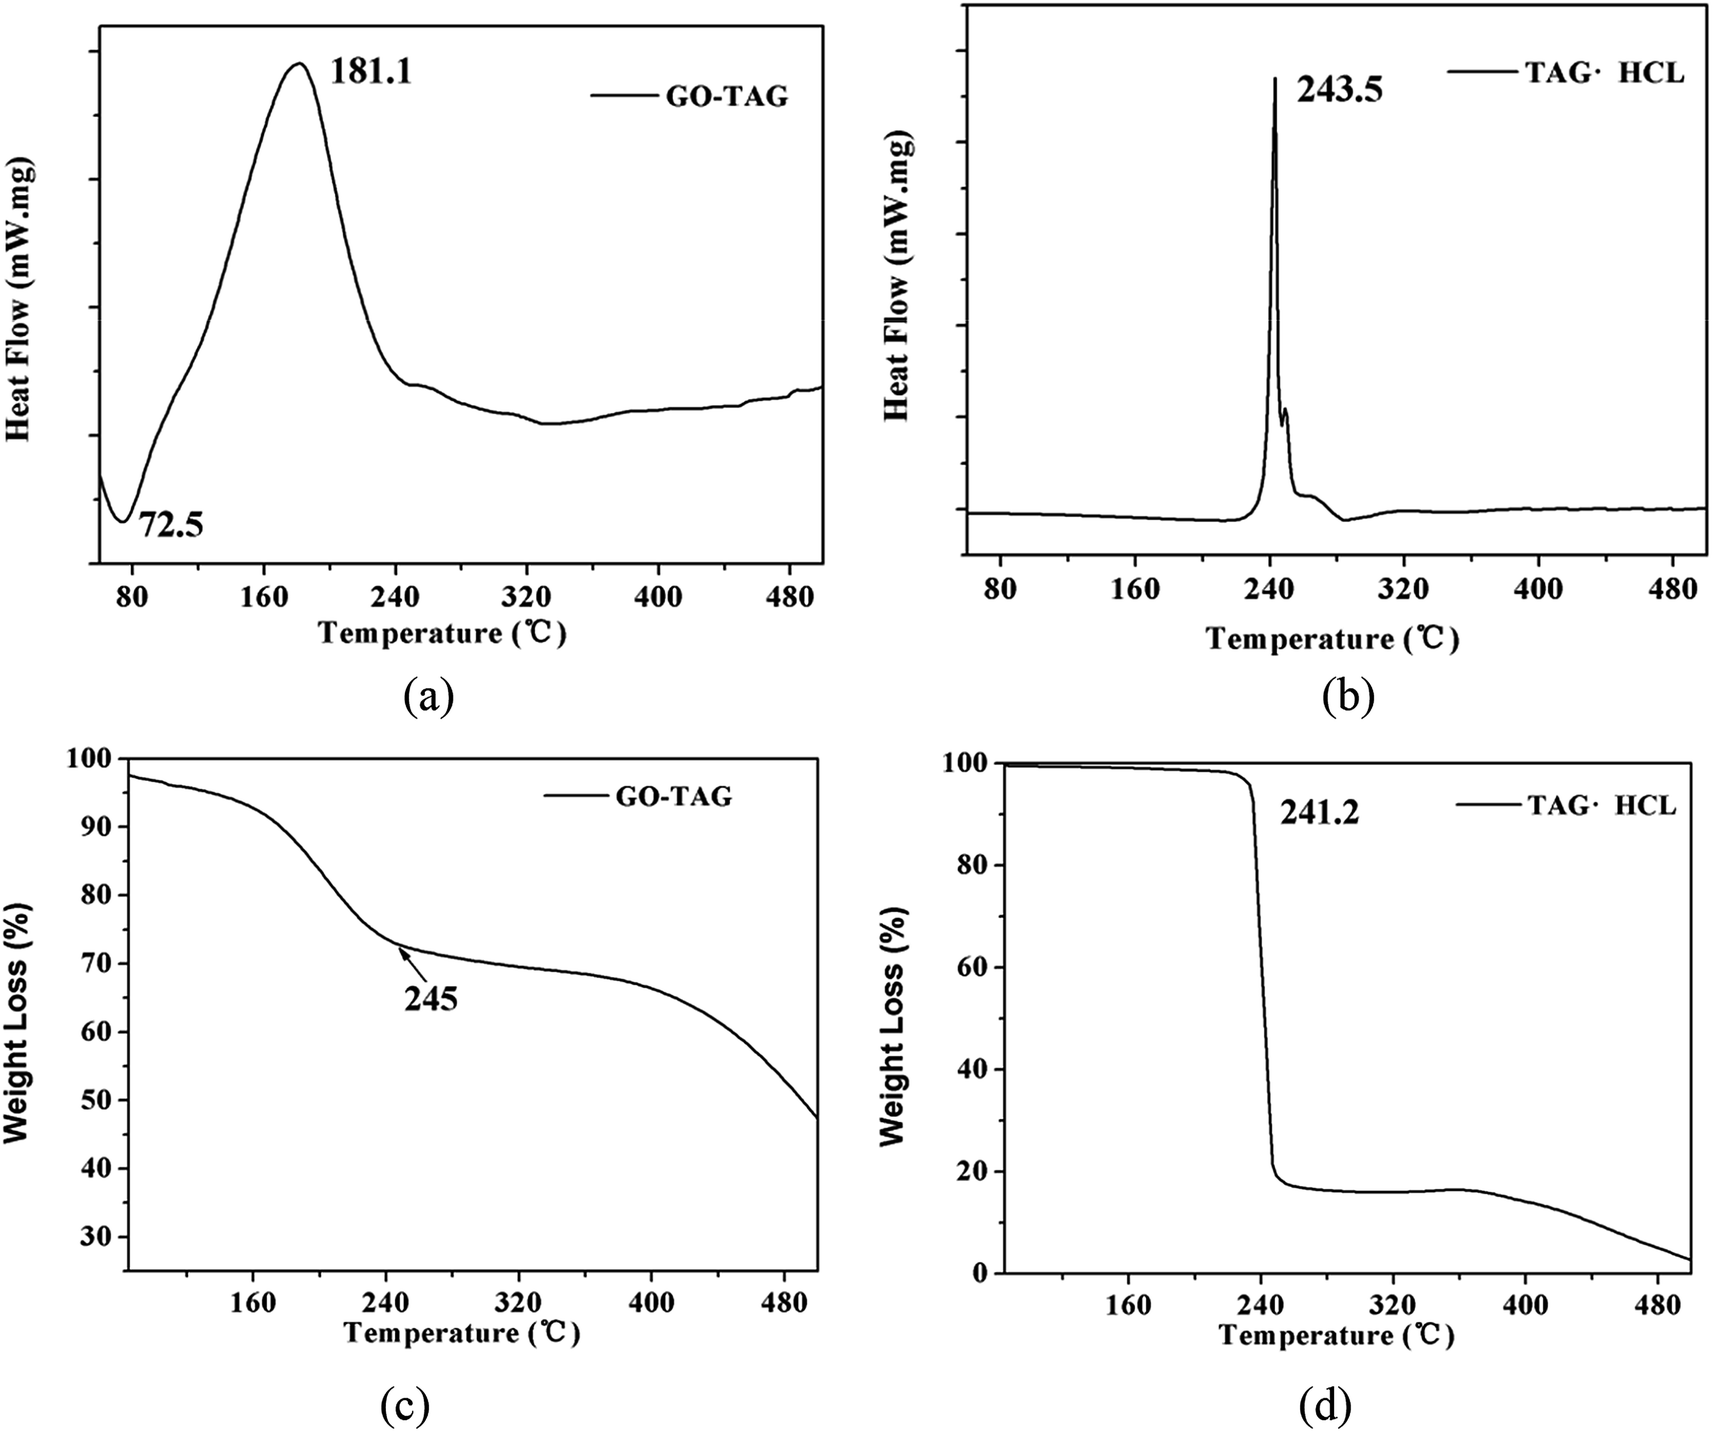 | ||
| Fig. 10 0DSC (a and b) and TGA (c and d) curves of TAG and GO-TAG at a heating rate of 10 °C min−1. | ||
4 Conclusions
In this work, the decomposition processes of GO, TAG and GO-TAG were studied by ReaxFF force field. The acceleration effect of GO on TAG decomposition was further investigated. The following conclusions were drawn.(1) The decomposition products of GO at temperatures lower than 2500 K are H2 and H2O, and the CO bond at the GO edge is broken at 3000 K to form CO2 and CO. Small layer GOs have a tendency to agglomerate into a large carbon cluster during the decomposition process. The main decomposition products of TAG are NH3, N2 and H2. The decomposition process of GO-TAG is similar to that of GO, and carbon clusters are formed. The decomposition products are H2O, NH3, N2 and H2. TAG generates HN2, H2N and free H radicals during the decomposition process.
(2) The initial decomposition activation energy of TAG is 94.0 kJ mol−1, and the initial decomposition activation energy of the TAG molecule in GO-TAG is 78.6 kJ mol−1; that is, GO reduces the decomposition activation energy of TAG by 15.4 kJ mol−1. Through analysis of the initial decomposition processes of TAG and GO-TAG, we found that the initial decomposition of TAG was mainly due to hydrogen transfer within the molecule. The assistance of GO of the initial decomposition of TAG is mainly manifested in the carbon atoms at the edge of GO, which promote the decomposition of TAG molecules.
(3) According to the DSC experiments, the thermal decomposition temperature of GO-TAG is lower than that of TAG, and the experimental results for TG are consistent with the DSC experimental results, proving that GO promotes the thermal decomposition of TAG when GO and TAG are combined, which is consistent with the calculation results. Therefore, TAG will quickly decompose due to the acceleration of GO in propellant combustion. This process produces a “new” GO, which catalyzes the decomposition of components including RDX, HMX, etc. in the propellant. At the same time, many free radicals (HN2, H2N and free H) are generated during the decomposition of TAG to catalyze the decomposition of other components in the propellant, which enhances the catalytic ability of GO in the propellant.
Conflicts of interest
There are no conflicts to declare.Acknowledgements
This work was supported by the National Natural Science Foundation of China (21875185, 21975150) and China Postdoctoral Science Foundation (2019M653532).References
- K. Nagayama and Y. Oyumi, Combustion Characteristics of High Burn Rate Azide Polymer Propellant, Propellants, Explos., Pyrotech., 2010, 21, 74–78 CrossRef.
- D. Saravanakumar, N. Sengottuvelan, V. Narayanan, M. Kandaswamy and T. L. Varghese, Burning-rate enhancement of a high-energy rocket composite solid propellant based on ferrocene-grafted hydroxyl-terminated polybutadiene binder, J. Appl. Polym. Sci., 2010, 119, 2517–2524 CrossRef.
- Y. Yuan, J. Wei, Y. Wang, S. Ping, F. Li, P. Li, F. Zhao and H. Gao, Hydrothermal preparation of Fe2O3/graphene nanocomposite and its enhanced catalytic activity on the thermal decomposition of ammonium perchlorate, Appl. Surf. Sci., 2014, 303, 354–359 CrossRef CAS.
- Y. Lan, X. Li, G. Li and Y. Luo, Sol–gel method to prepare graphene/Fe2O3 aerogel and its catalytic application for the thermal decomposition of ammonium perchlorate, J. Nanopart. Res., 2015, 17, 395 CrossRef.
- M. A. Fertassi, K. T. Alali, L. Qi, R. Li, P. Liu, J. Liu, L. Liu and J. Wang, Catalytic effect of CuO nanoplates, graphene (G)/CuO nanocomposite and AL/G/CuO composite on the thermal decomposition of ammonium perchlorate, RSC Adv., 2016, 6, 74155–74161 RSC.
- Q. L. Yan, A. Cohen, N. Petrutik, A. Shlomovich, L. Burstein, S. P. Pang and M. Gozin, Highly Insensitive and Thermostable Energetic Coordination Nanomaterials Based on Functionalized Graphene Oxides, J. Mater. Chem. A, 2016, 108, 111–117 Search PubMed.
- S. Chen, W. He, C.-J. Luo, T. An, J. Chen, Y. Yang, P.-J. Liu and Q.-L. Yan, Thermal behavior of graphene oxide and its stabilization effects on transition metal complexes of triaminoguanidine, J. Hazard. Mater., 2019, 368, 404–411 CrossRef CAS.
- A. J. Bracuti, Structure of 1,2,3-triaminoguanidine (TAG), Acta Crystallogr., 1986, 42, 1887–1889 Search PubMed.
- N. Wingborg and N. V. Latypov, Triaminoguanidine dinitramide, TAGDN: synthesis and characterization, Propellants, Explos., Pyrotech., 2003, 28, 314–318 CrossRef CAS.
- A. C. T. V. Duin, S. Dasgupta, F. Lorant and W. A. Goddard, ReaxFF: A Reactive Force Field for Hydrocarbon, J. Phys. Chem. A, 2001, 105, 9396–9409 CrossRef.
- K. D. Nielson, A. C. T. Duin Van, O. Jonas, D. Wei-Qiao and W. A. Goddard, Development of the ReaxFF reactive force field for describing transition metal catalyzed reactions, with application to the initial stages of the catalytic formation of carbon nanotubes, J. Phys. Chem. A, 2005, 109, 493–499 CrossRef CAS.
- J. E. Mueller, A. C. T. V. Duin and W. A. Goddard, Development and Validation of ReaxFF Reactive Force Field for Hydrocarbon Chemistry Catalyzed by Nickel, J. Phys. Chem. C, 2010, 114, 4939–4949 CrossRef CAS.
- L. Zhang, S. V. Zybin, A. C. T. V. Duin, S. Dasgupta and W. A. Goddard, Shock Induced Decomposition and Sensitivity of Energetic Materials by ReaxFF Molecular Dynamics, in AIP Conference Proceedings, American Institute of Physics, 2006 Search PubMed.
- L. Zhang, S. V. Zybin, A. C. T. V. Duin, S. Dasgupta and A. W. Goddard III, Thermal Decomposition of Energetic Materials by ReaxFF Reactive Molecular Dynamics, AIP Conf. Proc., 2006, 845, 589–592 CrossRef CAS.
- O. Sergeev and A. Yanilkin, Kinetic model for thermal decomposition of energetic materials from ReaxFF molecular dynamics, in Aps Shock Compression of Condensed Matter Meeting, 2015 Search PubMed.
- O. V. Sergeev and A. V. Yanilkin, Hydrogen Transfer in Energetic Materials from ReaxFF and DFT Calculations, J. Phys. Chem. A, 2017, 121, 3019–3027 CrossRef CAS.
- H. Si-Ping, A. C. T. Duin Van, W. A. Goddard and S. Alejandro, Thermal decomposition of condensed-phase nitromethane from molecular dynamics from ReaxFF reactive dynamics, J. Phys. Chem. B, 2011, 115, 6534–6540 CrossRef.
- S. Sasha, D. A. Dikin, G. H. B. Dommett, K. M. Kohlhaas, E. J. Zimney, E. A. Stach, R. D. Piner, S. B. T. Nguyen and R. S. Ruoff, Graphene-based composite materials, Nature, 2006, 442, 282–286 CrossRef.
- S. Stankovich, D. A. Dikin, R. D. Piner, K. A. Kohlhaas, A. Kleinhammes, Y. Jia, W. Yue, S. B. T. Nguyen and R. S. Ruoff, Synthesis of graphene-based nanosheets via chemical reduction of exfoliated graphite oxide, Carbon, 2007, 45, 1558–1565 CrossRef CAS.
- K. Keun Soo, Z. Yue, J. Houk, L. S. Yoon, K. Jong Min, K. S. Kim, A. Jong-Hyun, K. Philip, C. Jae-Young and H. Byung Hee, Large-scale pattern growth of graphene films for stretchable transparent electrodes, Nature, 2009, 457, 706–710 CrossRef.
- L. Changgu, W. Xiaoding, J. W. Kysar and H. James, Measurement of the elastic properties and intrinsic strength of monolayer graphene, Science, 2008, 321, 385–388 CrossRef.
- X. Wang, L. Zhi and K. Müllen, Conductive Graphene Electrodes for Dye-Sensitized Solar Cells, Nano Lett., 2008, 8, 323–327 CrossRef CAS.
- P. Zhe, H. Gu, M. T. Wu, Y. Li and C. Yu, Graphene-based functional materials for organic solar cells [Invited], Opt. Mater. Express, 2012, 2, 814–824 CrossRef.
- S. Watcharotone, D. A. Dikin, S. Stankovich, R. Piner, I. Jung, G. H. Dommett, G. Evmenenko, S. E. Wu, S. F. Chen and C. P. Liu, Graphene-silica composite thin films as transparent conductors, Nano Lett., 2007, 7, 1888–1892 CrossRef CAS.
- Y. Zongyou, S. Shuangyong, S. Teddy, W. Shixin, H. Xiao, H. Qiyuan, L. Yeng Ming and Z. Hua, Organic photovoltaic devices using highly flexible reduced graphene oxide films as transparent electrodes, ACS Nano, 2010, 4, 5263–5268 CrossRef.
- S. A. Hasan, J. L. Rigueur, R. R. Harl, A. J. Krejci, G. J. Isabel, B. R. Rogers and J. H. Dickerson, Transferable graphene oxide films with tunable microstructures, ACS Nano, 2010, 4, 7367–7372 CrossRef CAS PubMed.
- S. Yongfu, G. Shan, L. Fengcai and X. Yi, Atomically-thin two-dimensional sheets for understanding active sites in catalysis, Chem. Soc. Rev., 2014, 44, 623–636 Search PubMed.
- J. Zhang and L. Dai, Heteroatom-Doped Graphitic Carbon Catalysts For Efficient Electrocatalysis Of Oxygen Reduction Reaction, ACS Catal., 2015, 5, 21–28 Search PubMed.
- W. M. Wu, C. S. Zhang and S. B. Yang, Controllable synthesis of sandwich-like graphene-supported structures for energy storage and conversion, N. Carbon Mater., 2017, 32, 1–14 CrossRef.
- M. Fan, Z. Q. Feng, C. Zhu, C. Xiao, C. Chen, J. Yang and D. Sun, Recent progress in 2D or 3D N-doped graphene synthesis and the characterizations, properties, and modulations of N species, J. Mater. Sci., 2016, 51, 10323–10349 CrossRef CAS.
- Z. F. Huang, J. Wang, Y. Peng, C. Y. Jung and W. Xin, Design of Efficient Bifunctional Oxygen Reduction/Evolution Electrocatalyst: Recent Advances and Perspectives, Adv. Energy Mater., 2017, 7, 1700544 CrossRef.
- Y. Zou, F. Li, Z. H. Zhu, M. W. Zhao, X. G. Xu and X. Y. Su, An ab initio study on gas sensing properties of graphene and Si-doped graphene, Eur. Phys. J. B, 2011, 81, 475–479 CrossRef CAS.
- F. Yavari, Z. Chen, A. V. Thomas, W. Ren, H.-M. Cheng and N. Koratkar, High Sensitivity Gas Detection Using a Macroscopic Three-Dimensional Graphene Foam Network, Sci. Rep., 2011, 1, 166 CrossRef.
- L. Na, M. Cao, Q. Wu and C. Hu, A facile one-step method to produce Ni/graphene nanocomposites and their application to the thermal decomposition of ammonium perchlorate, CrystEngComm, 2011, 14, 428–434 Search PubMed.
- L. Li-Min, C. Roberto, S. Annabella, D. M. Dabbs, I. A. Aksay and R. A. Yetter, Enhanced thermal decomposition of nitromethane on functionalized graphene sheets: ab initio molecular dynamics simulations, J. Am. Chem. Soc., 2012, 134, 19011–19016 CrossRef.
- L. Zhang, S. V. Zybin, A. C. Van Duin, S. Dasgupta, W. A. Goddard III and E. M. Kober, Carbon cluster formation during thermal decomposition of octahydro-1, 3, 5, 7-tetranitro-1, 3, 5, 7-tetrazocine and 1, 3, 5-triamino-2, 4, 6-trinitrobenzene high explosives from ReaxFF reactive molecular dynamics simulations, J. Phys. Chem. A, 2009, 113, 10619–10640 CrossRef CAS.
- K. Chenoweth, S. Cheung, A. C. Van Duin, W. A. Goddard and E. M. Kober, Simulations on the thermal decomposition of a poly (dimethylsiloxane) polymer using the ReaxFF reactive force field, J. Am. Chem. Soc., 2005, 127, 7192–7202 CrossRef CAS.
- L. Lianchi, L. Yi, S. V. Zybin, S. Huai and W. A. Goddard, ReaxFF-lg: correction of the ReaxFF reactive force field for London dispersion, with applications to the equations of state for energetic materials, J. Phys. Chem. A, 2011, 115, 11016–11022 CrossRef.
Footnote |
| † Electronic supplementary information (ESI) available. See DOI: 10.1039/c9ra04187g |
| This journal is © The Royal Society of Chemistry 2019 |