 Open Access Article
Creative Commons Attribution 3.0 Unported Licence
Magnetic and magnetocaloric properties of La0.55Bi0.05Sr0.4CoO3 and their implementation in critical behaviour study and spontaneous magnetization estimation
F. Saadaoui *a,
Muaffaq M. Nofalb,
R. M'nassri
 *a,
M. Koubaac,
N. Chniba-Boudjadad and
A. Cheikhrouhouc
aUnité de Recherche Matériaux Avancés et Nanotechnologies (URMAN), Institut Supérieur des Sciences Appliquées et de Technologie de Kasserine, Kairouan University, BP 471, Kasserine 1200, Tunisia. E-mail: saadaoui.fadhel80@gmail.com; rafik_mnassri@yahoo.fr
bDepartment of Mathematics and General Sciences, Prince Sultan University, P. O. Box 66833, Riyadh 11586, Saudi Arabia
cLT2S Lab (LR16 CNRS 01), Digital Research Center of Sfax, Sfax Technopark, Cité El Ons, B.P. 275, 3021, Tunisia
dInstitut NEEL, B. P.166, 38042 Grenoble Cedex 09, France
First published on 12th August 2019
Abstract
In this work, we present the results of the magnetic, critical, and magnetocaloric properties of the rhombohedral-structured La0.55Bi0.05Sr0.4CoO3 cobaltite. Based on the modified Arrott plot, Kouvel–Fisher, and critical isotherm analyses, we obtained the values of critical exponents (β, γ, and δ) as well as Curie temperature (TC) for the investigated compound. These components were consistent with their corresponding values and they were validated by the Widom scaling law and scaling theory. The obtained critical exponents were close to the theoretical prediction of the mean-field model values, revealing the characteristic of long-range ferromagnetic interactions. The magnetic entropy, heat capacity, and local exponent n(T, μ0H) of the La0.55Bi0.05Sr0.4CoO3 compound collapsed to a single universal curve, confirming its universal behaviour. The estimated spontaneous magnetization value extracted through the analysis of the magnetic entropy change was consistent with that deduced through the classical extrapolation of the Arrott curves. Thus, the magnetic entropy change is a valid and useful approach to estimate the spontaneous magnetization of La0.55Bi0.05Sr0.4CoO3.
1. Introduction
As a member of perovskite oxides, cobaltites are important agile and multifunctional materials that are very promising for several applications, including high-temperature oxygen separation membranes, cathodes in solid oxide fuel cells (SOFCs), magnetic storage, and magnetic refrigeration.1–3 The Co-based sister compounds of manganites have been less intensively studied.4–6 It is well-known that the similar Hund's rule exchange energy and crystal-field energy both lead to an additional spin-state degree of freedom in cobaltites, which results in close competition between the multiple ground states. This, in turn, leads to phenomena such as magnetoelectronic phase separation, colossal magnetoresistance, and magnetocaloric effect. The spin state (ST) of cobalt ions is very sensitive to the application of external stimuli such as magnetic and electrical fields, temperature, pressure, or compositional doping.7,8 This sensitivity is due to the very small energy difference between the t2g and eg levels. Consequently, the state of Co can be presented in a low-spin (LS), intermediate-spin (IS), or high-spin (HS) state.4,5,8 This ability of Co to exist in several STs given a principal property distinguishes the cobalt oxides from other transition metals such as manganese and makes the physical phenomena observed in the cobalt oxides very complex, due to which they have not been entirely comprehended so far. The complexity of STs provides promising opportunities for basic science as well as electronic applications, inducing a multifunctional characteristic to cobalt oxides. The latter property derives from the fact that the crystal-field splitting of the 3d energy level of Co ions in cobalt oxides is of the same order of magnitude as the Hund's rule intra-atomic exchange energy and 3d orbital bandwidth.9Physical effects such as magnetoresistance and magnetocaloric effects observed in manganites10,11 and cobaltites3,12–14 have been the subject of several investigations in the last few years. Double exchange (DE), phase separation (PS), Jahn–Teller distortion (JT), and Griffiths phase (GP) have been found to explain the aforementioned effects. Moreover, these compounds are also interesting for applications since they present low costs and longer usage times. This family of materials can be easily elaborated, and grain growth can be achieved to the desired size; moreover, they possess tunable Curie temperature and high chemical stability. La-based cobaltite is one of the perovskite oxides and it shows a wide variety of physical properties with relatively high TC values. Like manganese, iron, and copper, cobalt exhibits various possible oxidation states (Co2+, Co3+, and Co4+) and several types of coordinations (tetrahedral, pyramidal, and octahedral). Consequently, cobalt oxides offer a wide gamut of opportunities for the creation of many frameworks involving a mixed valence state of cobalt. Similar to manganites, the substitution of La3+ by Sr2+ in La1−xSrxCoO3 converts an adapted number of Co3+ to Co4+, introducing a predominantly ferromagnetic (FM) order due to the DE interactions between Co3+ and Co4+ ions.15 In addition, the substitution at the A-site of cobaltite oxides induces changes in the chemical internal pressure that locally affects the Co–O–Co networks and easily modifies the ST of cobalt ions due to the fact that crystal-field splitting is very sensitive to changes in the Co–O–Co angle and Co–O distance. Therefore, Co3+ adopts three possible STs, namely, LS, IS, and HS, whereas Co4+ usually exhibits only the LS.
It is believed that doped cobaltites are not a homogeneous ferromagnet. This inhomogeneity might affect the cooperative behavior of the Co sublattice, and therefore, the nature of FM–paramagnetic (PM) phase transition and the class of universality of this magnet.16 Therefore, the analysis of critical exponents (β, γ, and δ) of a magnetic system can yield valuable information about the magnetic phase transitions and can be classified into different universal classes, such as mean field, 3D Ising, and 3D Heisenberg, depending on the exponent values. Recently, the theory of critical phenomena justified the existence of a universal MCE behavior in materials exhibiting second-order magnetic phase transitions.17 Recent studies have revealed the impact of Bi3+ substitution on several properties in La-based manganites.18–20 It is believed that the BiMnO3 system is a special and promising compound, which exhibits multiferroic properties where phases like ferroelectric, FM, and ferroelastic coexist in this oxide. Earlier reports have suggested that Bi doping in manganite systems exhibit a high charge ordering temperature21 and that Bi doping in LaCaMnO3 exhibits excellent MCE properties with high efficiency.18,20 However, there are relatively few investigations that deal with the investigation of critical and MCE behaviors in Bi-doped La-cobaltite system. In order to understand both these behaviors in rare-Earth cobaltites keeping in mind the abovementioned factors, we have performed a comprehensive investigation of the structural, magnetic, critical, and MCE properties of a small amount (5%) of Bi-doped La0.55Bi0.05Sr0.4CoO3 samples. For a better understanding of the nature of magnetic transition and MCE properties of La0.55Bi0.05Sr0.4CoO3, we obtained the universal curves of magnetic entropy changes. Further, we have made an effort to estimate the spontaneous magnetization (MSP) from magnetic entropy changes and then compared the results with the standard extrapolation of Arrott plots. The present investigation is an attempt to fill this gap to a certain extent and to comprehensively explore the magnetic transition nature of a La0.55Bi0.05Sr0.4CoO3 system.
2. Experimental details
The ceramic with a nominal composition of La0.55Bi0.05Sr0.4CoO3 was synthesized by the solid-state reaction method. The precursors of La2O3 (Aldrich 99.9%; USA), Bi2O3 (Aldrich 99.9%; USA), SrCO3 (Aldrich 99.9%; USA), and Co3O4 (Aldrich 99.9%; USA) were mixed in an agate mortar with the desired proportions according to the La0.55Bi0.05Sr0.4CoO3 system. Then, the obtained powder was heated at 800 °C for 24 h. After cooling to the ambient temperature, the bulk was ground and pressed into pellets and then sintered at 900, 1000, 1100, and 1200 °C for 24 h with intermediate regrinding and repelling to ensure homogenization. Finally, the obtained disk-shaped samples were slowly cooled to room temperature in air. As the sample was exposed to air, it consequently became stoichiometric with respect to oxygen.22,23 The X-ray diffraction (XRD) pattern was recorded at room temperature on a PANalytical X'PERT Pro MPD diffractometer using θ/2θ Bragg–Brentano geometry with diffracted beam monochromatized CuKα radiation (λ = 1.5406 Å). The diffraction patterns were collected at steps of 0.017° over the angle range of 20–80°. Rietveld refinement was performed to determine the structural parameters by using the FullProf software. A vibrating-sample magnetometer developed at NEEL Institute was used to investigate the thermomagnetic properties of the sample. The temperature and field dependencies of the magnetization, M(T, μ0H), were recorded in a temperature range around the TC. To accurately extract the critical exponents of the sample, the corrected magnetic isotherms were measured in the range of 0–5 T and within a temperature interval of 2 K in the vicinity of TC.3. Scaling analysis
For continuous phase transition, near TC, the critical behavior for a second-order magnetic phase transition can be investigated via a series of critical exponents (β, γ, and δ). According to the scaling hypothesis, these exponents are expressed as follows:24,25
 | (1) |
 | (2) |
| M = D(μ0H)1/δ, ε = 0; T = TC | (3) |
The critical exponents (β, γ, and δ) should obey the scaling equations.24,25 A formulation was used in this work, which was based on the scaling equations of state. In the asymptotic critical region and according to the scaling equations, the magnetic equation can be expressed as follows:
| M(μ0H, ε) = εβf±(μ0H/εβ+γ) | (4) |
4. Results and discussions
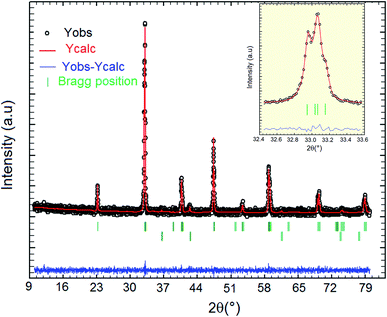
The XRD θ–2θ patterns measured at room temperature show that La0.55Bi0.05Sr0.4CoO3 can be refined in the perovskite structure with a rhombohedral structure with the R![[3 with combining macron]](https://www.rsc.org/images/entities/char_0033_0304.gif) c space group. This demonstrates that the substitution of La by 5% Bi does not induce the relevant effect on the crystal structure as compared to those in the undoped La0.5Sr0.4CoO3 compound prepared by the solid-state reaction method26 or sol–gel technique.14 The structural information of the prepared sample is obtained after fitting the XRD data using the Rietveld refinement technique by means of the FullProf software.27,28 During the initial stages of refinement, only the following parameters were changed: scale factor, background coefficients, unit-cell parameters, full-width parameters, sample displacement, and peak asymmetry. First, only the scale factor was refined; then, the remaining parameters were gradually included in the successive least-squares cycles. The background was fit using a third-order polynomial, and the observed peak shapes were approximated by using a pseudo-Voigt profile function, limited to ten full-widths on each side of the peak maximum. Fig. 1 shows the XRD diffractogram for the investigated sample, where the open circle dots represent the measured XRD reflections and the solid lines denote the Rietveld-refined results. Evidently, a marginal difference between the measured spectra and refined ones can be observed. The quality of refinement is evaluated through the goodness of the fit indicator χ2, which is equal to 1.98. From Fig. 1, it is clear that a small secondary phase can be observed, which can be attributed to the presence of the CoO impurity. This impurity is identified with the X'Pert HighScore Plus software. It is interesting to note that the most intense peak in the XRD spectra for La0.55Bi0.05Sr0.4CoO3 exhibits a double peak, representing the rhombohedral phase. The intense peak is shown in the inset of Fig. 1. The lattice parameters are found to be a = b = 5.415(7), c = 13.326(9) Å, and unit cell volume V = 338.51 Å3 for La0.55Bi0.05Sr0.4CoO3. For the undoped compound prepared by using the conventional solid-state reaction method, the lattice parameters can be determined as a = b = 5.436(3), c = 13.226(3) Å, and unit cell volume V = 338.49(1) Å3.26 It is clear that the lattice parameter “c” and unit cell volume marginally increase with the addition of 5% Bi content, while parameter “a” slightly decreases with the addition of 5% Bi content. This almost-perfect match can be explained considering the similar ionic radii of La3+ ions (1.16 Å, 8-coordinate) and Bi3+ ions (1.17 Å, 8-coordinate).29
c space group. This demonstrates that the substitution of La by 5% Bi does not induce the relevant effect on the crystal structure as compared to those in the undoped La0.5Sr0.4CoO3 compound prepared by the solid-state reaction method26 or sol–gel technique.14 The structural information of the prepared sample is obtained after fitting the XRD data using the Rietveld refinement technique by means of the FullProf software.27,28 During the initial stages of refinement, only the following parameters were changed: scale factor, background coefficients, unit-cell parameters, full-width parameters, sample displacement, and peak asymmetry. First, only the scale factor was refined; then, the remaining parameters were gradually included in the successive least-squares cycles. The background was fit using a third-order polynomial, and the observed peak shapes were approximated by using a pseudo-Voigt profile function, limited to ten full-widths on each side of the peak maximum. Fig. 1 shows the XRD diffractogram for the investigated sample, where the open circle dots represent the measured XRD reflections and the solid lines denote the Rietveld-refined results. Evidently, a marginal difference between the measured spectra and refined ones can be observed. The quality of refinement is evaluated through the goodness of the fit indicator χ2, which is equal to 1.98. From Fig. 1, it is clear that a small secondary phase can be observed, which can be attributed to the presence of the CoO impurity. This impurity is identified with the X'Pert HighScore Plus software. It is interesting to note that the most intense peak in the XRD spectra for La0.55Bi0.05Sr0.4CoO3 exhibits a double peak, representing the rhombohedral phase. The intense peak is shown in the inset of Fig. 1. The lattice parameters are found to be a = b = 5.415(7), c = 13.326(9) Å, and unit cell volume V = 338.51 Å3 for La0.55Bi0.05Sr0.4CoO3. For the undoped compound prepared by using the conventional solid-state reaction method, the lattice parameters can be determined as a = b = 5.436(3), c = 13.226(3) Å, and unit cell volume V = 338.49(1) Å3.26 It is clear that the lattice parameter “c” and unit cell volume marginally increase with the addition of 5% Bi content, while parameter “a” slightly decreases with the addition of 5% Bi content. This almost-perfect match can be explained considering the similar ionic radii of La3+ ions (1.16 Å, 8-coordinate) and Bi3+ ions (1.17 Å, 8-coordinate).29
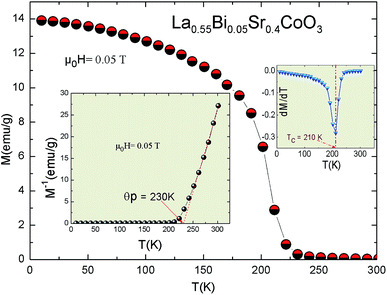
In order to understand the general magnetic behavior and to estimate TC, low-field magnetization vs. temperature (M(T)) is obtained in the field-cooled (FC) mode for the La0.55Bi0.05Sr0.4CoO3 sample. Fig. 2 shows the M(T) curve under an applied magnetic field of 0.05 T. This curve exhibits a sharp FM–PM phase transition, where TC, defined from the inflexion point of the dM/dT vs. T curve (inset, Fig. 2), is found to be 210 K. Here, TC is suppressed by 20 K as compared to undoped La0.5Sr0.4CoO3.14 It is noteworthy that even a higher value of TC = 237 K was found by T. A. Ho et al.26 for a sample prepared under different conditions. This TC suppression correlates with the competition between the DE interaction and superexchange interactions altered by the incorporation of Bi ion in the Co–O–Co networks. The observed M(T) curve reveals a strong variation in the magnetization around TC, which indicates that there is possibly a large magnetic entropy change around the magnetic transition.11,30 When showing the inverse of the magnetic susceptibility (1/χ–1/M) curve in the PM state (insets, Fig. 2), a linear behavior with temperature is observed above TC, which can be fitted with the Curie–Weiss law:
| χ = C/(T − θP) | (5) |
Fig. 3 shows the magnetization vs. applied magnetic field curve up to 8 T, M(μ0H), recorded at 10 K. This curve shows the typical FM nature of La0.55Bi0.05Sr0.4CoO3. The magnetization sharply increases with the applied magnetic field for μ0H = 1 T, but does not saturate even up to a field of 8 T. Such results confirm the existence of FM clusters, which, in cobaltites, are related to the presence of a spin disorder in the system, with indifferent STs of Co3+ and Co4+ ions.15 Further, the M(μ0H, T = 10 K) curve can be used for the evaluation of the characteristic magnetization values by means of the procedures described elsewhere.35 Namely, the saturation magnetization (Msat) calculated from the M vs. 1/H plot at 1/H → 0 (inset, Fig. 3). The obtained Msat values reach 1.75 μB/Co in the same order as the other perovskite systems.33,36,37 At low temperatures, the spontaneous magnetization Msp(exp) determined by the extrapolation of M(μ0H) from the high field to zero field is determined to be 1.37 μB/Co (inset, Fig. 3).
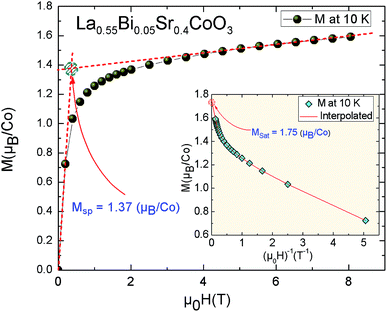 | ||
| Fig. 3 Variation in magnetization as a function of the applied magnetic field for the La0.55Bi0.05Sr0.4CoO3 sample at 10 K. Inset: determination of the saturation magnetization of the sample at 10 K. | ||
Fig. 4 shows the isothermal curves M(μ0H) over a wide range of temperatures and external fields up to 5 T. These curves are used to determine the changes in the magnetic entropy (−ΔSm) and critical exponents (β, γ, and δ). From the data, it is clear that the La0.55Bi0.05Sr0.4CoO3 sample shows FM behavior below TC and PM behavior considerably above TC. The M(μ0H) curves of the sample in the temperature range of 100–300 K are shown in the inset of Fig. 4. At lower temperatures, the M(μ0H) curve reveals that the magnetizations rise sharply in weak applied magnetic fields and then progressively increase with the μ0H value. However, a diminution of magnetization with increasing temperature is clearly observed. Further, it is clear that at TC, the investigated material transits from the FM state to the PM state. This transition is due to the magnetic disorder established as the temperature increases. In this case, the deflection of magnetic momentum occurs, and hence, the total magnetic moment of the entire system decreases and compound magnetization gets diminished. Therefore, once the temperature reaches TC, the thermal motion of the molecules of the material affects the ordered spin at the zero field and the PM behavior is observed instead of the FM behavior.
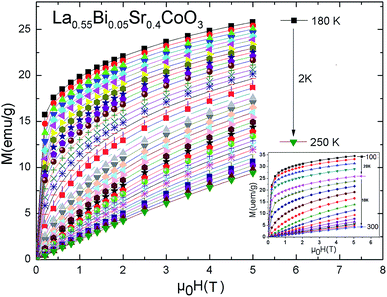 | ||
| Fig. 4 Isothermal magnetization curves at various temperatures for the La0.55Bi0.05Sr0.4CoO3 sample. | ||
In order to determine the type of magnetic phase transition in the vicinity of TC, Fig. 5a shows the Arrott curves (M2–μ0H/M) for the prepared La0.55Bi0.05Sr0.4CoO3 compound. In these curves, it is assumed that the critical exponents follow the mean-field theory (MFT), where β = 0.5 and γ = 1.38 Fig. 5a shows that in the low-field region, the nonlinear and curvature characters in M2–μ0H/M parts at T > TC and T < TC are driven toward two opposite directions. The latter phenomenon is essentially due to the misaligned magnetic domains, which reveal the FM–PM separation and indicate that the values of β = 0.5 and γ = 1 are inaccurate.
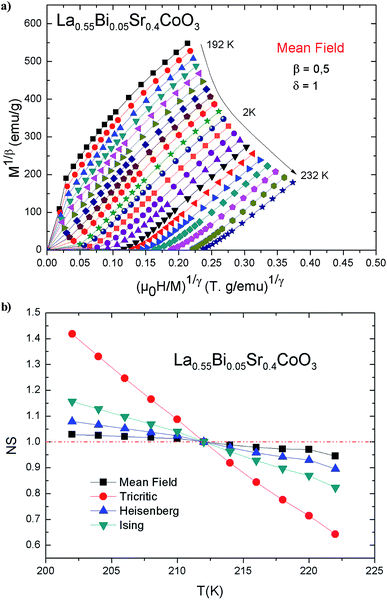 | ||
| Fig. 5 (a) M2 vs. μ0H/M isotherms for La0.55Bi0.05Sr0.4CoO3; (b) NS as a function of temperature for La0.55Bi0.05Sr0.4CoO3. | ||
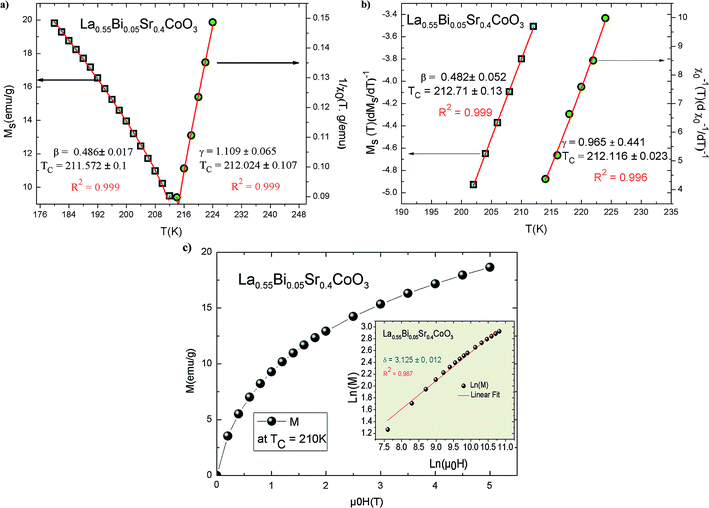
The characteristics of the magnetic phase transition in the La0.55Bi0.05Sr0.4CoO3 cobaltite can be determined by assessing the feature of the Arrott plots around TC. In our case, no inflection or negative slope is observed as a signature of the metamagnetic transition above TC, indicating the nature of the second-order phase transition (SOPT). This is in agreement with those observed in earlier studies.14,39,40 In general, for SOPT, its thermodynamic function can be expressed in the form of a power law with the aforementioned critical exponents, namely, β, γ, and δ. This transition obeys the following asymptotic relations. By using eqn (1) and (2), as well as the so-called Arrott–Noakes equation of state  (where a and b are constant parameters), we can obtain the values of β and γ; this approach is known as the modified Arrott plots (MAPs).41 Therefore, to determine the correct values of β and γ, MAPs should be used. In this context, it is possible to initially use the tri-critical mean-field model (β = 0.25 and γ = 1), 3D Ising model (β = 0.325 and γ = 1.24), 3D Heisenberg model (β = 0.365 and γ = 1.386), and mean-field model (β = 0.5 and γ = 1) to construct tentative Arrott plots and then the select the best one to be the initial Arrott plot for fitting the data. The so-called normalized slope (NS) defined as NS = S(T)/S(TC) at the critical point can be used for effecting further comparisons. Since the modified Arrott plots are a series of parallel lines, the NS of the most satisfactory model should be close to 1 (unity) regardless of temperature.42 As shown in Fig. 5b, the mean-field model provides an NS value closest to 1 in the temperature range under investigation. The latter model is the best one to determine the critical exponents as well as to describe the material. The temperature dependencies of χ0−1(T) and MSP(T) are shown in Fig. 6a; eqn (1) and (2) are used for fitting these data. These fits yielded the critical parameters as β = 0.486 ± 0.017 with TC = 211.572 ± 0.1 K and γ = 1.109 ± 0.065 with TC = 212.024 ± 0.107 K. These results are very close to the exponents of the mean-field model (β = 0.5 and γ = 1). It is evident that the obtained value of TC agrees well with that obtained from the M(T) curve.
Alternatively, in order to more accurately determine the β, γ, and TC parameters, we can use the Kouvel–Fisher (KF) method43,44 expressed as
 | (6) |
According to the above equations, the 1/β and 1/γ slopes are obtained by linear fitting and the value of TC is obtained from the intercepts on the temperature axis. The results of the best fits are shown in Fig. 6b, where (β = 0.482 ± 0.052, TC = 212.71 ± 0.13 K) and (γ = 0.965 ± 0.441, TC = 212.116 ± 0.023 K) for the La0.55Bi0.05Sr0.4CoO3 compound. It is worth noting that these new values are also in agreement with those obtained by the MAPs, which indicates that the estimated values are self-consistent and unambiguous.
The third critical exponent, namely, δ, is determined from the Widom scaling relation, i.e., δ = 1 + γ/β. Here, δ is calculated to be 3.281 ± 0.084 as obtained by the MAPs and 3.002 ± 0.493 as obtained by KF. Fig. 6c shows the magnetic isotherm M(μ0H; TC = 210 K) and the same plot on the Ln–Ln scale. The Ln(M) vs. Ln(μ0H) curve would be a straight line with a slope of 1/δ. The values of δ obtained through the MAP and KF methods are close to that obtained from the fitting of the isotherm at T = TC to eqn (3) (δ = 3.125 ± 0.012). Moreover, we note that these values of the critical exponents are in good agreement with those obtained from the mean-field model (β = 0.5, γ = 1, and δ = 3). When compared with La0.5Sr0.4CoO3, it is evident that the critical exponents of the La0.55Bi0.05Sr0.4CoO3 sample are different from those observed for the undoped sample. It has been reported that the critical exponents for La0.5Sr0.4CoO3 prepared by the sol–gel process are in good agreement with those predicted by the 3D Heisenberg model.14 However, many inconsistent results have been reported on La0.6Sr0.4CoO3 made by the solid–solid reaction. For example, T. A. Ho et al. found a complex scenario in the La0.5Sr0.4CoO3 sample.26 The β value of their sample was located between those expected from the mean-field model and 3D Heisenberg model, while the γ value is close to the value obtained from the 3D Ising model. Consequently, it is clear that the replacement of lanthanum by 5% Bi in the La0.6Sr0.4CoO3 sample induced a long-range magnetic order and modified the class of universality of the sample. In general, these characteristics are related to the differences in the sintering temperatures, preparation routes, particle sizes and shapes, and local geometric structures, resulting in various inhomogeneities and magnetocrystalline anisotropies. In our case, the obvious differences in the class of universalities of La0.55Bi0.05Sr0.4CoO3 and the parent compound are due to the influence of the replacement of La3+ ion (with zero magnetic moment) by Bi3+ ion (with nonzero magnetic moment). Therefore, the insertion of 5% Bi may contribute toward the magnetic interactions along with Co3+ and Co4+ ions and causes a difference in the critical behavior in the aforementioned samples.
In addition, the scaling equation stipulates that the M(μ0H, T) data in the critical region obeys the scaling relation expressed as45
| M(μ0H, ε) = εβf±(μ0H/εβ+γ) | (7) |
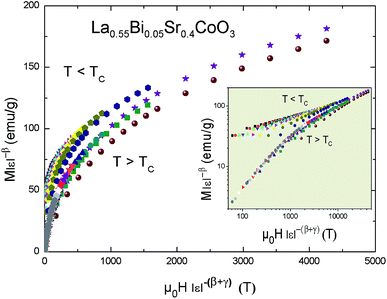 | ||
| Fig. 7 Scaling plot of M|ε|−β vs. μ0H|ε|−(β+γ) for the La0.55Bi0.05Sr0.4CoO3 compound at temperature T < TC and T > TC. | ||
The isothermal magnetic entropy change (ΔSm), which results from the spin ordering under the influence of a magnetic field, can be obtained from the M(μ0H) curves at various temperatures according to the classical thermodynamic theory based on Maxwell's relations by using the following expression:46
 | (8) |
In this work, the magnetization measurements are made under discrete magnetic fields and temperature intervals. Therefore, the magnetic entropy change can be approximately given by
 | (9) |
In this equation, Mi and Mi+1 are the experimental values of magnetization measured at temperatures Ti and Ti+1, respectively, under the applied magnetic field μ0Hi.
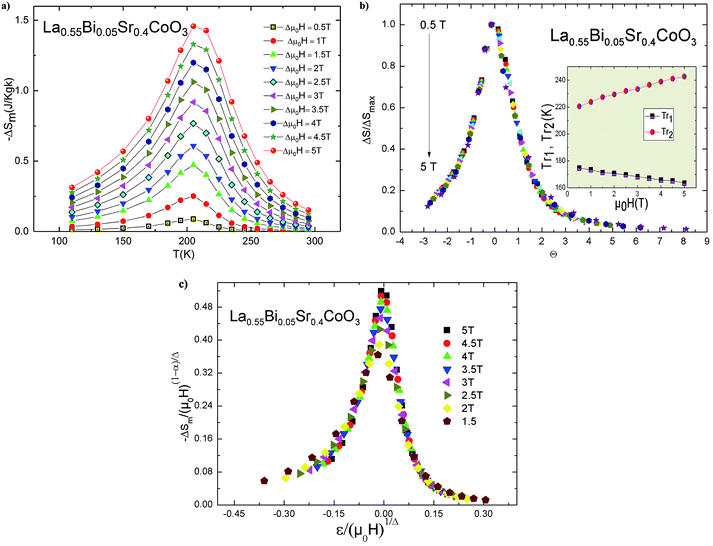
Fig. 8a shows the behavior of ΔSm for the La0.55Bi0.05Sr0.4CoO3 sample as a function of temperature. These curves exhibit peaks around TC. Immediately below and above TC, the −ΔSm value monotonically increases with an increasing magnetic field, which corresponds to a magnetic FM–PM transition. The dependence of the magnetic entropy changes on the value of (∂M/∂T)H has been clearly indicated in eqn (8). Therefore, a large magnetic entropy change usually occurs near TC, where the magnetization changes swiftly with a variation in temperature. Therefore, the negative sign of the magnetic entropy change confirms the FM character of our sample.47 The large values of −ΔSm for the La0.55Bi0.05Sr0.4CoO3 system are due to a second-order magnetic transition.48 The magnitude of ΔSm increases with an increasing strength of μ0H. The maximum value of ΔS decreases from 2.66 J kg−1 K−1 for the La0.6Sr0.4CoO3 sample prepared by the solid–solid reaction49 (2.10 J kg−1 K−1 for La0.6Sr0.4CoO3 made by the sol–gel method14) to 1.45 J kg−1 K−1 under an applied magnetic field of 5 T. This indicates that Bi substitution leads to a marginal decrease in the MCE properties with a reduced transition temperature. On the other hand, the obtained value of Bi-doped cobaltite is comparable to those obtained in other cobaltites,3,14,50,51 indicating that our sample could be used as a refrigerant material in magnetic cooling devices.
In order to determine the magnetic refrigeration efficiency, only the magnitude of the magnetic entropy is insufficient. The relative cooling power (RCP) is another decisive parameter that can be used to select materials for practical applications. RCP can be calculated by the following expression:
| RCP = |ΔSmaxm| × δTFWHM | (10) |
Moreover, we can use the obtained ΔSm curves to accurately distinguish between the order of the PM–FM phase transition according to a phenomenological universal curve of the field dependence of magnetic entropy change.53 Such a method has been successfully applied to FM perovskites, such as cobaltites14,54 and manganites.55–58 The universal curve could be plotted by means of the normalized entropy change (ΔSm/ΔSpeakm) and rescaling temperature (θ) as follows:53
 | (11) |
Based on the relationship between the critical exponents and the scaled equation of state59,60 defined as  the ΔSm value can be described in the form of the following scaling relationship:17
 | (12) |
Based on the MCE data, the dependence of the magnetic entropy change on the external magnetic field is analyzed. ΔSm can be expressed as a power law of the following form:
| ΔSmax(T, μ0H) = a(T)(μ0H)n(T,H) | (13) |
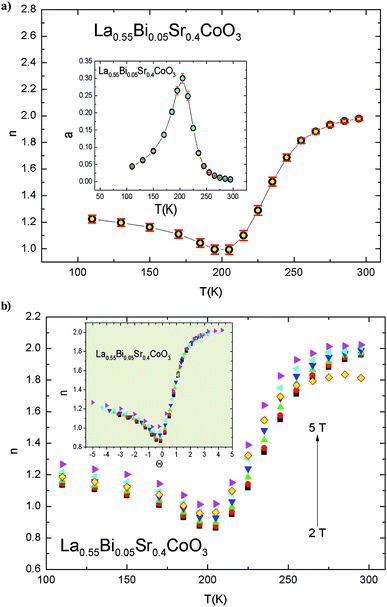
Basically, the MFT predicts that for materials with SOPT, the n(T) curve exhibits three regimes: well below TC (n = 1), well above TC (n = 2), and at TC (n = 2/3, which is related to the critical exponents of the transition).65 The exponent “n” depends on both temperature and field and can be locally estimated using the following formula:66
 | (14) |
From the curves of n(T, μ0H) shown in Fig. 9b for the La0.55Bi0.05Sr0.4CoO3 compound, it is evident that all the curves exhibit the minimum value of n at TC, which is different from the MFT value of n = 2/3. In addition, we observed that the n values are unstable under varying temperature T and field μ0H. The minima of the curves with changes in TC with the applied magnetic field range within 0.861–1.021. This behavior is related to the magnetic disorder and FM clusters in the vicinity of TC.14,67,68 A similar behavior has been previously reported in other perovskites.36,63,69,70 In order to verify the collapse or breakdown of n(T, μ0H) curves under the influence of different applied fields, we first arbitrarily selected the reference temperatures (Tr) as those that have n(Tr) = 1.5 (ref. 55) and constructed n(θ, μ0H) as a function of the rescaled temperature θ, which is, in turn, obtained as follows:
| θ = (T − TC)/(Tr − TC) | (15) |
From the inset of Fig. 9b, it is evident that all the n(θ, μ0H) values collapse onto a single universal curve, revealing a universal behavior in La0.55Bi0.05Sr0.4CoO3.
Using the MCE data, we calculated the specific heat (ΔCP) of La0.55Bi0.05Sr0.4CoO3 by means of the first derivative of ΔSm with respect to temperature:
 | (16) |
Fig. 10 shows the ΔCP value of the compound vs. temperature under different magnetic fields. Evidently, the ΔCP curves represent the alternative changes from negative to positive around TC with a negative value below TC and a positive value above TC, which can be attributed to the FM–PM transition. This behavior has also been observed in other FM systems.56,71–73 The sum of the two parts is the magnetic contribution to the total of ΔCP, which has an impact on the heating or cooling power of the magnetic cooling devices.74 ΔCP has the advantage of delivering values necessary to select a refrigerant material, which can simplify the design of a magnetic refrigerator.
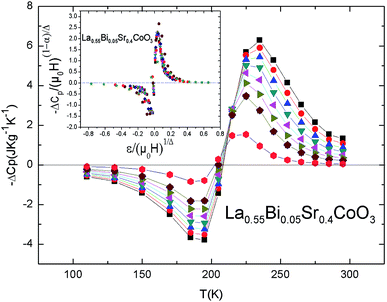 | ||
| Fig. 10 ΔCp for the La0.55Bi0.05Sr0.4CoO3 system. Inset: normalized heat capacity change as a function of the rescaled temperature for all the magnetic fields. | ||
The ΔCP values induced by the applied magnetic fields can be plotted onto a universal curve by means of the critical exponents. The scaling method is a result of the scaling hypothesis for FM materials near their magnetic transitions. The scaling of ΔCP changes are plotted in terms of  as shown in the inset of Fig. 10. The worthwhile overlap of the data points obviously suggests that the obtained exponents (β and γ) and TC for the La0.55Bi0.05Sr0.4CoO3 sample are in agreement with the scaling hypothesis at various magnetic fields.
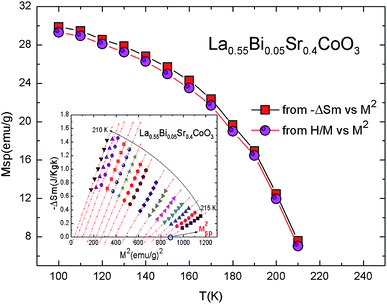
Moreover, the obtained magnetic entropy change is used to deduce the spontaneous magnetization in the La0.55Bi0.05Sr0.4CoO3 sample. According to the MFT and relationship between the magnetic entropy (S) and magnetization (M), S(σ) can be expressed as follows:75,76
 | (17) |
 | (18) |
Furthermore, it should be noted that the compound exhibits spontaneous magnetization below TC (FM state), and consequently, the σ = 0 state is certainly not obtained. By considering only the first term of eqn (18), ΔSm may be expressed as
 | (19) |
The latter equation indicates that ΔSm vs. M2 plots show a linear variation with a constant slope in the FM region. At different temperatures, all the curves exhibit a horizontal drift from the origin corresponding to a value of Mspon2(T). For the PM region, the ΔSm vs. M2 plots start at a null M value.77 Fig. 11 shows the Msp(T) data obtained from the ΔSm vs. M2 curves by the intersection of the linearly extrapolated curve with the M2 axis (inset, Fig. 11). The linear behavior of −ΔSm vs. M2 confirmed the validity of the linear expansion of eqn (19). In the same figure, we show a comparison between the estimated Msp(T) values obtained from the isothermal (−ΔSm) vs. M2 plots and those obtained from the Arrott plots (μ0H vs. M2). The worthwhile agreement between the aforementioned methods confirms the validity of this process in order to determine the Msp value using a mean-field analysis of ΔSm in the La0.55Bi0.05Sr0.4CoO3 system. The magnetic behavior of our sample is effectively described by the classical MFT.
Finally, the investigation of the scaling hypotheses of the thermomagnetic properties of the La0.55Bi0.05Sr0.4CoO3 sample offer the opportunity of using the universal curve in the investigations of novel FM materials on various applied functionalities. Such methods present a simple screening procedure of the performance of FM compounds, simple way to extrapolate results to magnetic fields or temperatures not available in the laboratories, remake the impact of non-saturating conditions, reduce experimental noise, or eliminate the effects of minority magnetic phases.
5. Conclusion
In summary, we conducted an in-depth investigation on magnetic, critical behavior, and MCE effect on La0.55Bi0.05Sr0.4CoO3 cobaltite synthesized via the solid-state reaction. The XRD analysis shows that the sample exhibits a rhombohedral structure with the R![[3 with combining macron]](https://www.rsc.org/images/entities/char_0033_0304.gif) c space group. The magnetic properties reveal that our sample undergoes a FM–PM second-order magnetic transition, which can be confirmed from the Arrott curves and universal curves of magnetic entropy changes. The critical behavior of the La0.55Bi0.05Sr0.4CoO3 cobaltite is studied by means of various techniques and validated by using the scaling theory and Widom scaling relation. The obtained critical exponents are close to the theoretical prediction of the mean-field model values, which implies that long-range interactions dominate the critical behavior in La0.55Bi0.05Sr0.4CoO3. Moreover, the experimental magnetic entropy changes, specific heat capacity changes, and local exponents n obtained for several magnetic fields collapse onto a universal curve, confirming the universal behavior of the MCE properties in this oxide. The estimated spontaneous magnetization value extracted through the analysis of the magnetic entropy change (−ΔSm vs. M2) is consistent with that extracted through the classical extrapolation of the Arrott plots (μ0H/M vs. M2). Consequently, the magnetic entropy change is a valid approach to determine the spontaneous magnetization of the La0.55Bi0.05Sr0.4CoO3 compound.
c space group. The magnetic properties reveal that our sample undergoes a FM–PM second-order magnetic transition, which can be confirmed from the Arrott curves and universal curves of magnetic entropy changes. The critical behavior of the La0.55Bi0.05Sr0.4CoO3 cobaltite is studied by means of various techniques and validated by using the scaling theory and Widom scaling relation. The obtained critical exponents are close to the theoretical prediction of the mean-field model values, which implies that long-range interactions dominate the critical behavior in La0.55Bi0.05Sr0.4CoO3. Moreover, the experimental magnetic entropy changes, specific heat capacity changes, and local exponents n obtained for several magnetic fields collapse onto a universal curve, confirming the universal behavior of the MCE properties in this oxide. The estimated spontaneous magnetization value extracted through the analysis of the magnetic entropy change (−ΔSm vs. M2) is consistent with that extracted through the classical extrapolation of the Arrott plots (μ0H/M vs. M2). Consequently, the magnetic entropy change is a valid approach to determine the spontaneous magnetization of the La0.55Bi0.05Sr0.4CoO3 compound.
Conflicts of interest
There are no conflicts to declare.Acknowledgements
This study was supported by the Tunisian Ministry of Higher Education and Scientific Research and the Neel Institute.References
- E. Vera, B. Alcántar-Vázquez, Y. Duan and H. Pfeiffer, RSC Adv., 2016, 6(3), 2162–2170 RSC.
- W. He, G. Zhang, X. Zhang, J. Ji, G. Li and X. Zhao, Appl. Energy, 2015, 143, 1–25 CrossRef.
- I. G. Deac and A. Vladescu, J. Magn. Magn. Mater., 2014, 365, 1–7 CrossRef CAS.
- V. G. Bhide, D. S. Rajoria, G. R. Rao and C. N. R. Rao, Phys. Rev. B: Condens. Matter Mater. Phys., 1972, 6, 1021–1032 CrossRef CAS.
- P. M. Raccah and J. B. Goodenough, Phys. Rev., 1967, 155, 932–943 CrossRef CAS.
- N. Menyuk, K. Dwight and P. M. Raccah, J. Phys. Chem. Solids, 1967, 28, 549–556 CrossRef CAS.
- K. Asai, O. Yokokura, M. Suzuki, T. Naka, T. Matsumoto, H. Takahashi, N. Môri and K. Kohn, J. Phys. Soc. Jpn., 1997, 66, 967–970 CrossRef CAS.
- J. Mira, J. Rivas, M. Vázquez, J. M. García-Beneytez, J. Arcas, R. D. Sánchez and M. A. Señarís-Rodríguez, Phys. Rev. B: Condens. Matter Mater. Phys., 1999, 59, 123–126 CrossRef CAS.
- X. G. Luo, H. Li, X. H. Chen, Y. M. Xiong, G. Wu, G. Y. Wang, C. H. Wang, W. J. Miao and X. Li, Chem. Mater., 2006, 18, 1029–1035 CrossRef CAS.
- R. von Helmolt, J. Wecker, B. Holzapfel, L. Schultz and K. Samwer, Phys. Rev. Lett., 1993, 71, 2331–2333 CrossRef CAS PubMed.
- M. H. Phan and S. C. Yu, J. Magn. Magn. Mater., 2007, 308, 325–340 CrossRef CAS.
- G. Briceño, H. Chang, X. Sun, P. G. Schultz and X.-D. Xiang, Science, 1995, 270, 273–275 CrossRef.
- V. Golovanov, L. Mihaly and A. R. Moodenbaugh, Phys. Rev. B: Condens. Matter Mater. Phys., 1996, 53, 8207–8210 CrossRef CAS PubMed.
- F. Saadaoui, R. M'nassri, H. Omrani, M. Koubaa, N. C. Boudjada and A. Cheikhrouhou, RSC Adv., 2016, 6(56), 50968–50977 RSC.
- J. Wu and C. Leighton, Phys. Rev. B: Condens. Matter Mater. Phys., 2003, 67, 174408 CrossRef.
- N. Khan, A. Midya, K. Mydeen, P. Mandal, A. Loid and D. Prabhakaran, Phys. Rev. B: Condens. Matter Mater. Phys., 2010, 82, 064422 CrossRef.
- V. Franco, J. S. Blázquez and A. Conde, J. Appl. Phys., 2008, 103, 07B316 CrossRef.
- H. Gencer, S. Atalay, H. I. Adiguzel and V. S. Kolat, Phys. B, 2005, 357, 326–333 CrossRef CAS.
- R. Li, Z. Qu, J. Fang, X. Yu, L. Zhang and Y. Zhang, Solid State Commun., 2010, 150, 389–392 CrossRef CAS.
- S. Atalay, V. S. Kolat, H. Gencer and H. I. Adiguzel, J. Magn. Magn. Mater., 2006, 305, 452–456 CrossRef CAS.
- S. Zemni, M. Baazaoui, J. Dhahri, H. Vincent and M. Oumezzine, Mater. Lett., 2009, 63, 489–491 CrossRef CAS.
- J. H. Kuo, H. U. Anderson and D. M. Sparlin, J. Solid State Chem., 1989, 83(1), 52–60 CrossRef CAS.
- H. Ben Khlifa, R. M'nassri, W. Cheikhrouhou-Koubaa, E. K. Hlil and A. Cheikhrouhou, Ceram. Int., 2017, 43(2), 1853–1861 CrossRef CAS.
- A. K. Pramanik and A. Banerjee, Phys. Rev. B: Condens. Matter Mater. Phys., 2009, 79, 214426 CrossRef.
- M. E. Fisher, Rep. Prog. Phys., 1967, 30, 615–730 CrossRef CAS.
- T. A. Ho, P. T. Long, N. V. Quang, S. L. Cho and S. C. Yu, J. Magn. Magn. Mater., 2019, 477, 396–403 CrossRef CAS.
- H. M. Rietveld, J. Appl. Crystallogr., 1969, 2, 65–71 CrossRef CAS.
- T. Roisnel and J. Rodriguez-Carvajal, Computer Program FULLPROF, LLB-LCSIM, May 2003 Search PubMed.
- R. D. Shannon and C. T. Prewitt, Acta Crystallogr., Sect. B: Struct. Crystallogr. Cryst. Chem., 1969, 25, 925–946 CrossRef CAS.
- R. M'nassri, J. Supercond. Novel Magn., 2014, 27, 1787–1794 CrossRef.
- R. P. Borges, F. Ott, R. M. Thomas, V. Skumryev, J. M. D. Coey, J. I. Arnaudas and L. Ranno, Phys. Rev. B: Condens. Matter Mater. Phys., 1999, 60, 12847–12851 CrossRef CAS.
- S. Choura-Maatar, R. M'nassri, W. Cheikhrouhou-Koubaa, M. Koubaa, A. Cheikhrouhou and E. K. Hlil, RSC Adv., 2017, 7(79), 50347–50357 RSC.
- R. M'nassri, N. C. Boudjada and A. Cheikhrouhou, J. Alloys Compd., 2015, 626, 20–28 CrossRef.
- S. Mahjoub, M. Baazaoui, R. M'nassri, E. K. Hlil and M. Oumezzin, J. Alloys Compd., 2016, 680, 381–387 CrossRef CAS.
- I. Panneer Muthuselvam and R. N. Bhowmik, J. Alloys Compd., 2012, 511, 22–30 CrossRef.
- A. Selmi, R. M'nassri, W. Cheikhrouhou-Koubaa, N. Chniba Boudjada and A. Cheikhrouhou, J. Alloys Compd., 2015, 619, 627–633 CrossRef CAS.
- S. K. Srivastava and S. Ravi, J. Magn. Magn. Mater., 2009, 321, 4072–4080 CrossRef CAS.
- A. Arrott, Phys. Rev., 1957, 108, 1394–1396 CrossRef CAS.
- S. Mukherjee, P. Raychaudhuri and A. K. Nigam, Phys. Rev. B: Condens. Matter Mater. Phys., 2000, 61, 8651–8653 CrossRef CAS.
- N. Menyuk, P. M. Raccah and K. Dwight, Phys. Rev., 1968, 166, 510–513 CrossRef CAS.
- A. Arrot and J. E. Noakes, Phys. Rev. Lett., 1967, 19, 786–789 CrossRef.
- J. Fan, L. Ling, B. Hong, L. Zhang, L. Pi and Y. Zhang, Phys. Rev. B: Condens. Matter Mater. Phys., 2010, 81, 144426 CrossRef.
- J. S. Kouvel and M. E. Fisher, Phys. Rev., 1964, 136, A1626–A1632 CrossRef.
- M. E. Fisher, S. Ma and B. G. Nickel, Phys. Rev. Lett., 1972, 29, 917–920 CrossRef.
- H. E. Stanley, Introduction to Phase Transitions and Critical Phenomena, Oxford University Press, New York, 1971 Search PubMed.
- V. K. Pecharsky and K. A. Gschneidner Jr., J. Magn. Magn. Mater., 1999, 200, 44–56 CrossRef CAS.
- M. H. Phan, N. A. Frey, M. Angst, J. de Groot, B. C. Sales, D. G. Mandrus and H. Srikanth, Solid State Commun., 2010, 150, 341–345 CrossRef CAS.
- J. Shen, B. Gao, Q.-Y. Dong, Y.-X. Li, F.-X. Hu, J.-R. Sun and B.-G. Shen, J. Phys. D: Appl. Phys., 2008, 41, 245005 CrossRef.
- P. T. Long, T. V. Manh, T. A. Ho, V. Dongquoc, P. Zhang and S. C. Yu, Ceram. Int., 2018, 44, 15542–15549 CrossRef CAS.
- R. Tetean, I. G. Deac, E. Burzo and A. Bezergheanu, J. Magn. Magn. Mater., 2008, 320, e179–e182 CrossRef CAS.
- T. A. Ho, T. D. Thanh, T. O. Ho, Q. T. Tran, T. L. Phan and S. C. Yu, IEEE Trans. Magn., 2014, 50(11), 1–4 Search PubMed.
- S. Naas, N. Abassi and C. Boudaya, J. Mater. Sci.: Mater. Electron., 2017, 28, 17985–17992 CrossRef CAS.
- C. M. Bonilla, J. Herrero-Albillos, F. Bartolomé, L. M. García, M. Parra-Borderías and V. Franco, Phys. Rev. B: Condens. Matter Mater. Phys., 2010, 81, 224424 CrossRef.
- F. Saadaoui, R. M'nassri, A. Mleiki, M. Koubaa, N. ChnibaBoudjada and A. Cheikhrouhou, J. Mater. Sci.: Mater. Electron., 2017, 28, 15500–15511 CrossRef CAS.
- R. M'nassri, A. Selmi, N. C. Boudjada and A. Cheikhrouhou, J. Therm. Anal. Calorim., 2017, 129, 53–64 CrossRef.
- R. M'nassri and A. Cheikhrouhou, J. Korean Phys. Soc., 2014, 64, 879–885 CrossRef.
- R. M'nassri and A. Cheikhrouhou, J. Supercond. Novel Magn., 2014, 27, 1463–1468 CrossRef.
- M. Mansouri, H. Omrani, R. M'nassri, W. Cheikhrouhou-Koubaa and A. Cheikhrouhou, J. Mater. Sci.: Mater. Electron., 2018, 29, 14239–14247 CrossRef CAS.
- B. Widom, J. Chem. Phys., 1965, 43, 3898–3905 CrossRef.
- R. B. Griffiths, Phys. Rev., 1967, 158, 176–187 CrossRef.
- A. Hankey and H. E. Stanley, Phys. Rev. B: Condens. Matter Mater. Phys., 1972, 6, 3515–3542 CrossRef.
- S. Tarhouni, R. M'nassri, A. Mleiki, W. Cheikhrouhou-Koubaa, A. Cheikhrouhou and E. K. Hlil, RSC Adv., 2018, 8, 18294–18307 RSC.
- R. M'nassri, N. Chniba Boudjada and A. Cheikhrouhou, J. Alloys Compd., 2015, 640, 183–192 CrossRef.
- A. Rostamnejadi, M. Venkatesan, P. Kameli, H. Salamati and J. M. D. Coey, J. Magn. Magn. Mater., 2011, 323, 2214–2218 CrossRef CAS.
- H. Oesterreicher and F. T. Parker, J. Appl. Phys., 1984, 55, 4334–4338 CrossRef CAS.
- V. Franco, J. S. Blazquez, B. Ingale and A. Conde, Annu. Rev. Mater. Res., 2012, 42, 305–342 CrossRef CAS.
- T.-L. Phan, T. A. Ho, T. V. Manh, N. T. Dang, C. U. Jung, B. W. Lee and T. D. Thanh, J. Appl. Phys., 2015, 118, 143902 CrossRef.
- V. Franco, J. S. Blázquez and A. Conde, Appl. Phys. Lett., 2006, 100, 064307 Search PubMed.
- T.-L. Phan, P. Zhang, T. D. Thanh and S. C. Yu, J. Appl. Phys., 2014, 115, 17A912 CrossRef.
- A. Sakka, R. M'nassri, N. ChnibaBoudjada, M. Ommezzine and A. Cheikhrouhou, Appl. Phys. A: Mater. Sci. Process., 2016, 122, 603 CrossRef.
- M. Foldeaki, R. Chahine and T. K. Bose, J. Appl. Phys., 1995, 77, 3528–3537 CrossRef.
- H. Yang, Y. H. Zhu, T. Xian and J. L. Jiang, J. Alloys Compd., 2013, 555, 150–155 CrossRef CAS.
- R. M'nassri and A. Cheikhrouhou, J. Supercond. Novel Magn., 2014, 27(4), 1059–1064 CrossRef.
- X. X. Zhang, G. H. Wen, F. W. Wang, W. H. Wang, C. H. Yu and G. H. Wu, Appl. Phys. Lett., 2000, 77, 3072–3074 CrossRef CAS.
- A. M. Tishin and Y. I. Spichin, The Magnetocaloric Effect and its Applications, IOP Publishing, London, 2nd edn, 2003 Search PubMed.
- J. S. Amaral, N. J. O. Silva and V. S. Amaral, J. Magn. Magn. Mater., 2010, 322, 1569–1571 CrossRef CAS.
- J. C. Debnath, A. M. Strydom, P. Shamba, J. L. Wang and S. X. Dou, J. Appl. Phys., 2013, 113, 233903 CrossRef.
| This journal is © The Royal Society of Chemistry 2019 |

