 Open Access Article
Simple, rapid, sensitive, selective and label-free lincomycin detection by using HAuCl4 and NaOH†
Yumin Leng *a,
Fang Huc,
Chunhua Maa,
Chenxi Dua,
Linfeng Maa,
Jiao Xua,
Qiyuan Lina,
Zhipei Sang*b and
Zhiwen Lu*a
aCollege of Physics and Electronic Engineering, Nanyang Normal University, Nanyang 473061, China. E-mail: yumin_leng@126.com; lzw@nynu.edu.cn
bCollege of Chemistry and Pharmaceutical Engineering, Nanyang Normal University, Nanyang 473061, China. E-mail: sangzhipei@126.com
cFaculty of Materials Science and Chemical Engineering, Ningbo University, Ningbo 315211, China
First published on 9th September 2019
Abstract
A simple, rapid, sensitive, selective and label-free method is presented for the colorimetric determination of lincomycin (Lin) by using HAuCl4 and NaOH. Upon the addition of Lin, the mixture of HAuCl4 and NaOH shows a color change from colorless to blue (or dark blue). The limit of colorimetric detection is as low as 1 μM, observed both in Milli-Q water and real samples. The selectivity of Lin detection is excellent compared with 9 other common antibiotics. On the basis of the “three-color” principle of Thomas Young, we extracted the red, green and blue (RGB) alterations of the sensor in the absence and presence of different concentrations of Lin. The color changes are quantitatively illustrated by the total Euclidean distances (EDs = [ΔR2 + ΔG2 + ΔB2]1/2). The good linear relationship between the EDs and Lin concentration is used for the quantitative assay of Lin. The developed method demonstrates great potential for the detection of Lin in environmental water and milk.
1. Introduction
The pattern for raising herds of food animals appeared in the 1960s, with routine mass use of veterinary drugs (e.g. antibiotics) to prevent animal diseases and to improve growth.1 The total antibiotic usage in China in 2013 was reported to be ∼162![[thin space (1/6-em)]](https://www.rsc.org/images/entities/char_2009.gif) 000 tons, and this number is further increasing with the development of industry and the increase of the population.2,3 Lincomycin (Lin) is an antibiotic against bacteria, and is widely used in the feed and animal production industry.4 Some studies have suggested that a high concentration of Lin in animal-derived food can cause health problems.5 Hence, it is crucial to detect and monitor Lin residues in food products as well as in the environment.
000 tons, and this number is further increasing with the development of industry and the increase of the population.2,3 Lincomycin (Lin) is an antibiotic against bacteria, and is widely used in the feed and animal production industry.4 Some studies have suggested that a high concentration of Lin in animal-derived food can cause health problems.5 Hence, it is crucial to detect and monitor Lin residues in food products as well as in the environment.
Various methods have been described in the literature for the analysis of Lin, such as microbiological assay,6 high-performance liquid chromatography (HPLC),7 liquid chromatography-mass spectrometry (LC-MS),8 thin layer chromatography (TLC),9 electrochemiluminescence (ECL),10 electrochemical method,11,12 capillary electrophoresis (CE),13 atomic absorption spectrometry14 and spectrophotometry (SP).15 The microbiological assays were originally used, but they need long-term culture and are non-specific. HPLC is efficient and fast, but its sensitivity is limited by the UV absorption of Lin. LC-MS methods are quite sensitive, but the expensive equipment needs to be handled by trained staff, limiting the application for small farms or in-field tests. TLC methods have strong separation capability and only need small amount of sample, but suffer from poor reproducibility. CE and SP methods are not sensitive enough for the detection of trace Lin. Hence, it is of significance to develop a simple, sensitive, selective and cost-effective method for detecting Lin.
In the present, we described a method that we have developed for the colorimetric determination of Lin by using HAuCl4 and NaOH. The method is based on the different coordination interaction of Au and ligands. With the increase of Lin concentrations, the color of HAuCl4 and NaOH mixture gradually changes from colorless to wathet blue, then blue and finally dark blue. The limit of detection (LOD) by the naked eyes is as low as 1 μM observed in Milli-Q water and real sample. The sensor shows low response to 9 other common antibiotics comparing with Lin. The applicability of our detection system is also verified by analysis of Lin in real sample. The method is characterized by rather simple, high speed, reproducibility, selective and sensitivity.
2. Experimental section
2.1. Materials and instruments
Chloroauric acid tetrahydrate (HAuCl4·4 H2O) and NaOH were obtained from Sinopharm Chemical Reagent Co., Ltd (Beijing, China). Amoxicillin (Am), erythromycin (Er), spiramycin (Sp), gentamycin sulfate (Ge), chlortetracycline hydrochloride (Ch), ceftriaxone sodium (Ce), enrofloxacin (En), ciprofloxacin (Ci), sulfadiazine (Su) and lincomycin hydrochloride (Lin) were purchased from Aladdin-Reagent Co. Ltd (Shanghai, China). 96-well plates (Corning 3632) were obtained from Genetimes Technology. All chemicals were used as received without further purification. Millipore-Q water was used throughout the experiment.To eliminate the influence of environmental light, the color images were taken with a scanner in 96-well polystyrene plates.
2.2. Preparation of sensor
The HAuCl4 (1 mL, 1 mM) and NaOH (1 mL, 1 mM) were mixed to produce the colorless solution. The colorless solution (sensor) was harvested and stored at 4 °C for further use.2.3. Colorimetric detection of Lin
The sensing solution in the absence and presence of different concentrations of Lin were loaded into a 96-well polystyrene plate, and the images were recorded using a scanner. Their color alterations (ΔRGB) were obtained by using the Photoshop software. Four replicates were tested for the different concentrations of Lin. The color changes were quantitatively illustrated by the total Euclidean distances (EDs = [ΔR2 + ΔG2 + ΔB2]1/2).
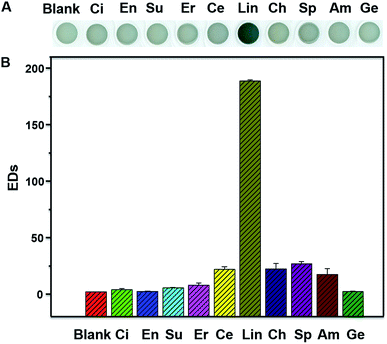
The sensor solution in the absence and presence of antibiotics (20 μM) were loaded into a 96-well polystyrene plate, and the images were recorded by using a scanner. Their color alterations (ΔRGB) were obtained by using the Photoshop software. Four replicates were tested for the different concentrations of Lin. The color changes were quantitatively illustrated by the total Euclidean distances (EDs = [ΔR2 + ΔG2 + ΔB2]1/2).
Due to the complex elements contained in milk, it was usually selected as the test real sample for antibiotics detection.16,17 The selected milk is made up of carbohydrates, proteins, fats, citric acid, Na+, etc. According to the reported method,16 direct 30-fold dilution was performed. The spiked samples were obtained by adding Lin with different concentration to the diluted milk. The detection procedure of Lin in the real sample is similar with that in pure water.
3. Results and discussion
3.1. Colorimetric detection of Lin
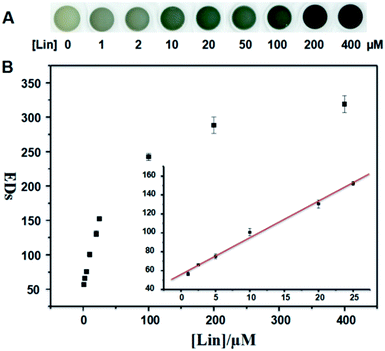
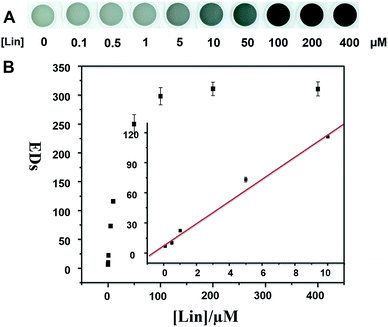
The sensing solution was applied in detection of Lin in real sample (e.g. milk). The spiked samples were obtained by adding concentrations of Lin to the diluted milk. The corresponding photo images are shown in Fig. 4A. The color of the sensing solution changes from colorless to wathet blue, blue and dark blue with the increase of Lin concentrations (see Fig. 4A). Although the complex elements in the spiked samples slightly affect the color changes (compared with Fig. 1, panel A), the limit of colorimetric detection is up to 1 μM. The EDs as a function of Lin concentration is shown in Fig. 4B. The linear relationships can be inferred, manifesting the dynamic ranges from 0 to 10 μM and the LOD of 0.94 μM (see Table S1 and the calculation method in ESI†). Therefore, the proposed sensor has a great promise to be applied as a powerful tool for the detection of Lin in environmental water and food (e.g. milk).
4. Conclusions
In summary, we have developed a simple, rapid, sensitive, selective and label-free method for the colorimetric detection of Lin. In the presence of increasing concentrations of Lin, the color of HAuCl4 and NaOH mixture gradually changes from initially colorless to wathet blue, then blue and finally dark blue. This different coordination interaction may change the color of AuCl4− solution from light yellow to colorless and blue. The selectivity of the Lin detection is excellent comparing with other 9 common antibiotics. The limits of colorimetric detection have been determined to be 1 μM in Milli-Q water and real sample. The good linear relationship between EDs and Lin concentration is used for the quantitative assay of Lin. The LODs have been calculated to be 0.97 μM (Milli-Q water) and 0.94 μM (real sample), respectively. These results indicate that the developed detection system is applicable for rapid colorimetric detection of Lin in environmental water and food (e.g. milk).Conflicts of interest
There are no conflicts to declare.Acknowledgements
This work is supported by the Natural Science Foundation of China (21607083), Natural Science Foundation of Henan (162300410206), Technicians Troop Construction Projects of Henan Province (No. C20150029) and Scientific and Technological Project of Henan Province (162102310484). F. H. would also like to thank the financial support from Natural Science Foundation of China (21602122).References
- R. M. Netting, Smallholders, householders: farm families and the ecology of intensive, sustainable agriculture, Stanford University Press, Stanford, CA, USA, 1993, pp. 265–270 Search PubMed.
- Q. Q. Zhang, G. G. Ying, C. G. Pan, Y. S. Liu and J. L. Zhao, Comprehensive evaluation of antibiotics emission and fate in the river basins of China: source analysis, multimedia modeling, and linkage to bacterial resistance, Environ. Sci. Technol., 2015, 49(11), 6772–6782 CrossRef CAS PubMed.
- Y. Zhu, Y. Zhao, B. Li, C. Huang, S. Zhang, S. Yu, Y. Chen, T. Zhang, M. R. Gillings and J. Su, Continental-scale pollution of estuaries with antibiotic resistance genes, Nat. Microbiol., 2017, 2, 16270 CrossRef CAS PubMed.
- L. Rocco, C. Peluso and V. Stingo, Micronucleus test and comet assay for the evaluation of zebrafish genomic damage induced by erythromycin and lincomycin, Environ. Toxicol., 2012, 27, 598–604 CrossRef CAS PubMed.
- G. S. Sreeshitha, D. Venkatachalam and V. K. Dumka, Pharmacokinetics of lincomycin following single intravenous administration in buffalo calves, Trop. Anim. Health Prod., 2014, 46, 1099–1102 CrossRef PubMed.
- A. R. Barbiers and A. W. Neff, Screening and confirmatory methods for determining lincomycin residues in animal tissues, J.–Assoc. Off. Anal. Chem., 1976, 59, 849–854 CAS.
- K. Stypulkowska, A. Blazewicz, A. Brudzikowska, M. W. Grzeskiewicz, K. Sarna and Z. Fijalek, Development of high performance liquid chromatography methods with charged aerosol detection for the determination of lincomycin, spectinomycin and its impurities in pharmaceutical products, J. Pharm. Biomed. Anal., 2015, 112, 8–14 CrossRef CAS PubMed.
- J. B. Wittenberg, K. A. Simon and J. W. Wong, Targeted multiresidue analysis of veterinary drugs in milk-based powders using liquid chromatography-tandem mass spectrometry (LC-MS/MS), J. Agric. Food Chem., 2017, 65, 7288–7293 CrossRef CAS PubMed.
- K. Jam, K. Anna, S. Malgorzata, K. Anna and R. Wloodzimierz, Identification and determination of oxytetracycline, iamulin, lincomycin, spectinomycin in veterinary preparation by thin-layer chromatography/densitometry, J. AOAC Int., 2000, 83, 1502–1506 Search PubMed.
- X. Zhao, T. You, H. Qiu, J. Yan, X. Yang and E. Wang, Electrochemiluminescence detection with integrated indium tin oxide electrode on electrophoretic microchip for direct bioanalysis of lincomycin in the urine, J. Chromatogr. B: Anal. Technol. Biomed. Life Sci., 2004, 810, 137–142 CrossRef CAS.
- S. Li, C. Liu, G. Yin, Q. Zhang, J. Luo and N. Wu, Aptamer-molecularly imprinted sensor base on electrogenerated chemiluminescence energy transfer for detection of lincomycin, Biosens. Bioelectron., 2017, 91, 687–691 CrossRef CAS PubMed.
- P. Gai, C. Gu, T. Hou and F. Li, Ultrasensitive self-powered aptasensor based on enzyme biofuel cell and DNA bioconjugate: a facile and powerful tool for antibiotic residue detection, Anal. Chem., 2017, 89, 2163–2169 CrossRef CAS PubMed.
- D. Moreno-González, F. J. Lara, N. Jurgovská, L. Gámiz-Gracia and A. M. García-Campaña, Determination of aminoglycosides in honey by capillary electrophoresis tandem mass spectrometry and extraction with molecularly imprinted polymers, Anal. Chim. Acta, 2015, 891, 321–328 CrossRef PubMed.
- M. A. EI Ries, Spectrophotometric and indirect determination of lincomycin by atomic absorption spectroscopy, Anal. Lett., 1994, 27, 1517–1531 CrossRef.
- F. M. Ahou-Attia and F. M. EI-Anwar, Spectrophotometric investigation of lincomycin and clindamycin–palladium (II) complexes and its application for their assay in capsules and ampoules, J. Drug Res., 2000, 23, 251–257 CAS.
- S. Cao, S. Song, L. Liu, N. Kong, H. Kuang and C. Xu, Comparison of an enzyme-linked immunosorbent assay with an immunochromatographic assay for detection of lincomycin in milk and honey, Immunol. Invest., 2015, 44, 438–450 CrossRef CAS PubMed.
- F. Li, Y. Guo, X. Wang and X. Sun, Multiplexed aptasensor based on metal ions labels for simultaneous detection of multiple antibiotic residues in milk, Biosens. Bioelectron., 2018, 115, 7–13 CrossRef CAS PubMed.
- J. Olšovská, M. Jelínková, P. Man, M. Kobérská, J. Janata and M. Flieger, High-throughput quantification of lincomycin traces in fermentation broth of genetically modified Streptomyces spp. Comparison of ultra-performance liquid chromatography and high-performance liquid chromatography with UV detection, J. Chromatogr. A, 2007, 1139, 214–220 CrossRef PubMed.
- X. M. Fang, L. X. Feng and J. N. Ye, Determination of lincomycin and lincomycin B in bulk drug and pharmaceutical formulations by capillary zone electrophoresis with amperometric detection, Anal. Lett., 1996, 29, 1975–1984 CrossRef.
- W. C. Yang, A. M. Yu and H. Y. Chen, Applications of a copper microparticle-modified carbon fiber microdisk array electrode for the simultaneous determination of aminoglycoside antibiotics by capillary electrophoresis, J. Chromatogr. A, 2001, 905, 309–318 CrossRef CAS PubMed.
- B. Ge, Z. Li, Y. Xie, L. Yang and R. Wang, CdTe quantum dots and gold nanoparticle based spectral methods for determination of lincomycin, Opt. Spectrosc., 2015, 118, 748–755 CrossRef CAS.
- X. Sun, H. Wang, Y. Jian, F. Lan, L. Zhang, H. Liu, S. Ge and J. Yu, Ultrasensitive microfluidic paper-based electrochemical/visual biosensor based on spherical-like cerium dioxide catalyst for miR-21 detection, Biosens. Bioelectron., 2018, 105, 218–225 CrossRef PubMed.
- Y. Leng, K. Xie, L. Ye, G. Li, Z. Lu and J. He, Gold-nanoparticle-based colorimetric array for detection of dopamine in urine and serum, Talanta, 2015, 139, 8990–8995 CrossRef PubMed.
Footnote |
| † Electronic supplementary information (ESI) available: Fig. S1–3 and Table S1. See DOI: 10.1039/c9ra04095a |
| This journal is © The Royal Society of Chemistry 2019 |


