
 Open Access Article
 This Open Access Article is licensed under a Creative Commons Attribution-Non Commercial 3.0 Unported Licence
Controlling the product selectivity in the conversion of methanol to the feedstock for phenol production†
Abhay Suresh Zambare ,
John Ou,
David Shan Hill Wong,
Ching-Wen Yao and
Shi-Shang Jang*
,
John Ou,
David Shan Hill Wong,
Ching-Wen Yao and
Shi-Shang Jang*
Department of Chemical Engineering, National Tsing Hua University, Hsinchu Taiwan, Republic of China. E-mail: ssjang@mx.nthu.edu.tw; Tel: +886-3-573-5294
First published on 1st August 2019
Abstract
This work investigated a novel nonpetroleum-based catalytic process of methanol to phenol. The idea was to convert methanol to produce a main product stream having a molar ratio of propylene to benzene/toluene of unity along with relatively higher-value products including para-xylene and alkenes. Such a product mix would be ideal for the manufacturing of phenol. This was achieved using a catalyst of 1.5 wt% zinc impregnated on a silica-deposited HZSM-5 zeolite at 0.1 MPa, 430 °C and 1.2 h−1 weight hourly space velocity. HZSM-5, with its acidic sites predominately being Brønsted acid, produced mainly alkanes and aromatics, of which a good fraction was undesirable nine- or more-nine-carbon higher aromatics. Silica deposition on HZSM-5 passivated the catalytic activity outside the HZSM-5 pores, resulting in an increase of alkenes selectivity, a sharp decrease of nine- or more-nine-carbon higher aromatics selectivity, and a shift of the xylene product from an equilibrium mixture of meta-xylene, para-xylene, and ortho-xylene to mostly para-xylene. Impregnation of 1.5 wt% zinc on silica-deposited HZSM-5 generated more Lewis acid sites and further increased alkene selectivity, which, with the proper selection of process conditions, led to the production of the target stream. A detailed analysis of the effects of silica deposition, zinc impregnation, acidic sites, and process conditions on the catalyst performance was presented.
1. Introduction
The objective of this work was to demonstrate a novel nonpetroleum route for methanol to phenol. Phenol is an important chemical feedstock for the production of phenolic resins, synthesis of adipic acid, bisphenol, chloro- and nitrophenols, caprolactam phenol sulfonic acids, etc. Cumene production, which is the first step of phenol production requires a propylene (P) to benzene (B) molar ratio of approximately one.1 The idea was to convert methanol to a product having a molar ratio of P to B and toluene (T) of unity, along with such valuable byproducts as para-xylene (p-X) and alkenes (ethylene, P, and butenes). As the chemical industry often converts T to B, such a product would be ideal for the manufacturing of phenol.Many studies have been carried out for the conversion for methanol to aromatics (MTA) by adding metal species such as zinc,2,3 silver,4 gallium,5 nickel,6,7 etc. on HZSM-5. Among all the metal species, zinc has received considerable attention due to its good selectivity toward aromatics, relatively low cost, and being less toxic.8–15 In the appendix, Table 7 lists the catalytic performances of HZSM-5, zinc-impregnated HZSM-5 (Zn/HZSM-5), silica-deposited HZSM-5 (Si/HZSM-5), and zinc-impregnated silica deposited HZSM-5 (Zn/Si/HZSM-5) found in the literatures. The impregnation of Zn on HZSM-5 in general increased aromatics selectivity and decreased alkanes (methane, ethane, propane, butanes) selectivity. However, the effects of adding Zn on alkenes and P selectivities were much less certain and were different in different studies. For example, Zhang et al.9 and Xu et al.10 observed an increase in alkenes selectivity. Conte et al.11 observed a significant decrease in alkenes selectivity while Li et al.13 saw a small reduction in alkenes selectivity. With regard to the p-X byproduct, on all Zn-modified HZSM-5 catalysts, the purity of p-X in xylenes (p-X/X) was around 24.0% except for the 72.4% by Xu et al.10
Silica deposition on HZSM-5 would shift the undesirable m-X, o-X, and nine- or more-nine-carbon higher aromatics (A9+) to the more desirable p-X, as shown in the appendix, Table 7. However, changes in the selectivities for alkanes, alkenes, and P were quite different in these studies.13,16 The alkenes selectivity was very high on Li et al. catalyst.16 The discrepancy could be due to the differences in catalysts (e.g. SiO2/Al2O3 of 30 (ref. 13) vs. 50, 200 (ref. 16)) and/or reaction temperatures (460 (ref. 13) vs. 400 °C (ref. 16)).
There were only a few published results on Zn/Si/HZSM-5.12–14 Only Li et al.13 reported the selectivities of alkenes and aromatics. They observed a substantial increase in the combined selectivity for B, T, and p-X. However, alkenes selectivity decreased marginally.
Throughout the literatures on methanol conversion, none of the authors reported P/BT molar ratio. We have calculated their molar ratios based on available data shown in Table 7. The values range from 0.2 to 4.4. Xu et al.10 and Conte et al.11 reported P/BT molar ratio of 0.9 and 1.4 respectively, which are closest to our objective. However, the selectivities of P, B, and T were very low in Xu et al.'s10 work. In both studies, a substantial amount of undesirable aromatics (m-X, m-X, and A9+) were reported.
In the literatures, the HZSM-5 used for methanol to aromatics contained high amount of Brønsted acid sites (BAS) compared to that of Lewis acid sites (LAS).3,9,10,13 Zn impregnation on such HZSM-5 decreased BAS and increased LAS significantly.3,9,10,13 This resulted in an increase in the aromatics selectivity and a decrease in alkanes selectivity.3,9,10,13 The increase in the aromatic selectivity was attributed to Zn-LAS (ZnOH+) that could accelerate aromatization and dehydrogenation reactions. The selectivity of alkenes varied in different studies, however. For example, Zhang et al.9 and Xu et al.10 reported an increase in alkenes selectivity while Li et al.13 reported a small decrease in alkenes selectivity.
Si deposition on HZSM-5 decreased BAS and LAS respectively.13,16 The deposition appeared to decrease the aromatics selectivity.13,16 Most of the reduction was probably due to the absence of acid sites outside the zeolitic pores. The effects of Si deposition on alkenes and alkanes selectivities were very different in the literatures, however. Li et al.13 reported that although alkenes selectivity had increased to 8.9%, alkanes was still the main product with its selectivity increased to 49.7%. On the other hand, Li et al.16 showed that alkanes selectivity had dropped sharply and that alkenes had become the most abundant product.
Zn impregnation on Si/HZSM-5 significantly decreased BAS and increased LAS inside the zeolitic pores of Si/HZSM-5.13 This resulted in an increase in aromatics selectivity and a significant decrease in alkanes selectivity with a minor increase in alkenes selectivity. The increase in aromatics selectivity was attributed to the increased Zn-LAS inside the zeolitic pores of Si/HZSM-5 that promoted aromatization and dehydrogenation reactions.
From the aforementioned results, we can see that the product selectivities of methanol conversion could be manipulated with Zn impregnation and Si passivation. In this work, the technical feasibility of methanol to phenol was evaluated using HZSM-5, Zn/HZSM-5, Si/HZSM-5, and Zn/Si/HZSM-5 as catalysts. The effects of Zn impregnation, Si passivation, acidic sites, and process conditions on catalyst performance were analyzed.
2. Experimental section
2.1 Catalyst preparation
NH4-ZSM-5 with a SiO2/Al2O3 molar ratio of 30 with approximately 0.3 to 0.5 μm crystal size17 (obtained from Zeolyst International) was pressed (10 tons cm−2 for 1 min), crushed and sieved to get NH4-ZSM-5 pellets of 30–50 mesh. Silica deposition on these NH4-ZSM-5 pellets was carried out using chemical liquid deposition of polyphenylmethylsiloxane (PPMS). Typically, NH4-ZSM-5 pellets (60.0 g) were added to a mixture of n-hexane (200.0 g) and PPMS (17.17 g, 4 wt% SiO2 with respect to the zeolite) followed by rotating the solid–liquid mixture for 0.5 hour (h) at ambient temperature. After 0.5 h, n-hexane was rota-evaporated under vacuum to obtain PPMS-modified NH4-ZSM-5 which was further calcined at 120 °C first in N2 (350 ml min−1, 1.5 h) and then in the air (350 ml min−1, 6 h) at 550 °C to obtain silica deposited HZSM-5. The procedure was repeated three times to obtain the final external surface passivated catalyst denoted as Si/HZSM-5.The NH4-ZSM-5 powder was calcined at 550 °C for 5 h under N2 atmosphere to obtained HZSM-5 powder. The HZSM-5 powder (15 g) was wet impregnated with a solution of zinc nitrate hexahydrate (0.69 g in 12 ml water) and aged for 2 h to attend equilibrium. After 2 h, the mixture was directly calcined under N2 atmosphere (350 ml min−1) for 3 h at 120 °C and then at 550 °C for 5 h to obtain theoretically 1 wt% Zn impregnated HZSM-5, which was pressed (10 tons cm−2 for 1 min), crushed, and sieved to obtain catalyst pellets of 30–50 mesh denoted as 1.0 wt% Zn/HZSM-5. The Zn was impregnated on Si/HZSM-5 pellets using the similar procedure used for 1.0 wt% Zn/HZSM-5. The Si/HZSM-5 (15 g) were wet impregnated with a solution of zinc nitrate hexahydrate (0.69 g in 12 ml water) and aged for 2 h to attend equilibrium. After 2 h, the mixture was directly calcined under N2 atmosphere (350 ml min−1) for 3 h at 120 °C and then at 550 °C for 5 h to obtain theoretically 1 wt% Zn impregnated Si/HZSM-5 denoted as 1.0 wt% Zn/Si/HZSM-5. Similarly, 1.5 wt% Zn was impregnated on Si/HZSM-5 to obtain theoretically 1.5 wt% Zn impregnated Si/HZSM-5 denoted as 1.5 wt% Zn/Si/HZSM-5.
2.2 Catalysts characterization
| CL = (π/IMECL) × (r2/w) × A1450 |
| CB = (π/IMECB) × (r2/w) × A1540 |
2.3 Catalyst activity measurement
The conversion of methanol was performed in a continuous fix bed stainless steel reactor (54 cm in length and 1.27 cm inner diameter) at 430 °C and 0.1 MPa. A schematic view of the lab scale setup is shown in Fig. 1. The desired amount of catalyst was loaded in the center of the reactor and the catalyst bed was heated in N2 stream from ambient temperature to 430 °C. The temperature of the catalyst bed was monitored using three K-type thermocouples (TC) placed on the external surface of the reactor wall as shown in Fig. 1. After reaching the desired temperature of 430 °C, the N2 flow was shut-off and a methanol flow (0.1 ml min−1) was cut in using a calibrated syringe pump. The methanol passed through a preheater at 235 °C, then into the reactor over the catalyst bed.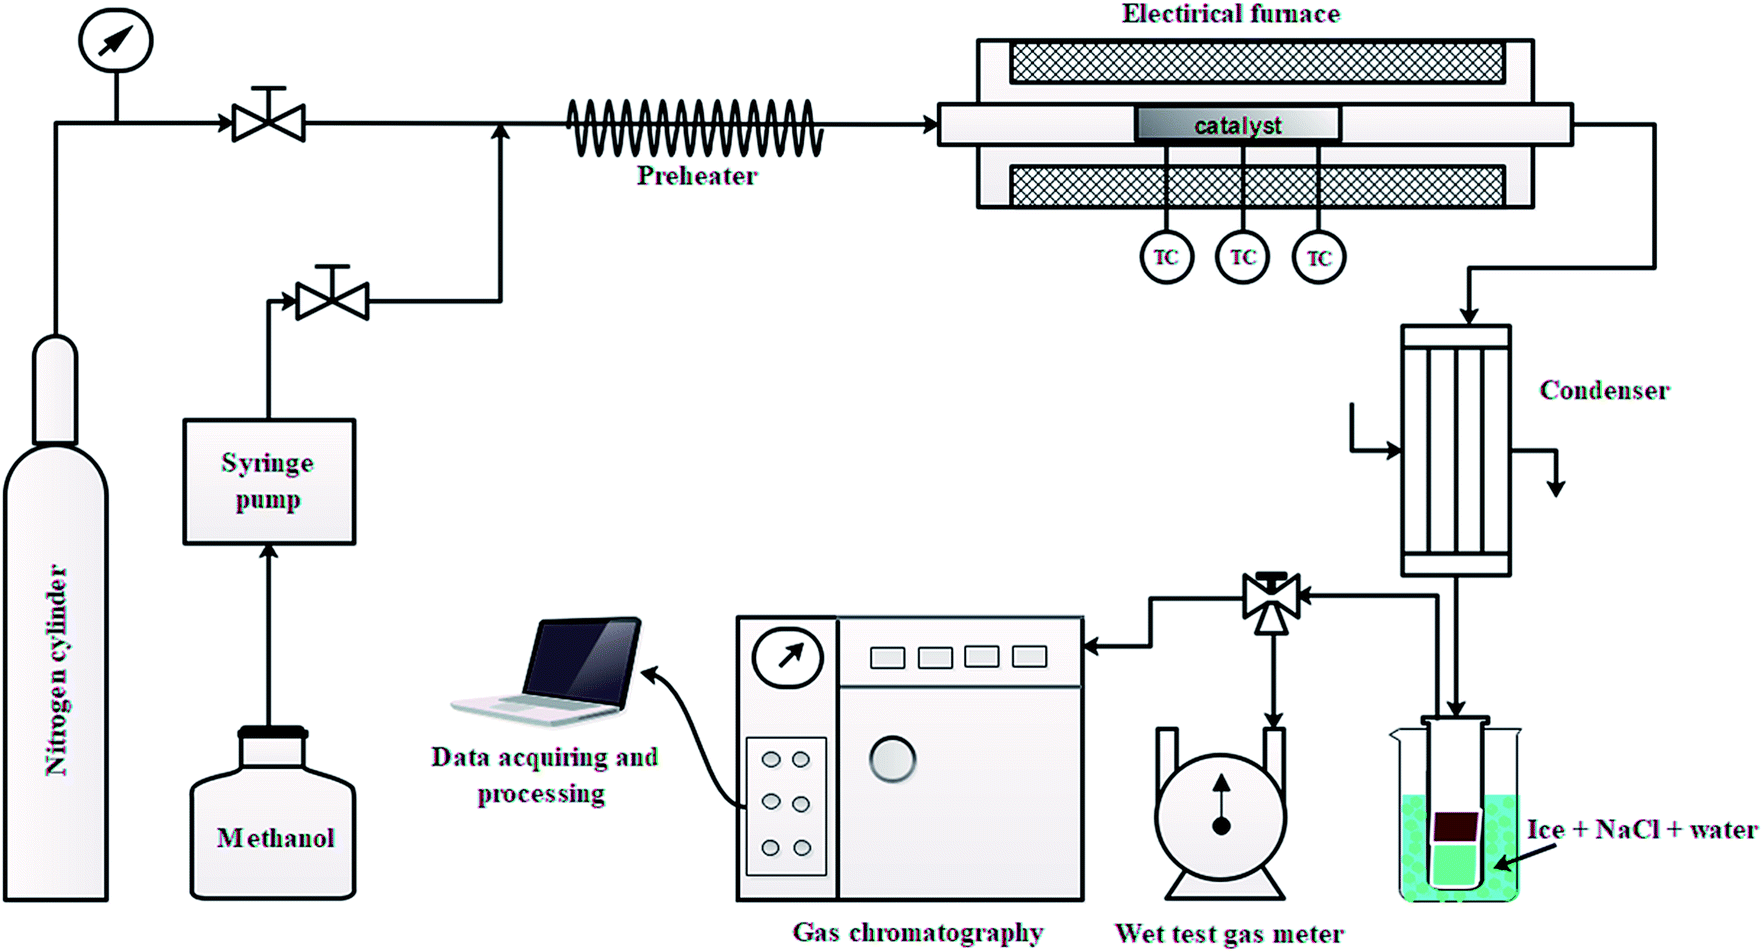 | ||
| Fig. 1 A schematic view of the lab scale setup. | ||
The gaseous product mixture at the reactor outlet was passed through the condenser maintained at −5 °C to separate the gas and liquid products. The gaseous hydrocarbons were analyzed by a GC (Agilent 7890B) equipped with a capillary column (DB-1) on FID mode and non-hydrocarbons (CO, CO2, and H2) were analyzed using capillary column (ShinCarbon ST 120) on TCD mode. The volume of gas was measured by a wet test gas meter. The gas was sampled and analyzed online two times to obtain the two data points for gas composition. The first sample was taken at 5 minutes after cutting in methanol and the second sample at 60 minutes. For the test of 1.5 wt% Zn/Si/HZSM-5, however, only the 60 min sample was taken. Then the weight of gas component i was obtained by combining the two gas readings from the experimental data of gas products.
The liquid products were sampled and analyzed offline at 60 min after cutting in methanol. The liquid hydrocarbons were separated from the water and analyzed on a GC (Agilent 7890B) equipped with a capillary column (DB-1) on FID mode. A second GC (Agilent 7820A) equipped with a capillary column (HP-INNOWAX) on FID mode was used to determine the composition of xylene (X) isomers. The water was also analyzed on a GC (Agilent 7890B) equipped with a capillary column (DB-1) in FID mode to analyze DME, methanol or hydrocarbon if present. Then the weight of component i in liquid hydrocarbons was calculated from the experimental data of liquid hydrocarbon products. The conversion of methanol, the selectivity of component i and the carbon balance were calculated by the following equations.


Where WCout is the weight of the outlet C element and WCin is the weight of the inlet C element.
The C4-hydrogen transfer index (C4-HTI), which is a parameter to measure the activity for hydrogen transfer19,20 was calculated as the combined selectivity of n-butane and iso-butane divided by the total C4 selectivity. The selectivity of hydrogen (H2) from aromatization was separated from the selectivity of H2 from methanol decomposition using the following equation.

In the conversion of methanol, the molecular H2 generated is attributed to the two aspects. First due to aromatization reaction and second due to methanol decomposition which forms COx and H2. Hence, the selectivity of H2 calculated using the above equation can be used to verify aromatization reactions on the catalysts.
The weight of H2 from methanol decomposition can be estimated from the amounts of CO and CO2 found in the reaction products based on the following reaction equations.
| CH3OH + H2O → CO2 + 3H2 |
| CH3OH → CO + 2H2 |
3. Results and discussion
3.1 Physical and chemical properties of catalysts
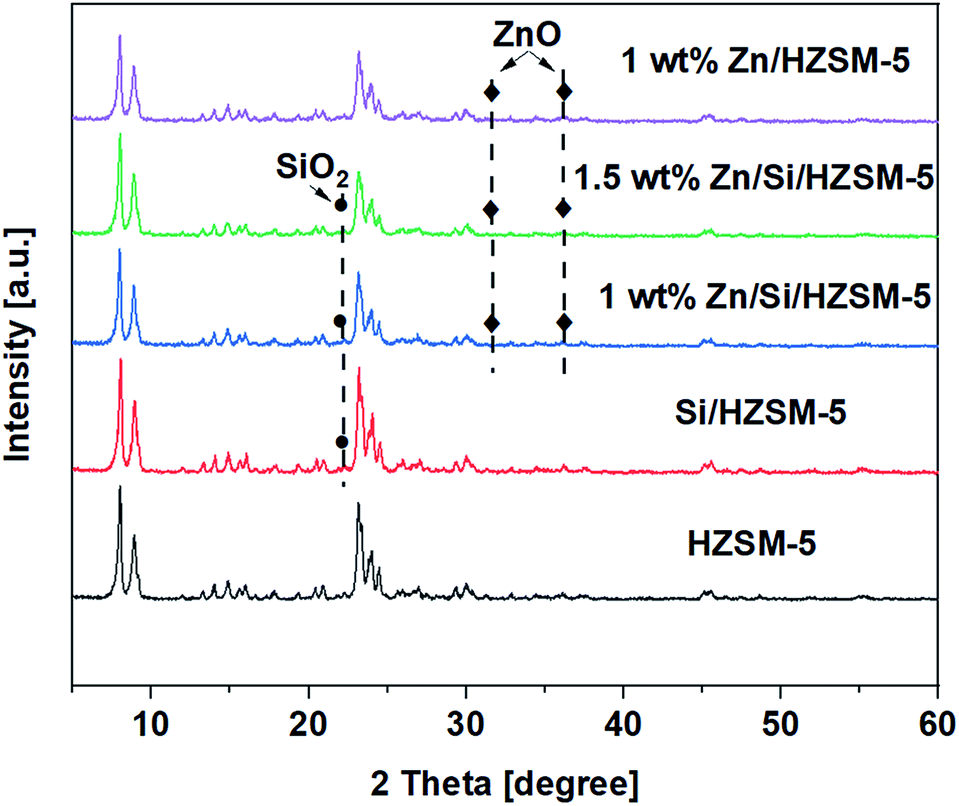 | ||
| Fig. 2 XRD patterns of the parent HZSM-5, and the modified HZSM-5 catalysts. | ||
| Catalysts | Specific surface area (m2 g−1) | Pore volume (cm3 g−1) | |||
|---|---|---|---|---|---|
| aSBET | bSmicropore | Pvol | bVmicro | cVmesopore | |
| a BET method.b t-plot method.c Vmeso = Pvol – Vmicro. | |||||
| HZSM-5 | 322 | 216 | 0.26 | 0.12 | 0.15 |
| 1 wt% Zn/HZSM-5 | 321 | 199 | 0.25 | 0.11 | 0.15 |
| Si/HZSM-5 | 258 | 196 | 0.23 | 0.11 | 0.12 |
| 1 wt% Zn/Si/HZSM-5 | 244 | 185 | 0.21 | 0.10 | 0.11 |
| 1.5 wt% Zn/Si/HZSM-5 | 235 | 178 | 0.20 | 0.09 | 0.10 |
The decrease in the pore volume on the Si/HZSM-5 catalyst was probably due to channel blocking by the silica deposition. The Zn impregnation on HZSM-5 did not seem to affect the specific surface area and the pore volume to a greater extent compared to that of HZSM-5 catalyst. The impregnation of Zn on Si/HZSM-5 catalyst further decreased moderately the specific surface area and the pore volume compared to that of the Si/HZSM-5 catalyst.
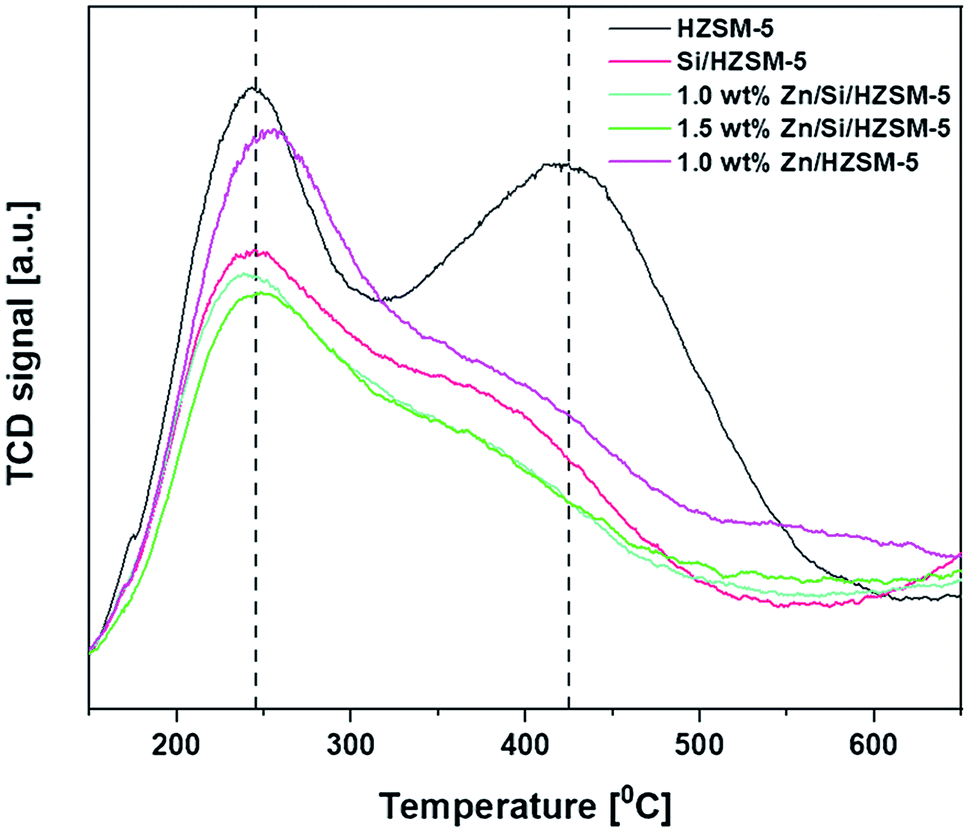 | ||
| Fig. 3 NH3-TPD profiles of HZSM-5, Zn/HZSM-5, Si/HZSM-5, and Zn/Si/HZSM-5. | ||
| Catalyst | Amount of acid sites (μmol g−1) | ||
|---|---|---|---|
| Total | Medium (150–350 °C) | Strong (>350 °C) | |
| HZSM-5 | 660 | 230 | 430 |
| 1.0 wt% Zn/HZSM-5 | 477 | 252 | 225 |
| Si/HZSM-5 | 367 | 200 | 167 |
| 1.0 wt% Zn/Si/HZSM-5 | 330 | 180 | 150 |
| 1.5 wt% Zn/Si/HZSM-5 | 306 | 173 | 133 |
From Fig. 3, two typical desorption peaks for the HZSM-5 catalyst centering at around 245 °C and 425 °C are observed and are ascribed to NH3 desorption from medium and strong acid sites, respectively.
The high-temperature peak observed around 425 °C reduced to a greater extent for all Zn-impregnated catalysts. From Fig. 3, it can be said that the impregnation of Zn on HZSM-5 not only shifted the peak position from 245 °C to 255 °C but also reduced the total acidity. In particular, the amount of strong acid sites reduced from 430 μmol g−1 to 225 μmol g−1. However, the amount of medium acid sites increased slightly from 230 μmol g−1 to 252 μmol g−1 (Table 2). Silica deposition on HZSM-5 not only changed the peak position of acid sites from 425 °C on HZSM-5 to 380 °C but also decreased amount of medium acid sites from 230 to 200 μmol g−1 and amount of strong acid sites from 430 to 167 μmol g−1. The impregnation of Zn on Si/HZSM-5 further decreased amount of both medium and strong acid site compared to that of HZSM-5. The amount of medium acid sites were 180 μmol g−1 and 173 μmol g−1 on 1.0 wt% Zn/Si/HZSM-5 and 1.5 wt% Zn/Si/HZSM-5, respectively. The amount of strong acid sites were 150 μmol g−1 and 133 μmol g−1 on 1.0 wt% Zn/Si/HZSM-5 and 1.5 wt% Zn/Si/HZSM-5, respectively.
The Py-IR was performed to detect the nature and amount of acid sites. Fig. 4a shows the pyridine spectra of unmodified and modified HZSM-5 catalysts. The amount of total acid sites, LAS and BAS of the catalysts are given in Table 3.
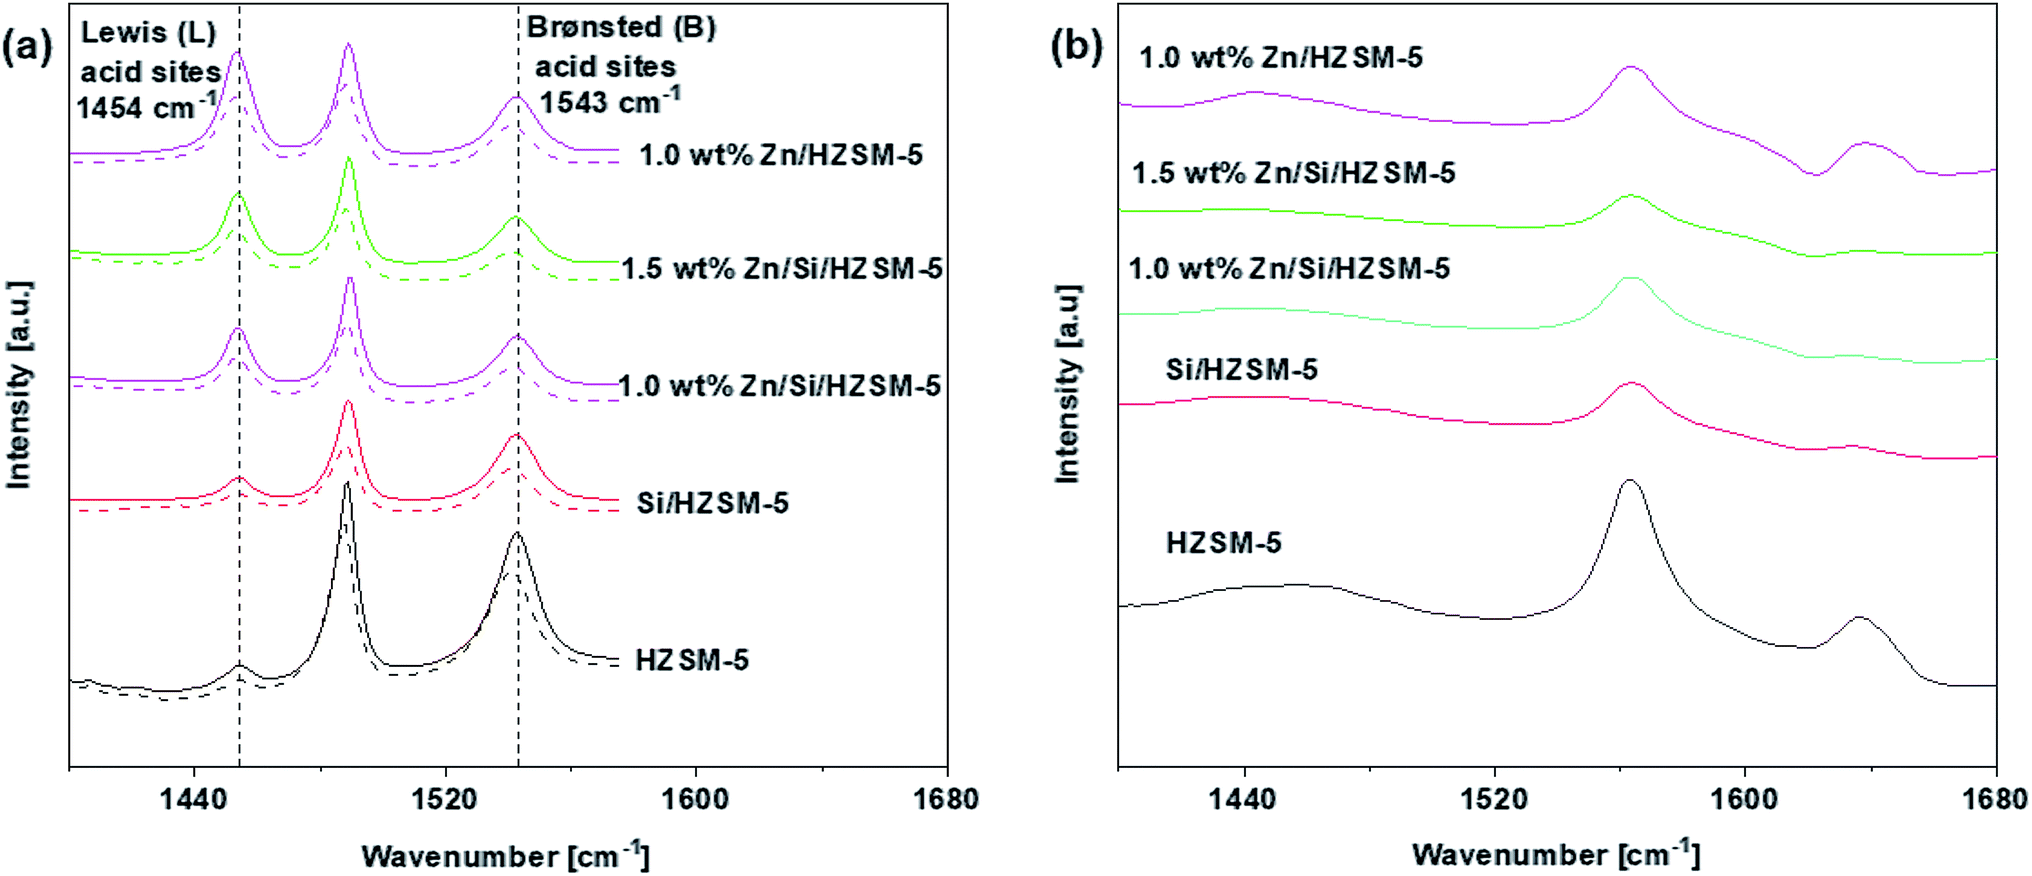 | ||
| Fig. 4 (a) Py-FTIR of HZSM-5, Zn/HZSM-5, Si/HZSM-5, and Zn/Si/HZSM-5 (solid line for desorption at 250 °C and dashed line for desorption at 350 °C). (b) 2,4,6-trimethylpyridine -FTIR of HZSM-5, Si/HZSM-5, and Zn/Si/HZSM-5 at 250 °C. | ||
| Catalyst | Amount of acid sites (μmol g−1) | bExternal acidity/total acidity (%) | ||
|---|---|---|---|---|
| aTotal (LAS + BAS) | aLAS | aBAS | ||
| a determined by Py-IR.b determined by 2,4,6-trimethylpyridine IR. | ||||
| HZSM-5 | 300 | 20 | 280 | 28 |
| 1.0 wt% Zn/HZSM-5 | 231 | 108 | 123 | 25 |
| Si/HZSM-5 | 160 | 16 | 144 | 6 |
| 1.0 wt% Zn/Si/HZSM-5 | 158 | 52 | 106 | 3 |
| 1.5 wt% Zn/Si/HZSM-5 | 147 | 59 | 88 | 5 |
Fig. 4a shows that three characteristic peaks around 1453, 1540, and 1490 cm−1, which can be attributed to LAS, BAS, and LAS + BAS sites,21 appeared in all of the samples. From Fig. 4a, for HZSM-5 catalyst, it can be observed that the number of the BAS are much more compared to that of the LAS indicating that BAS dominate on the HZSM-5 catalyst. The impregnation of Zn on HZSM-5 sharply increased LAS and decreased BAS. The amount of total acid sites on 1.0 wt% Zn/HZSM-5 decreased from 300 μmol g−1 on HZSM-5 to 231 μmol g−1. Hence, the nature of acid sites changes with the impregnation of Zn species. This phenomenon has been reported in may research papers.21–24 On Si/HZSM-5 catalyst, the amount of both BAS and LAS decreased, the amount of BAS decreased to a greater extent (Fig. 4a). The amount of total acid sites decreased significantly from 300 μmol g−1 on HZSM-5 to 160 μmol g−1 on Si/HZSM-5.
The impregnation of Zn on Si/HZSM-5 catalysts increased the amount of LAS and decreased the amount of BAS (Fig. 4a). The amount of total acid sites on 1.0 wt% Zn/Si/HZSM-5 and 1.5 wt% Zn/Si/HZSM-5 were 158 μmol g−1 and 147 μmol g−1, respectively compared to that of 300 μmol g−1 on HZSM-5. The change BAS and LAS is attributed to the strong interaction between the intrinsic acid sites and the Zn species due to which partial BAS are converted into Zn-LAS21 (preferentially ZnOH+ species). As reported in the literature, Zn-LAS (ZnOH+ species) have the ability to accelerate the process of aromatization.25
The external acid sites determined using 2,4,6-trimethylpyridine is illustrated in Fig. 4b. The external acid sites account for 28%, 25%, 6%, 3% and 5% of the total acidity for HZSM-5, 1.0 wt% Zn/HZSM-5, Si/HZSM-5, 1.0 wt% Zn/Si/HZSM-5, and 1.5 wt% Zn/Si/HZSM-5, respectively as shown in Table 3. The significant reduction in the acidity on Si/HZSM-5 and Zn/Si/ZSM-5 validated that the external acid sites were significantly reduced after the catalyst modifications.
3.2 Performance of the catalyst
The conversion of methanol on all the catalysts was above 99.0% for 1 h and no DME was detected under the reaction conditions used. The higher temperature favors decomposition of methanol to COx and H2 which can reduce the aromatic selectivity. Hence, all the experiments were performed at 430 °C to avoid high methanol decomposition. The carbon balance for all the runs was above 98%.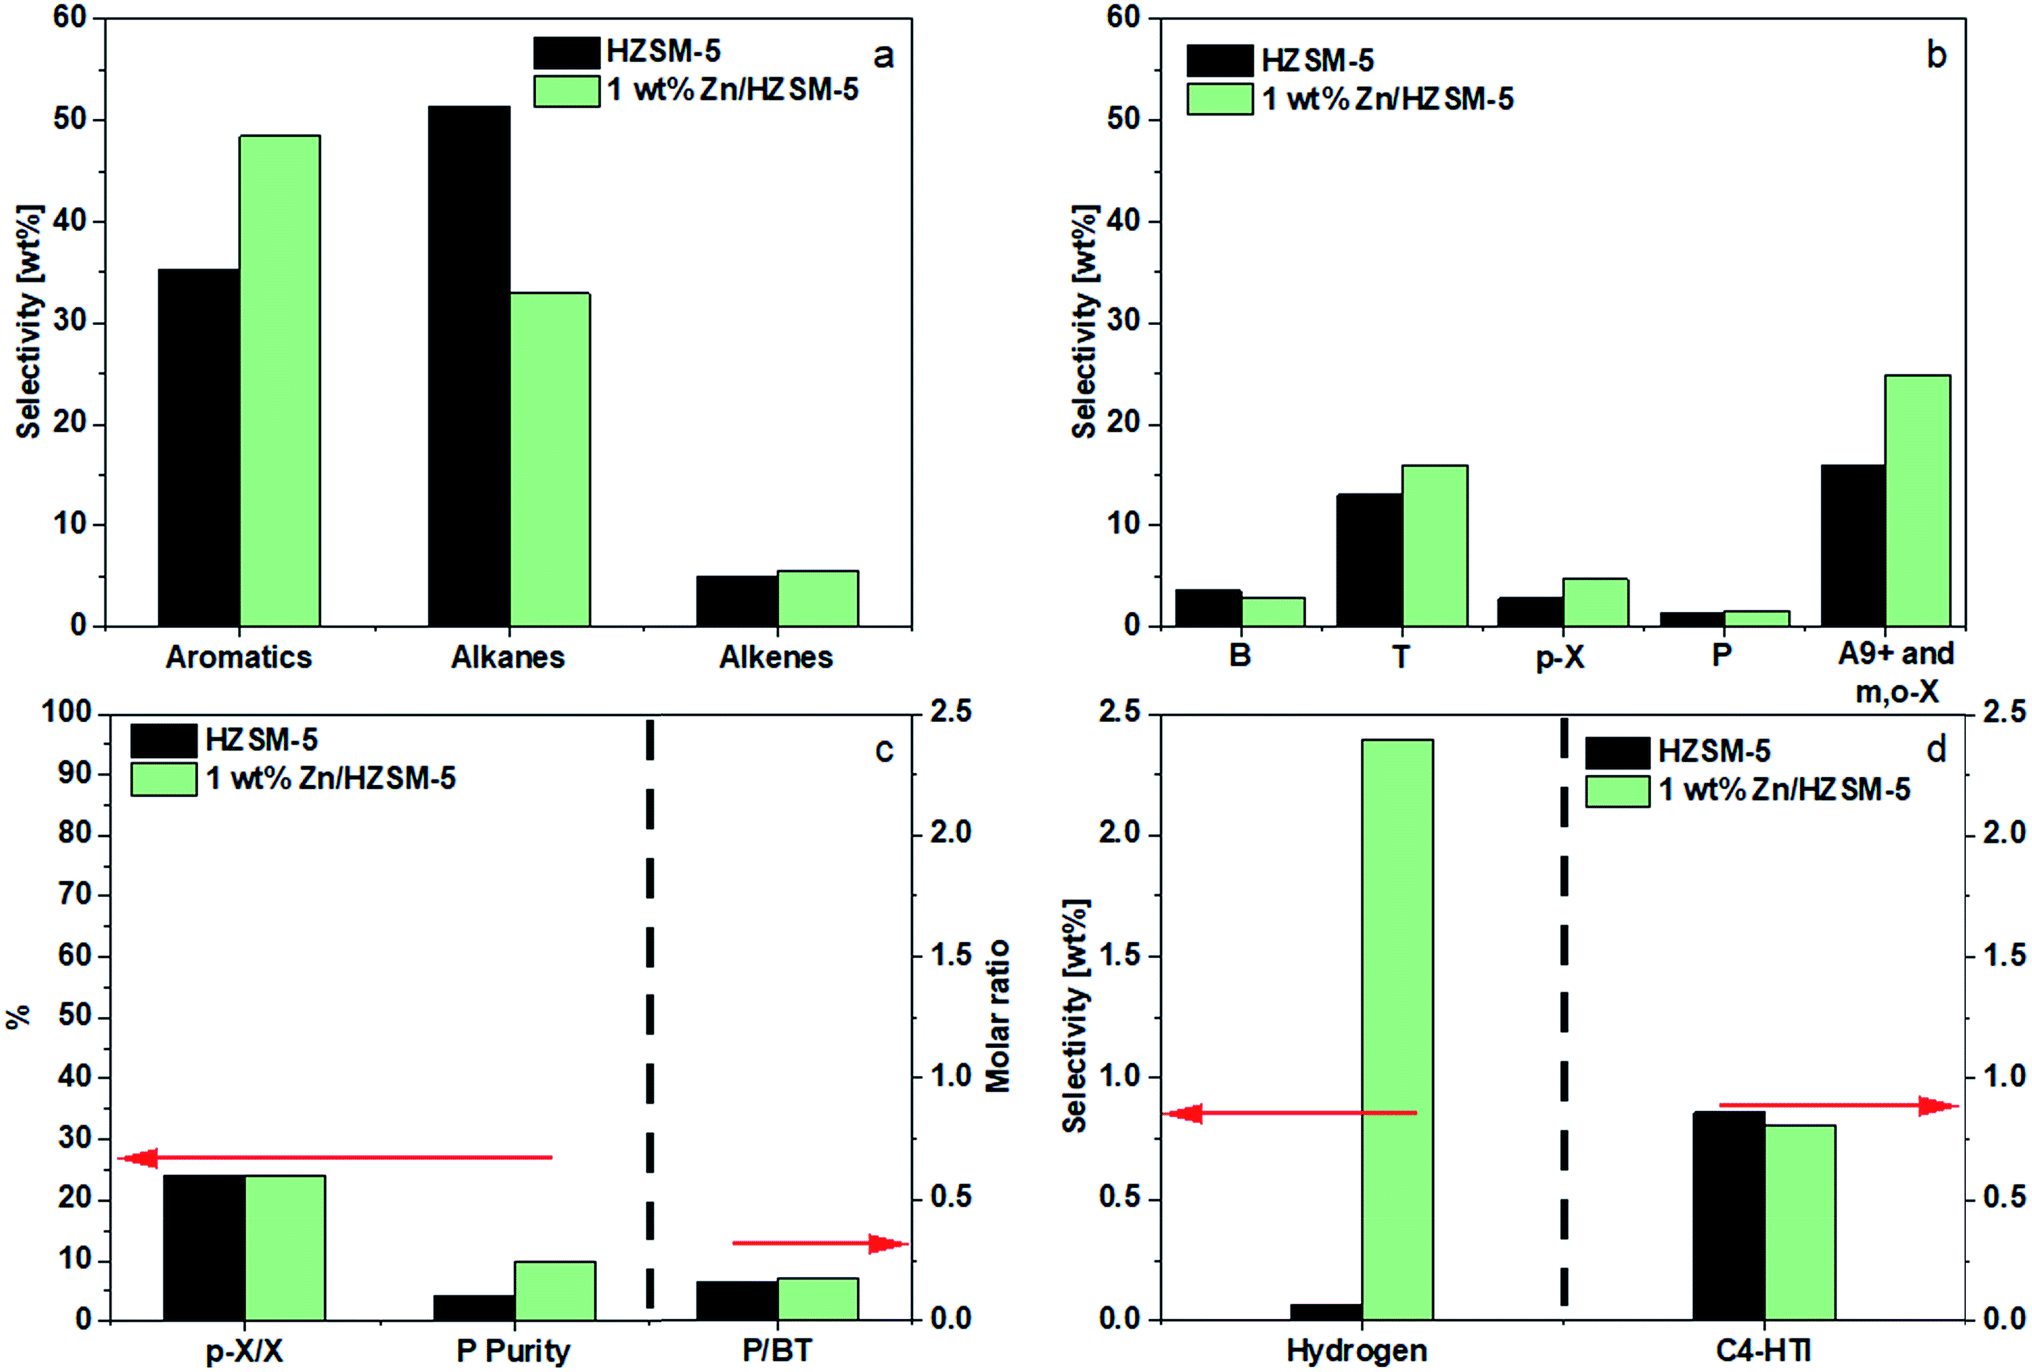 | ||
| Fig. 5 (a) Selectivity of aromatics, alkanes, and alkenes on different catalysts. (b) Selectivity of B, T, p-X, P, A9+ and m,o-X on different catalysts. (c) p-X/X, P purity and P/BT molar ratio. (d) Hydrogen selectivity and C4-HTI; Reaction conditions: 0.1 MPa, 430 °C, WHSV = 1.6 h−1, the data were obtained at 1 h. | ||
A good fraction of the shifting, however, was directed toward m-X, o-X, and A9+ (24.9 wt%), resulting in a combined BTp-X selectivity of 23.6 wt%. A small increase in the selectivity of alkenes (4.9 wt% to 6.1 wt%) was observed (Fig. 5a). The impregnation of 1.0 wt% Zn had no appreciable effect on the P selectivity. However, the purity of P (P/C3) increased due to a decrease in the selectivity of and C3 alkane (Fig. 5c). The results on aromatics selectivity is consistent with those reported in the literature. The small increase in P selectivity (from 1.3 wt% to 1.6 wt%) was similar to that of Zhang9 and Xu et al.10 It should be noted that the selectivity of H2 on HZSM-5 was less because the H2 generated from aromatization was most probably consumed via hydrogen transfer reaction to form alkanes. On 1.0 wt% Zn/HZSM-5, hydrogen selectivity increased sharply and hydrogen transfer index decreased (Fig. 5d), indicating that zinc impregnation promoted aromatization, reduced hydrogen transfer, and facilitated the formation of hydrogen molecules.
As shown in Fig. 5c, the HZSM-5 catalyst demonstrated a P/BT molar ratio of 0.2. Impregnating 1.0 wt% Zn had no effect on the P/BT molar ratio.
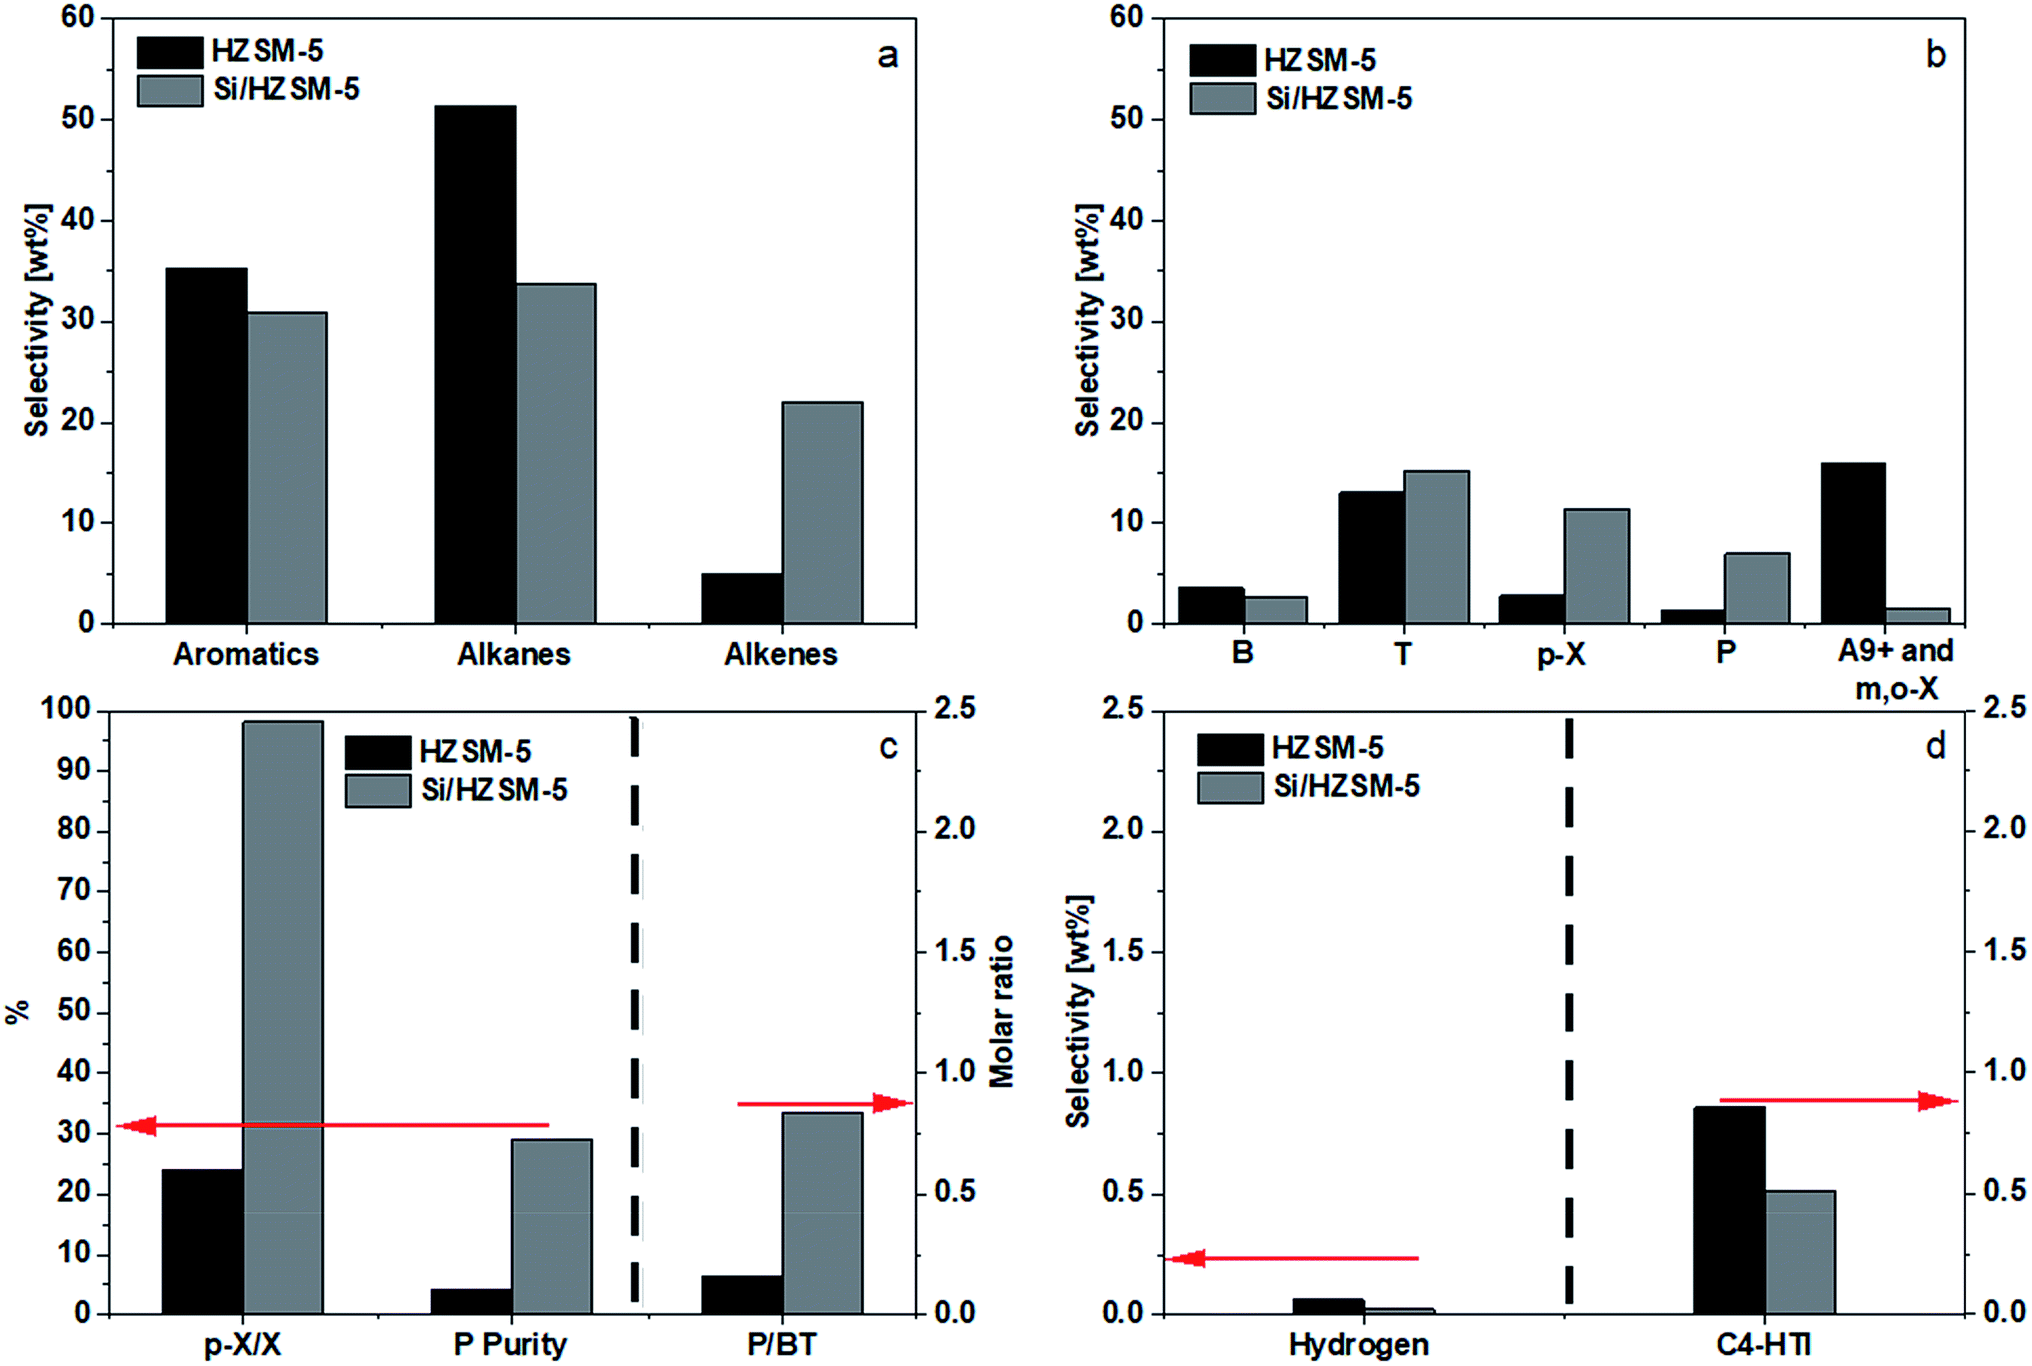 | ||
| Fig. 6 (a) Selectivity of aromatics, alkanes, and alkenes on different catalysts. (b) Selectivity of B, T, p-X, P, A9+ and m,o-X on different catalysts. (c) p-X/X, P purity and P/BT molar ratio. (d) Hydrogen selectivity and C4-HTI; Reaction conditions: 0.1 MPa, 430 °C, WHSV = 1.6 h−1, the data were obtained at 1 h. | ||
The benefits of silica deposition are clear. It significantly reduced the combined selectivities of A9+, m-X, and o-X from 16.0 to 1.6 wt%, shifting these undesired aromatics to the wanted B, T, and p-X. Furthermore, the catalyst's shape selectivity raised the p-X selectivity from a mere 2.8 wt% to 11.5 wt%, with the p-X purity in X reaching 98.2%. Equally beneficial is the shifting of alkanes (decreasing from 51.4 to 33.8 wt%) to P and alkenes. Fig. 6d showed a decreased C4-HTI, which was probably due to the loss of the acid sites on the external surface. As the change in aromatics selectivity was relatively minor compared to the decrease in alkanes selectivity and increase in alkenes selectivity, it may be inferred that a substantial amount of alkenes were converted into alkanes via the hydrogen transfer route on the surface outside the channels. Fig. 6c shows that silica deposition help raise the P/BT molar ratio from 0.2 to 0.8.
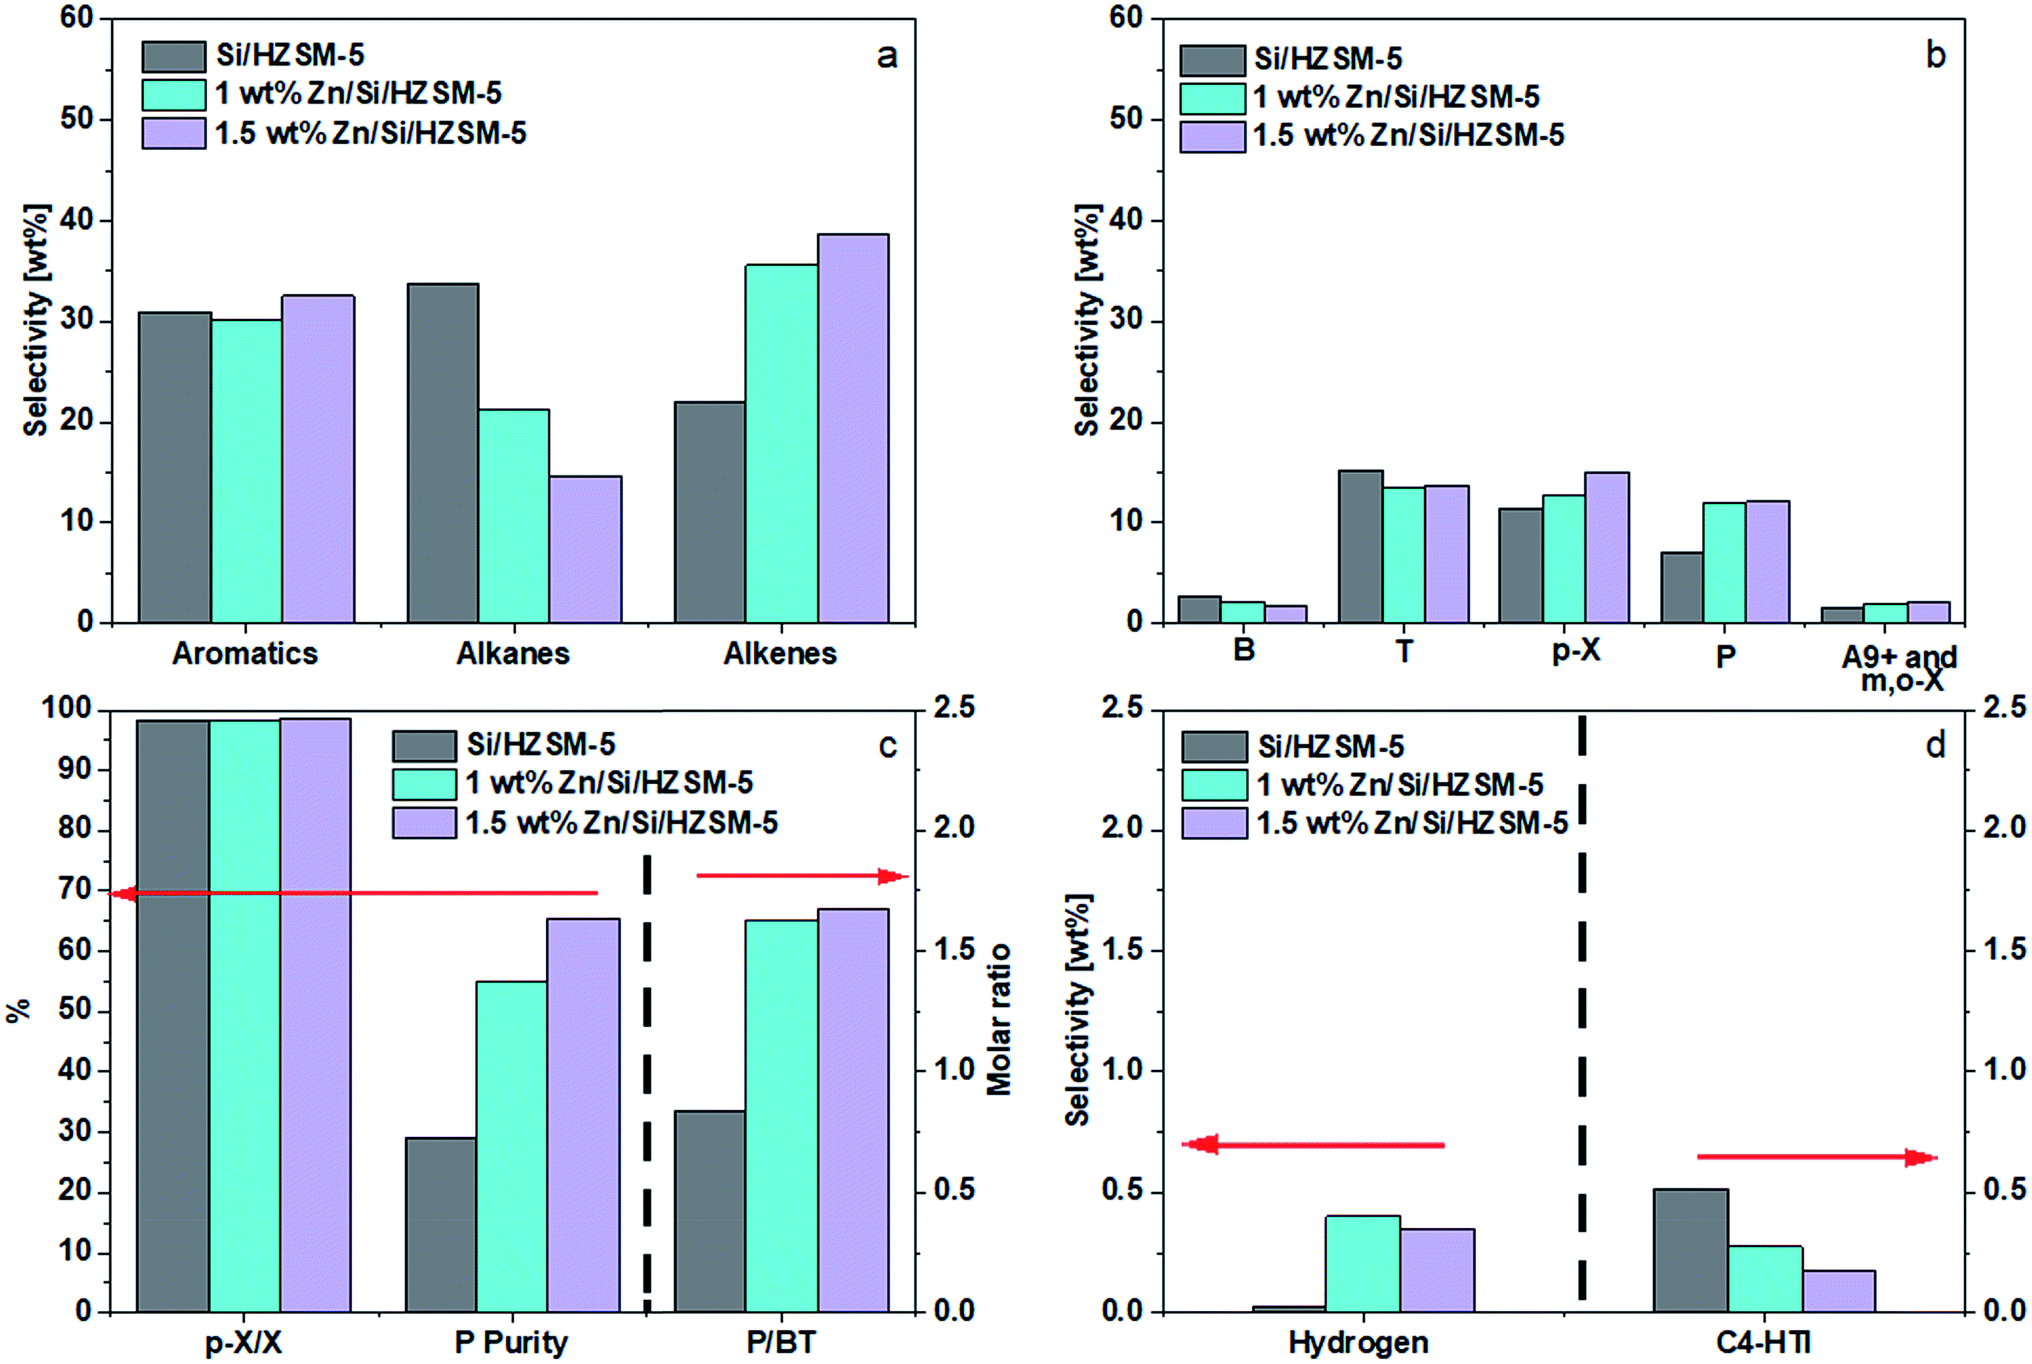 | ||
| Fig. 7 (a) Selectivity of aromatics, alkanes, and alkenes on different catalysts. (b) Selectivity of B, T, p-X, P, A9+ and m,o-X on different catalysts. (c) p-X/X, P purity and P/BT molar ratio. (d) Hydrogen selectivity and C4-HTI; Reaction conditions: 0.1 MPa, 430 °C, WHSV = 1.6 h−1, the data were obtained at 1 h. | ||
Thedifferences in performance between 1.0 wt% Zn and 1.5 wt% Zn were small, with 1.5 wt% Zn making more alkenes and P. Compared to the performance of Si/HZSM-5, 1.5 wt% Zn/Si/HZSM-5 further reduced alkanes selectivity (14.7 wt%), raised alkenes selectivity (38.7 wt%) and P selectivity (12.1 wt%), and kept the combined BTp-X selectivity at 30.5 wt%. The slightly lower selectivity of H2 (Fig. 7d) on 1.5 wt% Zn/Si/HZSM-5 compared to that of 1 wt% Zn/Si/HZSM-5 was most likely due to an experimental and/or instrumental error. Fig. 7d shows that Zn impregnation on Si/HZSM-5 promoted the formation of molecular hydrogen and suppressed the hydrogen transfer reaction, leading to an increase of propylene purity from 29.0 to 65.4% (Fig. 7c). Such a performance led to a P/BT molar ratio of 1.7 as shown in Fig. 7c. The catalyst 1.5 wt% Zn/Si/HZSM-5 was considered as better compared to that of other catalysts not only because it led to a high P/BT molar ratio of 1.7 but also showed higher selectivities towards p-X and alkenes simultaneously under reaction conditions used.
3.3 Effect of acidity on the performance
In this study, we were changing the nature of acidic sites, such as creating LAS and reducing BAS. Our analysis, therefore, focused on pyridine-adsorption data because pyridine adsorption provided more information on the nature of acidic sites than did NH3-TPD.| Catalyst | Selectivity (wt%) | Amount of acid sites (μmol g−1) | External acid sites (%) | C4-HTI | |||||
|---|---|---|---|---|---|---|---|---|---|
| Aromatics | BTX | A9+ | Alkanes | Alkenes | LAS | BAS | |||
| HZSM-5 | 35.3 | 27.8 | 7.5 | 51.4 | 4.9 | 20 | 280 | 28 | 0.86 |
| 1 wt% Zn/HZSM-5 | 48.4 | 38.3 | 10.1 | 33.0 | 6.1 | 108 | 123 | 25 | 0.81 |
| Catalyst | Selectivity (wt%) | Amount of acid sites (μmol g−1) | External acid sites (%) | C4-HTI | |||||
|---|---|---|---|---|---|---|---|---|---|
| Aromatics | BTX | A9+ | Alkanes | Alkenes | LAS | BAS | |||
| HZSM-5 | 35.3 | 27.8 | 7.5 | 51.4 | 4.9 | 20 | 280 | 28 | 0.86 |
| Si/HZSM-5 | 31.0 | 29.6 | 1.4 | 33.8 | 22.0 | 16 | 144 | 6 | 0.52 |
| Catalyst | Selectivity (wt%) | Amount of acid sites (μmol g−1) | External acid sites (%) | C4-HTI | |||||
|---|---|---|---|---|---|---|---|---|---|
| Aromatics | BTX | A9+ | Alkanes | Alkenes | LAS | BAS | |||
| Si/HZSM-5 | 31.0 | 29.6 | 1.4 | 33.8 | 22.0 | 16 | 144 | 6 | 0.52 |
| 1 wt% Zn/Si/HZSM-5 | 30.1 | 28.5 | 1.6 | 21.2 | 35.6 | 52 | 106 | 3 | 0.27 |
| 1.5 wt% Zn/Si/HZSM-5 | 32.5 | 30.7 | 1.8 | 14.7 | 38.7 | 59 | 88 | 5 | 0.18 |
3.4 Effect of WHSV on the product distribution
The effect of WHSV on product distribution is shown in Fig. 8. It appears that product distribution was sensitive to the flowrate of methanol. As can be seen in Fig. 8, lower flow rates in the range of 0.8 WHSV favored the conversion of alkenes to aromatics via aromatization reaction and to alkanes via hydrogen transfer. On the other hand, higher WHSV seemed to hinder most significantly the hydrogen transfer reaction and more modestly the aromatization reaction, leading to a higher alkenes selectivity. Consequently, the P/BT molar ratio could be tuned over a range from 0.4 to 1.7 using the 1.5 wt% Zn/Si/HZSM-5 catalyst at 0.1 MPa and 430 °C (Fig. 9). A P/BT molar ratio of 1.1 was achieved at a WHSV of 1.2 h−1. The combined selectivity of BTp-X and alkenes was 66.26 wt%. The combined selectivities of m-X, o-X, A9+ and alkanes were only 16.8 wt%.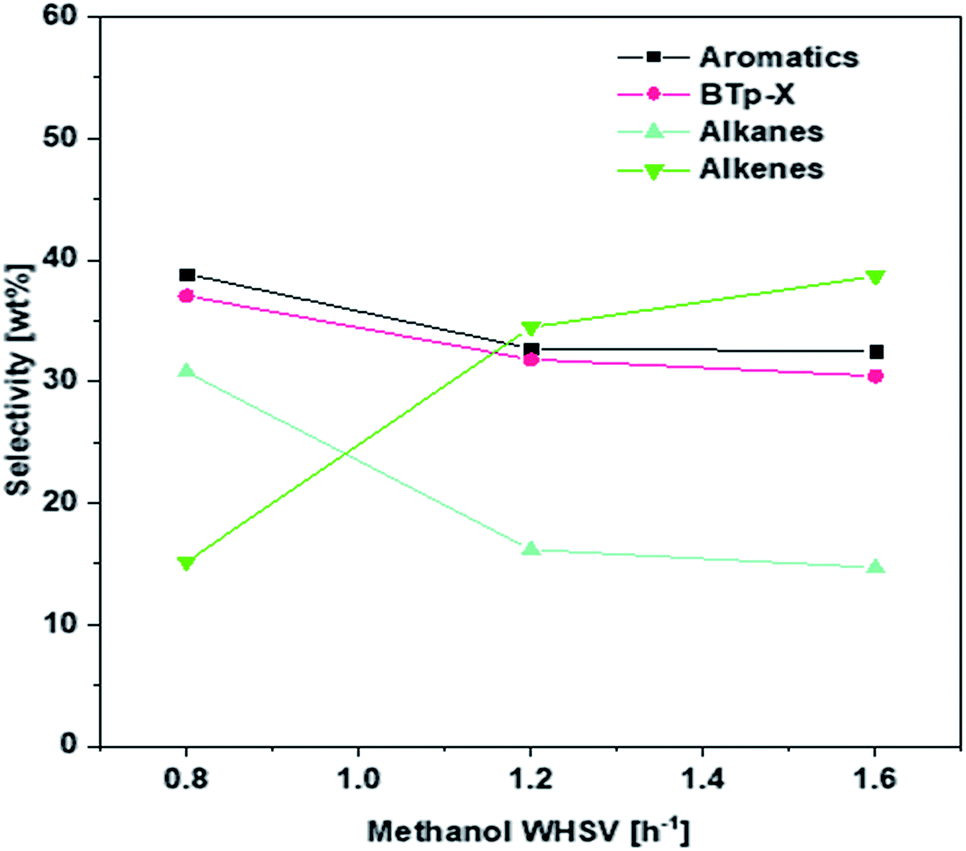 | ||
| Fig. 8 Effect of WHSV on the product selectivity over 1.5 wt% Zn/Si/HZSM-5. Reaction conditions: 0.1 MPa, 430 °C, the data were obtained at 1 h. | ||
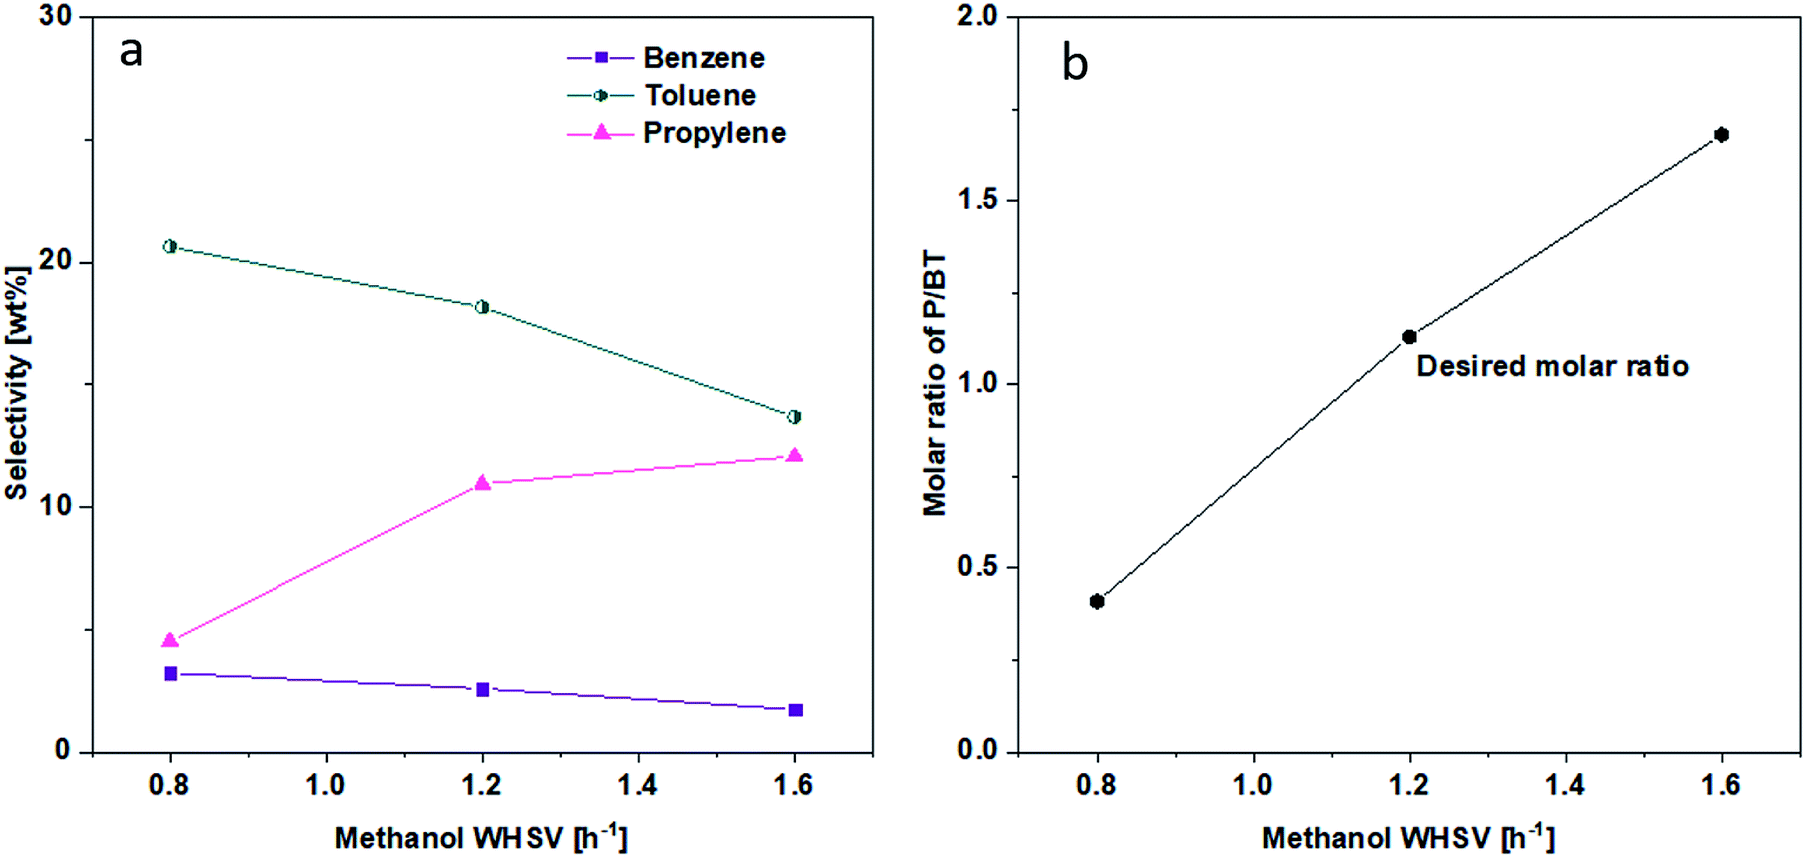 | ||
| Fig. 9 Effect of WHSV on (a) B, T and P selectivity. (b) P/BT molar ratio. Reaction conditions; 0.1 MPa, 430 °C, the data were obtained at 1 h. | ||
4. Conclusion
This work investigated a series of catalysts, including HZSM-5, Si/HZSM-5, Zn/HZSM-5, and Zn/Si/HZSM-5 for a novel nonpetroleum route of methanol to phenol. It was found that the catalyst of 1.5 wt% Zn/Si/HZSM-5 was capable of converting methanol to a main product stream having a P/BT molar ratio of unity, which would be an ideal feedstock for the manufacturing of phenol. The catalytic conversion also produced such relatively high-value byproducts as p-X and alkenes.HZSM-5 produced mainly alkanes and aromatics, with the alkanes selectivity being much higher than the aromatics selectivity. The high alkanes selectivity probably was due to hydrogen transfer promoted by the large quantity of BAS found on HZSM-5.
Impregnating Zn on HZSM-5 reduced BAS substantially, but increased LAS also substantially. Alkanes and aromatics were still the main products, however, the aromatics selectivity had become much higher than the alkanes selectivity. The newly created Zn-LAS appeared to be promoting aromatization more strongly than promoting hydrogen transfer. Although the Zn/HZSM-5 catalyst produced more aromatics, a good fraction of the aromatics were the relatively low-valued m-X, o-X, and A9+.
Silica deposition on HZSM-5 reduced BAS significantly. The majority of the reduction belonged to the BAS outside the zeolitic pores. Such passivation of external BAS appeared to do two shiftings, including a shifting of alkanes to alkenes and P, and a shifting amongst aromatics, in which the unwanted m-X, o-X, and A9+ were suppressed and the desired p-X and T were produced.
Impregnating Zn on Si/HZSM-5 reduced BAS further and created some LAS, with the net effects of decreasing total acid sites with increasing Zn loading. Such levels of catalyst acidity enabled the Zn/Si/HZSM-5 catalysts to increase P selectivity without sacrificing the selectivities of B, T, and p-X. The exact control of selectivity can be achieved by adjusting WHSV. Thus, a P/BT molar ratio of near 1 along with good alkenes selectivity (34.5 wt%), high p-X selectivity (11.1 wt%) and purity (97.8 wt%) were achieved simultaneously at 0.1 MPa, 430 °C and 1.2 h−1 WHSV on 1.5 wt% Zn/Si/HZSM-5.
Silica deposition, zinc impregnation, proper acidity adjustment, and process conditions were all essential for generating a product stream having a P/BT molar ratio of unity for the novel methanol to phenol process along with such high-value byproducts as p-X and alkenes.
Appendix
| Catalysts | Aromatics (wt%) | B (wt%) | T (wt%) | X (wt%) | p-X/X (wt%) | P (wt%) | Alkenes (wt%) | Alkanes (wt%) | P/BT (Molar ratio) | Reaction condition | Sample time (h) | Ref. | |
|---|---|---|---|---|---|---|---|---|---|---|---|---|---|
| Zn- modified HZSM-5 catalysts | 5 wt% Zn/HZSM-5, (HZSM-5 SiO2/Al2O3= 38) | 56.6 (36.3) | 2.0 (2.3) | 17.7 (12.0) | 24.4 (13.9) | 24.2 (23.7) | 2.2 (1.2) | 5.4 (2.9) | 23.3 (43.7) | 0.2 (0.2) | 420 °C, 0.1 MPa, weight hourly space velocity (WHSV) = 2.1 h−1, N2 flow rate = 30 ml min−1 | 4 | 9 |
| 1.5wt% Zn/HZSM-5, (HZSM-5 SiO2/Al2O3 = 38) | 50.9 (27.7) | 2.3 (2.8) | 9.5 (8.6) | 26.9 (10.0) | 72.4 (69.5) | 4.8 (3.6) | 11.5 (7.5) | 14.3 (41.0) | 0.9 (0.7) | 475 °C, 0.1 MPa, WHSV= 1 h−1, N2 flow rate = 30.8 ml min−1 | 2.25 | 10 | |
| 1 wt% Zn/HZSM-5, HZSM-5 SiO2/Al2O3 = 60) | 49.5 (24.8) | 4.0 (1.6) | 17.8 (6.7) | 21.1 (11.7) | n.a. | 14.4 (22.1) | 31.1 (39.5) | 10.3 (27.9) | 1.4 (5.6) | 450 °C, 0.1 MPa, WHSV = not given, N2 flow rate = 88 ml min−1 | 12 | 11 | |
| 1 wt% Zn/HZSM-5, (HZSM-5 SiO2/Al2O3 = 30) | 65.9 (38.4) | 4.9 (2.1) | 14.9 (5.6) | 25.9 (14.1) | 24.1 (23.5) | 2.1 (2.3) | 4.6 (5.4) | 26.0 (48.8) | 0.2 (0.6) | 460 °C, 0.1 MPa, WHSV = 1 h−1, N2 flow rate = 80 ml min−1 | 0.5 | 13 | |
| Silica deposited HZSM-5 catalysts | SiO2/HZSM-5 (HZSM-5 SiO2/Al2O3 = 30) | 33.8 (38.4) | 8.3 (2.1) | 10.2 (5.6) | 12.8 (14.1) | 97.3 (23.5) | 4.3 (2.3) | 8.9 (5.4) | 49.7 (48.8) | 0.5 (0.6) | 460 °C, 0.1 MPa, WHSV = 1 h−1, N2 flow rate = 80 ml min−1 | 0.5 | 13 |
| SiO2/HZSM-5, (HZSM-5 SiO2/Al2O3 = 50) | 27.4 (37.5) | 7.0 (7.9) | 8.9 (9.5) | 9.5 (12.5) | 98.1 (24.0) | 14.0 (0.7) | 36.3 (2.3) | 34.4 (59.5) | 1.8 (0.1) | 400 °C, 0.1 MPa, WHSV = 1 h−1, N2 flow rate = 40 ml min−1 | 0.5 | 16 | |
| SiO2/HZSM-5, (HZSM-5 SiO2/Al2O3 = 200) | 23.1 (35.4) | 5.9 (8.3) | 7.0 (9.8) | 8.8 (12.3) | 96.3 (24.2) | 28.2 (6.5) | 55.4 (11.9) | 18.3 (50.7) | 4.4 (0.7) | ||||
| Zn-modified Si/ HZSM-5 | 0.73 wt% Zn/HZSM-5/SiO2, (Si/HZSM-5 SiO2/Al2O3 = 28) | 36.6 (27.4) | 0.8 (1.2) | 11.0 (8.1) | 18.8 (12.9) | 94.8 (93.2) | n.a. | n.a. | n.a. | n.a. | 450 °C, 0.1 MPa, WHSV = 2.3 h−1 | 2 | 12 |
| 1 wt% Zn/Si/HZSM-5, (Si/HZSM-5 SiO2/Al2O3 = 30) | 59.8 (33.8) | 14.2 (8.3) | 18.6 (10.2) | 22.7 (12.8) | 97.8 (97.3) | 3.4 (4.3) | 6.7 (8.9) | 27.7 (49.7) | 0.2 (0.5) | 460 °C, 0.1 MPa, WHSV = 1 h−1, N2 flow rate = 80 ml min−1 | 0.5 | 13 | |
| 3 wt% ZnO/Si/HZSM-5 (Si/HZSM-5 SiO2/Al2O3 = 25) | 28 (n.a.) | n.a. | n.a. | n.a | 86.6 (n.a.) | 8.8 (n.a.) | n.a. | n.a. | n.a. | 475 °C, 0.1 MPa, WHSV = 0.79 h−1 | 0.5 | 14 | |
| The methanol conversion is ∼100% over all these catalysts. | |||||||||||||
Conflicts of interest
There are no conflicts to declare.Acknowledgements
This work was financially supported by a ChangChun Group, Taiwan and the Ministry of Science and Technology (MOST 104-2622-8-007-001).References
- T. F. Degnan Jr, C. M. Smith and C. R. Venkat, Appl. Catal., A, 2001, 221, 283–294 CrossRef.
- Y. Jia, J. Wang, K. Zhang, W. Feng, S. Liu, C. Ding and P. Liu, J. Energy Chem., 2017, 26, 540–548 CrossRef.
- J. Zhang, X. Zhu, S. Zhang, M. Cheng, M. Yu, G. Wang and C. Li, Catal. Sci. Technol., 2019, 9, 316–326 RSC.
- Y. Inoue, K. Nakashiro and Y. Ono, Microporous Mater., 1995, 4, 379–383 CrossRef CAS.
- J. A. Lopez-Sanchez, M. Conte, P. Landon, W. Zhou, J. K. Bartley, S. H. Taylor, A. F. Carley, C. J. Kiely, K. Khalid and G. J. Hutchings, Catal. Lett., 2012, 142, 1049–1056 CrossRef CAS.
- J. Li, C. Hu, K. Tong, H. Xiang, Z. Zhu and Z. Hu, RSC Adv., 2014, 4, 44377–44385 RSC.
- Z. Zhang, B. Liu, F. Liu, Y. Zhao and T. Xiao, Catal. Today, 2018, 317, 21–28 CrossRef CAS.
- X. Wang, J. Zhang, T. Zhang, H. Xiao, F. Song, Y. Han and Y. Tan, RSC Adv., 2016, 6, 23428–23437 RSC.
- Y. Zhang, Y. Qu, D. Wang, X. C. Zeng and J. Wang, Ind. Eng. Chem. Res., 2017, 56, 12508–12519 CrossRef CAS.
- C. Xu, B. Jiang, Z. Liao, J. Wang, Z. Huang and Y. Yang, RSC Adv., 2017, 7, 10729–10736 RSC.
- M. Conte, J. A. Lopez-Sanchez, Q. He, D. J. Morgan, Y. Ryabenkova, J. K. Bartley, A. F. Carley, S. H. Taylor, C. J. Kiely and K. Khalid, Catal. Sci. Technol., 2012, 2, 105–112 RSC.
- D. Pan, X. Song, X. Yang, L. Gao, R. Wei, J. Zhang and G. Xiao, Appl. Catal., A, 2018, 557, 15–24 CrossRef CAS.
- J. Li, K. Tong, Z. Xi, Y. Yuan, Z. Hu and Z. Zhu, Catal. Sci. Technol., 2016, 6, 4802–4813 RSC.
- Q. Hu, X. Huang, Y. Cui, T. Luo, X. Tang, T. Wang, W. Qian and F. Wei, RSC Adv., 2017, 7, 28940–28944 RSC.
- L. Sun, Y. Wang, H. Chen, C. Sun, F. Meng, F. Gao and X. Wang, Catal. Today, 2018, 316, 91–98 CrossRef CAS.
- J. Li, Y. Wang, W. Jia, Z. Xi, H. Chen, Z. Zhu and Z. Hu, J. Energy Chem., 2014, 23, 771–780 CrossRef.
- A. F. Silva, A. Fernandes, P. Neves, M. M. Antunes, S. M. Rocha, M. F. Ribeiro, C. M. Silva and A. A. Valente, ChemCatChem, 2018, 10, 2741–2754 CrossRef CAS.
- Y. Jia, J. Wang, K. Zhang, W. Feng, S. Liu, C. Ding and P. Liu, Microporous Mesoporous Mater., 2017, 247, 103–115 CrossRef CAS.
- M. Bjørgen, F. Joensen, M. S. Holm, U. Olsbye, K.-P. Lillerud and S. Svelle, Appl. Catal., A, 2008, 345, 43–50 CrossRef.
- T. Fu, H. Zhou and Z. Li, Catal. Lett., 2016, 146, 1973–1983 CrossRef CAS.
- G. Q. Zhang, T. Bai, T. F. Chen, W. T. Fan and X. Zhang, Ind. Eng. Chem. Res., 2014, 53, 14932–14940 CrossRef CAS.
- S.-H. Zhang, Z.-X. Gao, S.-J. Qing, S.-Y. Liu and Y. Qiao, Chem. Pap., 2014, 68, 1187–1193 CAS.
- J.-y. WANG, W.-h. LI and J.-x. HU, J. Fuel Chem. Technol., 2009, 37, 607–612 CAS.
- Y. Bi, Y. Wang, X. Chen, Z. Yu and L. Xu, Chin. J. Catal., 2014, 35, 1740–1751 CrossRef CAS.
- X. Niu, J. Gao, Q. Miao, M. Dong, G. Wang, W. Fan, Z. Qin and J. Wang, Microporous Mesoporous Mater., 2014, 197, 252–261 CrossRef CAS.
Footnote |
| † Electronic supplementary information (ESI) available. See DOI: 10.1039/c9ra03723c |
| This journal is © The Royal Society of Chemistry 2019 |