DOI:
10.1039/C9RA03600H
(Paper)
RSC Adv., 2019,
9, 21444-21450
Facile thermochemical conversion of FeOOH nanorods to ZnFe2O4 nanorods for high-rate lithium storage
Received
13th May 2019
, Accepted 2nd July 2019
First published on 9th July 2019
Abstract
We successfully prepared ZnFe2O4 nanorods (ZFO-NRs) by a simple thermochemical reaction of FeOOH nanorods with Zn(NO3)2 to use as an anode material in lithium-ion batteries. The FeOOH nanorod shape was well maintained after conversion into ZFO-NR with the formation of porous structures. The nanorod structure and porous morphology facilitate Li+ transport, improve the reaction rates owing to the larger contact area with the electrolyte, and reduce the mechanical stress during lithiation/delithiation. The ZFO-NR electrode exhibited a reversible capacity of 725 mA h g−1 at 1 A g−1 and maintained a capacity of 668 mA h g−1 at 2 A g−1; these capacities are much higher and more stable than those of ZFO nanoparticles prepared by a hydrothermal method (ZFO-HT) (216 and 117 mA h g−1 at 1 and 2 A g−1, respectively). Although ZFO-NRs exhibited high, stable capacities at moderate current densities for charging and discharging, the capacity rapidly decreased under fast charging/discharging conditions (>4 A g−1). However, carbonized ZFO-NR (C/ZFO-NR) exhibited an improved reversible capacity and rate capability resulting from an increased conductivity compared with ZFO-NRs. The specific capacity of C/ZFO-NRs at 1 A g−1 was 765 mA h g−1; notably, a capacity of 680 mA h g−1 was maintained at 6 A g−1.
Introduction
Transition metal oxides are promising anode materials for lithium-ion (Li-ion) batteries owing to their high theoretical specific capacities, low cost, and environmental friendliness.1,2 In recent years, ternary transition metal oxides (TMO) are emerging as promising anode materials due to their higher electrochemical activities and better electronic conductivity, which are controlled by the chemical compositions.3–5 TMO spinels (AB2O4) with two transition metals provide the feasibility to tune the energy density and working voltage by varying the transition metal content. In particular, ZnFe2O4 (denoted as ZFO), where divalent (Zn2+) ions and trivalent (Fe3+) ions occupy A and B sites, is environmental friendly and cheap, and it possesses a lower working voltage (∼1.5 V) for lithium extraction. And ZFO has a high theoretical specific capacity (∼1000 mA h g−1) by both the conversion and the alloying/dealloying reaction for reversible lithium storage.6–10 However, despite its excellent properties, ZFO has been limited in practical applications because of its rapid capacity decay over cycling caused by pulverization during the charge/discharge of lithium ions and the low capacity at high charge/discharge rates caused by poor electrical conductivity.11 In order to inhibit leakages of ZFO, nanostructure formation (i.e., tubes, rods, wires, and sheets) and hybridization with carbonaceous materials (i.e., porous carbon, carbon nanotubes, carbon nanofibers, and graphene) have been attempted. Nanostructures reduce mechanical stress during lithiation/delithiation, enable rapid charging and discharging by reducing the transport length of electrons and lithium ions, and improve reaction rates owing to their higher electrode/electrolyte contact area.6–15 Moreover, hybridization with carbonaceous materials improves the conductivity and rate capability of the electrode.11,15–18 Carbonization of ZFO has been reported in numerous articles; however, reports of ZFO nanorods (ZFO-NRs) for Li-ion batteries are limited. Only a few studies on the production of ZFO by electrospinning and thermal decomposition have been reported.19,20
In this study, FeOOH nanorods, which can be easily synthesized using a hydrothermal method, were used as a precursor material to produce ZFO-NRs. FeOOH was converted into ZFO through a thermochemical reaction with Zn ions, and the nanorod structure of FeOOH was well maintained after conversion into ZFO. The electrochemical properties of the ZFO-NRs were compared with those of the ZFO particles prepared by the hydrothermal method. We also attempted to improve the conductivity and rate capability of the ZFO-NRs via carbonization.
Experimental section
Preparation of electrodes
In this study, all chemicals were used without further purification. First, FeOOH nanorods were synthesized using a hydrothermal method. Here 0.04 mol FeCl3·6H2O and 0.04 mol urea were dissolved in 40 mL of distilled water and stirred for 30 min, and then the solution was transferred to a Teflon-lined autoclave reactor and maintained at 90 °C for 8 h. The precipitated powders were then filtered, washed with ethanol and distilled water, and dried at 60 °C for 24 h. ZFO-NRs were prepared by a thermochemical reaction of FeOOH with a Zn(NO3)2 solution. FeOOH nanorods (0.2 g) were dispersed in 10 mL of a 0.5 M Zn(NO3)2 aqueous solution, which was then stirred for 1 h. The resulting slurry was transferred to a furnace and annealed in air at 550 °C for 3 h after the application of a ramp rate of 2 °C min−1. The ratio of FeOOH and Zn(NO3)2 is optimized to obtain a pure ZFO without the formation of ZnO or Fe2O3 impurity.
In order to prepare carbonized ZFO-NR (C/ZFO-NR), the as-prepared ZFO-NR was immersed in a 20 mM glucose solution for one day and dried at 100 °C for 1 h. The glucose-adsorbed ZFO-NR was heated in a N2 atmosphere at 500 °C for 3 h (heating rate: 2 °C min−1). For comparison, ZFO particles were also prepared using a hydrothermal method (ZFO-HT). First, 5 mmol Zn(NO3)2 and 10 mmol Fe(NO3)2 were dissolved in 40 mL of distilled water, and then 15 mL of concentrated NaOH was added to the formal solution. The resulting solution was transferred to a Teflon-lined autoclave reactor and maintained at 180 °C for 12 h. The collected precipitate was washed with distilled water and ethanol and dried at 60 °C for 24 h.21 For the electrodes, a slurry was prepared by mixing synthesized samples, Super P conductive additive, and sodium carboxymethyl cellulose (CMC, 1.25 wt%) binder at a weight ratio of 75![[thin space (1/6-em)]](https://www.rsc.org/images/entities/char_2009.gif) :20:5 with water as a solvent. The mixture was then subjected to ball milling for 24 h at 100 rpm.21 The prepared slurry was coated on copper foil and dried at 70 °C in a vacuum oven for 12 h to remove moisture. Then, the slurry was pressed to a final thickness of 50–60 μm and cut into 14 mm diameter sections.
:20:5 with water as a solvent. The mixture was then subjected to ball milling for 24 h at 100 rpm.21 The prepared slurry was coated on copper foil and dried at 70 °C in a vacuum oven for 12 h to remove moisture. Then, the slurry was pressed to a final thickness of 50–60 μm and cut into 14 mm diameter sections.
Characterization
The crystal structures of the synthesized samples were studied by X-ray diffraction (XRD) analysis using an Empyrean X-ray diffractometer with Cu Kα radiation (2θ: 10–80°). A Raman spectrometer (NRS-5100, JASCO) was employed to analyze the carbon phase on ZFO using the 532 nm, laser line as the excitation source. Thermogravimetric analysis (TGA) was performed on the composites using a TGA 7 (PERKIN-ELMER) to measure the carbon content. Scanning electron microscopy (SEM) images of the samples were obtained using an FE-SEM system (S-4800; Hitachi) operating at 3 keV. An FE-TEM (HF-3300; Hitachi) was used to study the morphology and nanostructure of the composites, and electrochemical tests were performed using CR2032 coin cells. The cells were assembled in an Ar-filled glovebox with Li foil as the counter electrode, 1 M LiPF6 in ethylene carbonate (EC)/dimethyl carbonate (DMC) (3:7 by volume) as the electrolyte, and a polypropylene membrane as the separator. Charge/discharge tests were 3.00 V. Electrochemical impedance spectroscopy (EIS) was performed over a frequency range of 0.1 Hz to 1.0 MHz using an electrochemical impedance analyzer (ZIVE SP1, WonATech).
Results and discussion
The prepared samples (FeOOH, ZFO-NR, C/ZFO-NR, and ZFO-HT) were characterized using XRD and SEM. Fig. 1(a) presents the XRD patterns of the samples. All of the peaks for FeOOH were well matched to the standard β-FeOOH diffraction peaks (JCPDS file no. 34-1266). The XRD peaks of ZFO, which was produced by a thermochemical reaction of FeOOH with Zn ions, containing trace amounts of ZnO (JCPDS file no. 36-1451); however, overall, the peaks coincide well with the standard ZFO peaks (JCPDS file no. 65-3111). The effect of trace amounts of ZnO in ZFO on the electrochemical properties is negligible, since its amount of ZnO is much lesser than that in the literatures which showed synergetic effects of composite of ZnO/ZFO.8,12,15,21 The ZFO-NR sample maintains the ZFO structure after carbonization. The XRD peaks shown in Fig. 1(a, iv) demonstrate that the ZFO-HT, which was prepared using a different than ZFO-NR, also exhibited a ZFO structure. The presence of carbon layer on ZFO-NR (C/ZFO-NR) was investigated by Raman spectroscopy and the results are shown in Fig. 1(b). C/ZFO-NR exhibits two peaks at around 1353 cm−1 (D band) and 1580 cm−1 (G band), which originated from the disordered and ordered graphitic carbons, respectively, whereas ZFO-NR did not show any peaks at this range.22 Therefore, the existence of carbon layer on ZFO-NR in C/ZFO-NR was confirmed by Raman spectra. On the other hand, the amounts of carbon in C/ZFO-NR was very small (∼0.1%) according to the TGA result, it indicates that most are ZFO-NR in C/ZFO-NR sample and the carbon is present in small amounts on the surface of ZFO-NR.23 The morphologies of the prepared samples were characterized using SEM. As shown in Fig. 2(a), the ZFO-HT formed microsized clusters of small ZFO particles (∼50 nm). FeOOH, which is a precursor of ZFO-NR, exhibited a nanorod structure [Fig. 2(b)]. ZFO-NR maintained the nanorod structure after the conversion from FeOOH by a thermochemical reaction with Zn ions, and this nanorod shape was still maintained after carbonization [Fig. 2(c) and (d)]. However, as shown in TEM [Fig. 2(b) and (c), inset], although the nanorod shape was maintained in the ZFO-NR sample, the interior of the FeOOH nanorod became porous after conversion into ZFO-NR.
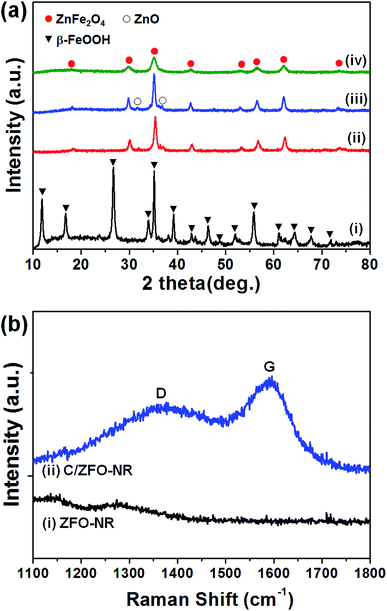 |
| | Fig. 1 (a) XRD patterns of (i) FeOOH, (ii) ZFO-NR, (iii) C/ZFO-NR, and (iv) ZFO-HT. The peaks corresponding to FeOOH, ZnFe2O4, and ZnO are labeled by a triangle, a filled circle, and an open circle, respectively. (b) Raman spectra of (i) ZFO-NR and (ii) C/ZFO-NR. | |
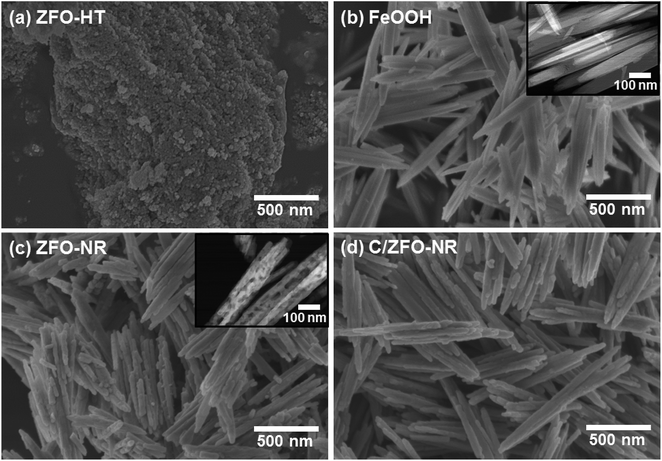 |
| | Fig. 2 SEM images of (a) ZFO-HT, (b) FeOOH, (c) ZFO-NR, and (d) C/ZFO-NR. Inset: TEM images of (b) FeOOH and (c) ZFO-NR. | |
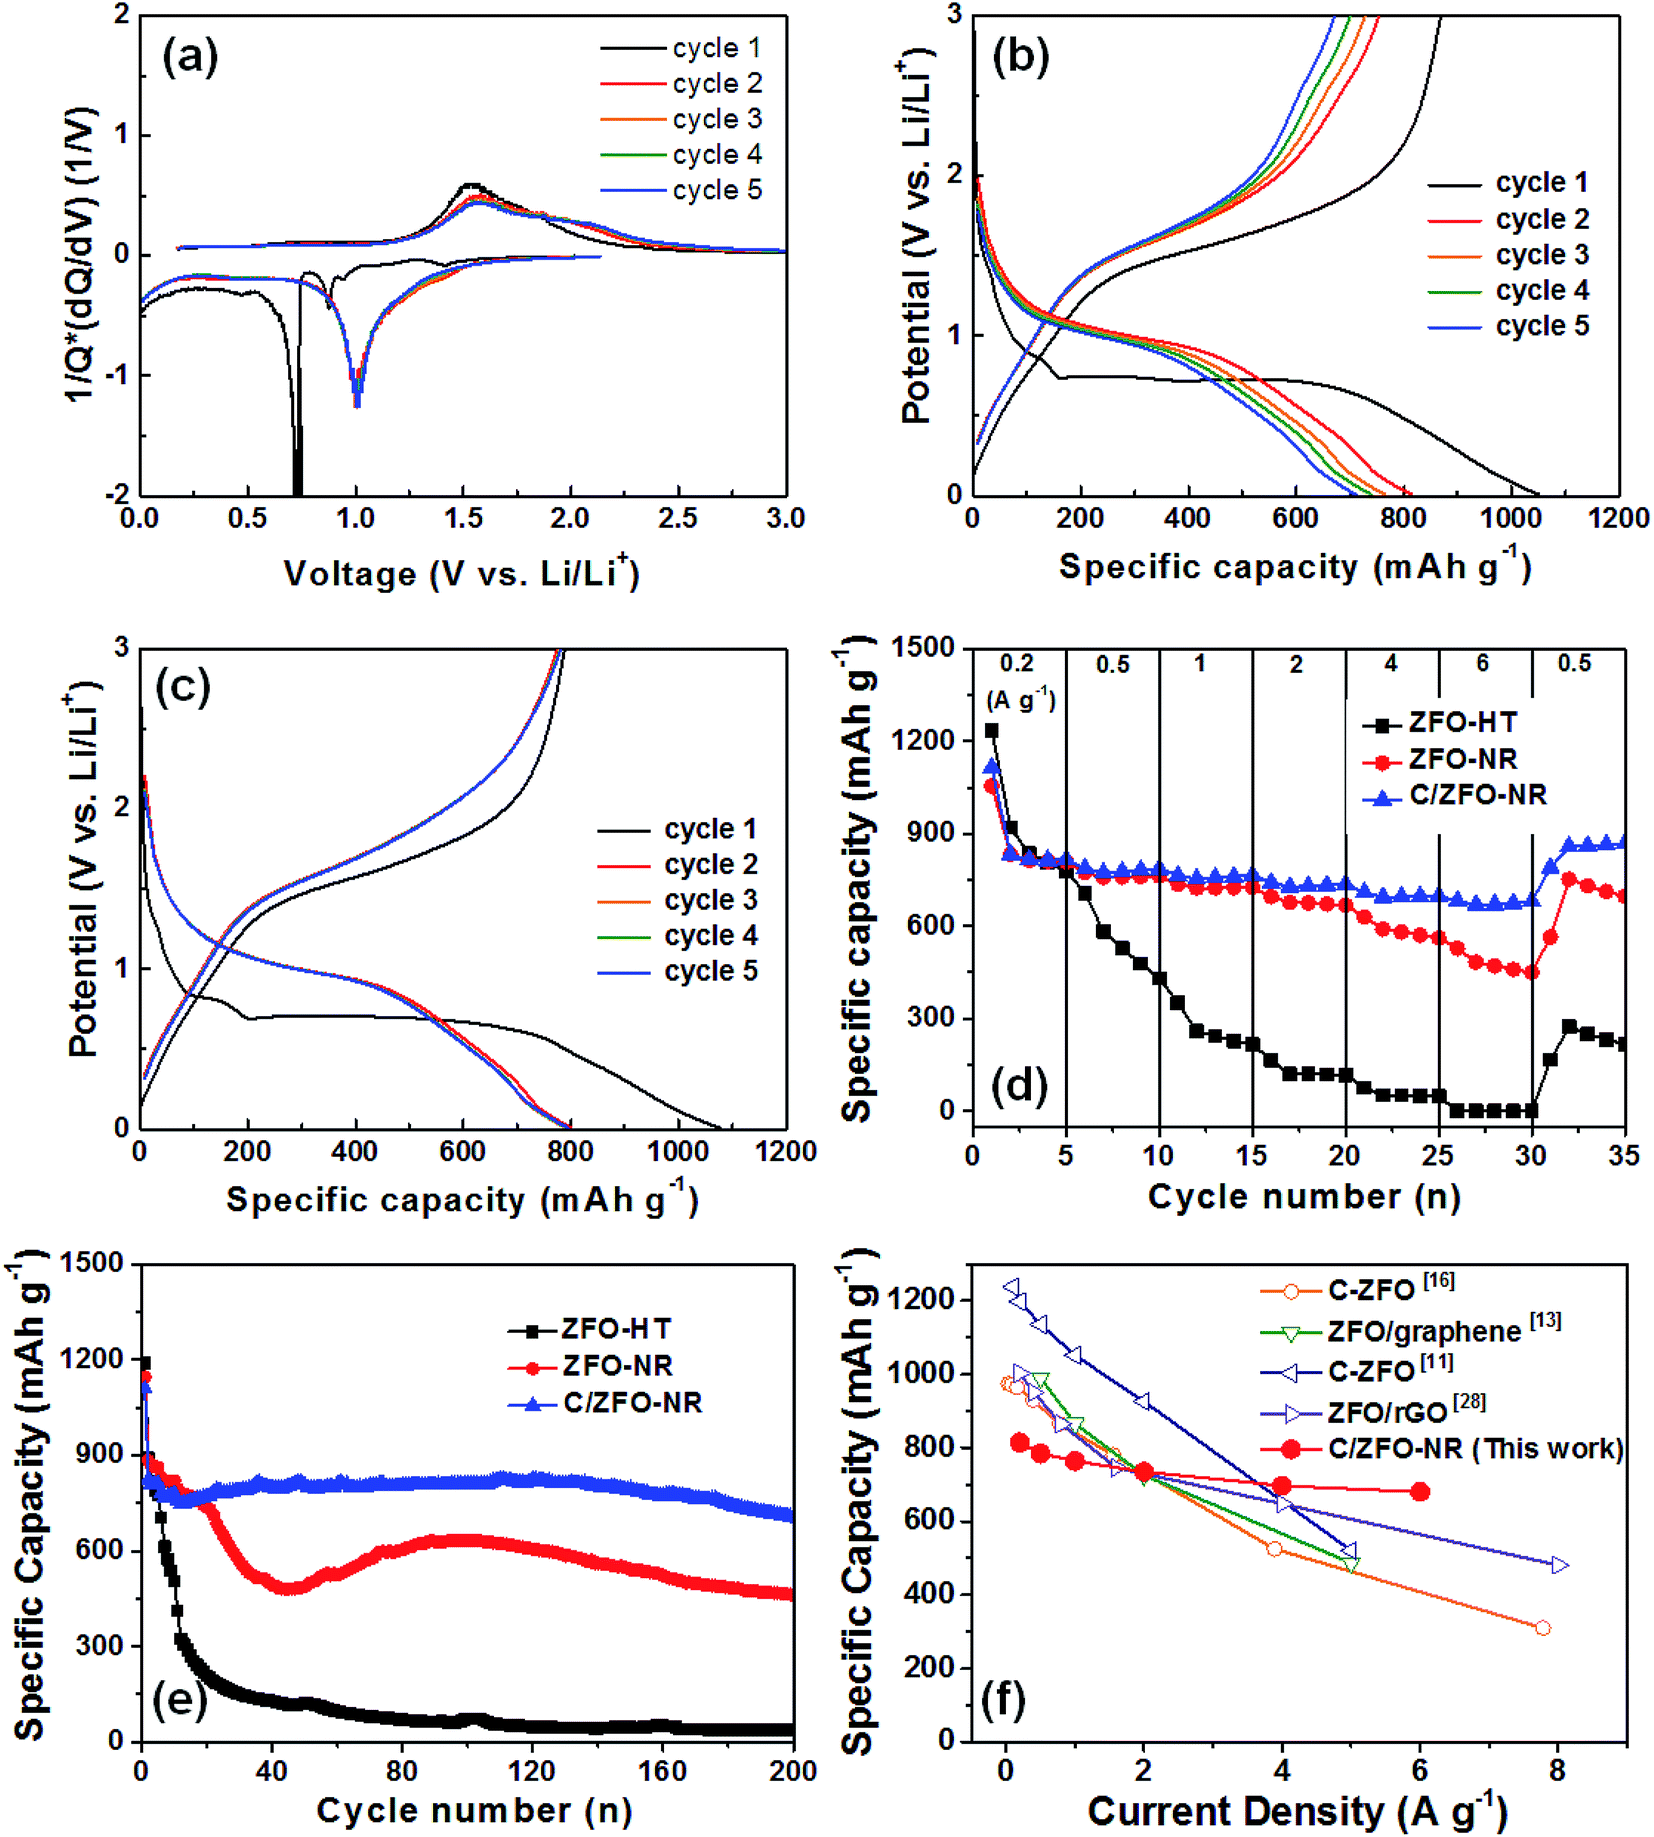
Fig. 3(a) shows the normalized differential capacity [1/Q(dQ/dV)] for ZFO-NR for the first five cycles. Exhibiting a plateau at approximately 0.75 V, the high capacity in the first cycle can be explained by the formation of a solid electrolyte interface (SEI), which consumes a large portion of the lithium ions.13 Plateaus were also observed at approximately 1.0 and 1.5 V, corresponding to the reversible redox reaction during lithium insertion/extraction in ZFO.14 Fig. 3(b) and (c) show initial discharge/charge curves for ZFO-NR and C/ZFO-NR, respectively, for the first five cycles at 1 A g−1 over a potential range of 0.01–3.00 V with Li foil as a counter electrode. The initial discharge capacity of ZFO-NR was 1050 mA h g−1, but gradual capacity decay was exhibited after the first cycle. This initial irreversible capacity loss was most likely caused by the formation of an SEI layer on the electrode surface during the first lithium insertion process.12,14 In contrast, the C/ZFO-NR electrode exhibited a very stable and high discharge capacity of ∼800 mA h g−1, except during the first cycle. Fig. 3(d) shows the cycling performance for different current densities (i.e., 0.2, 0.5, 1, 2, 4, and 6 A g−1). The ZFO-HT electrode exhibited rapid capacity degradation, with a specific capacity of 216 mA h g−1 at 1 A g−1. This capacity reduction can be explained by the poor structural stability due to the large volume change induced by the Li-ion insertion/extraction during cycling. Additionally, the low electrochemical conductivity of ZFO-HT caused the capacity to decrease with repeated cycling. The ZFO-NR electrode exhibited a high specific capacity of 725 mA h g−1 at 1 A g−1 and maintained a capacity of 668 mA h g−1 at 2 A g−1, but the capacity rapidly decreased under faster charge/discharge conditions (>4 A g−1). Compared to other electrodes, C/ZFO-NR exhibited a higher reversible capacity and rate capability. The specific capacity of C/ZFO-NR at 1 A g−1 was 765 mA h g−1; notably, the capacity remained at 680 mA h g−1 at 6 A g−1. The outstanding improvement in capacity and stability of this C/ZFO-NR electrode resulted from the high Li+ charge/discharge rate and high conductivity due to the nanorod structure and carbonaceous material. The capacity of C/ZFO-NR for the final five cycles at 0.5 A g−1 was fully recovered and was even higher than the capacity obtained in the previous cycles with 0.5 A g−1, indicating that the C/ZFO-NR electrodes are activated by the charge/discharge cycles. In order to evaluate their cyclic stability, the samples were further charged/discharged at a current rate of 1 A g−1 for 200 cycles, as shown in Fig. 3(e). The specific capacity of the ZFO-HT electrode drastically decreased with increasing cycle number due to the SEI instability and structural change of ZFO during lithium insertion/extraction. The specific capacity of ZFO-NR also decreased prior to 50 cycles; however, the capacity increased after approximately 50 cycles, recovering the initial capacity. This phenomenon appears to be due to the electrochemical reconstruction induced by the repeated Li ion insertion/extraction, as reported for transition-metal-oxide-based anodes.24–27 C/ZFO-NR exhibited a highly stable discharge capacity, with a value of 706 mA h g−1 after 200 cycles. The excellent stability and rate capability of C/ZFO-NR are compared with those of previously reported carbonaceous material–ZFO composites in Fig. 3(f).11,13,16,28 Although C/ZFO-NR did not exhibit the highest discharge capacity, the retention of the discharge capacity for various current densities was superior to that of other materials. C/ZFO-NR has the lowest capacity reduction rate with respect to the current density, owing to the stable structure and high charge/discharge rate of C/ZFO-NR.
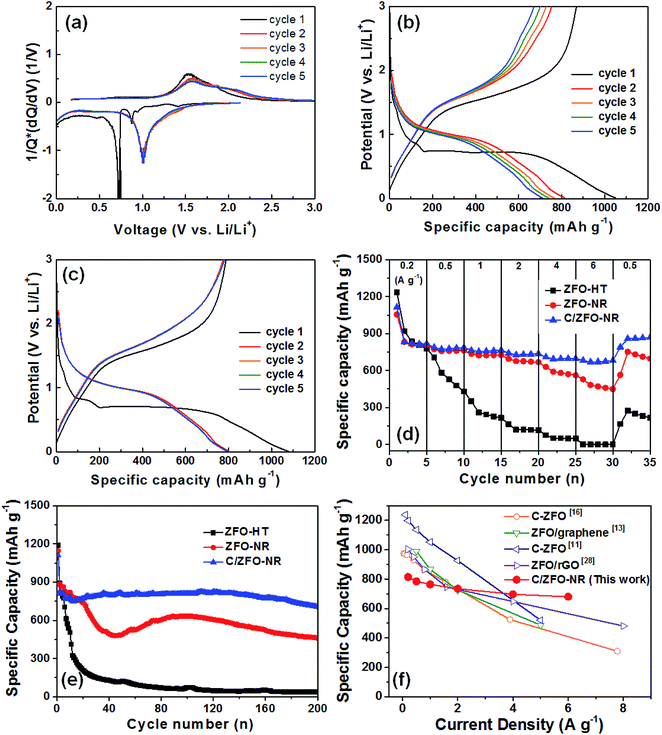 |
| | Fig. 3 (a) Normalized differential capacity plots of ZFO-NR and discharge/charge curves of (b) ZFO-NR and (c) C/ZFO-NR for the first five cycles at a current density of 1 A g−1. (d) Specific discharge capacities at various current densities (0.2–6.0 A g−1). (e) Cycling performance at a rate of 1 A g−1 for ZFO-HT, ZFO-NR, and C/ZFO-NR. (f) Rate capability for previously reported ZFO/carbon material composites and C/ZFO-NR. | |
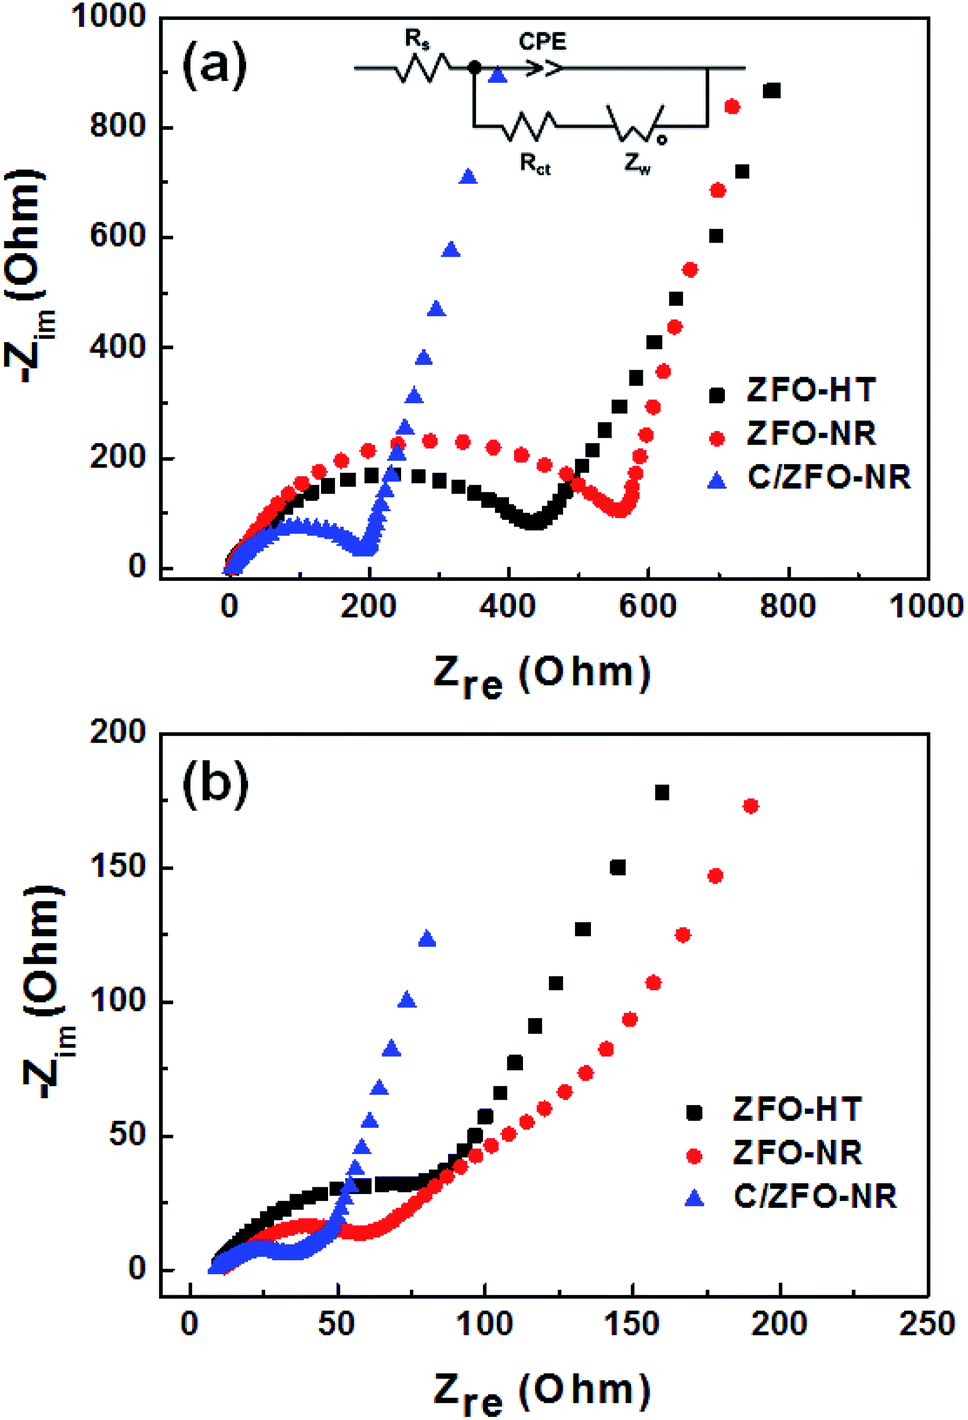
The EIS results for the electrodes are shown in Fig. 4(a). The impedance spectra consist of a high-frequency semicircle and a low-frequency tail, attributed to the electrode–electrolyte interfacial charge transfer impedance (Rct) and the diffusion-controlled Warburg impedance (ZW), respectively. The interfacial charge transfer impedance of C/ZFO-NR is approximately 126 Ω before cycling, which is smaller than that of ZFO-HT (248 Ω) and ZFO-NR (286 Ω), suggesting a more rapid charge transfer in C/ZFO-NR. In the low-frequency range, the larger slope of vertical straight lines for C/ZFO-NR and ZFO-NR compared with ZFO-HT indicates higher Li+ diffusion rates for the ZFO-NR samples, which results in an improved rate capability. Fig. 4(b) shows the EIS results for the ZFO electrodes after 200 cycles at a current density of 1 A g−1. Compared with that of the fresh cell, the Rct value of all electrodes decreases after cycling, primarily because of the lack of electrolyte wetting in the electrode materials before cycling. After the formation of the SEI film and activation during cycling, the resistance decreased substantially.29 Among the ZFO electrodes, C/ZFO-NR shows the lowest resistance (31 Ω) and ZFO-NR exhibits a lower resistance (47 Ω) than that of ZFO-HT (80 Ω), indicating the superiority of the ZFO-NR structure. Interestingly, the ZFO-NR show a higher Rct than ZFO-HT before cycling tests, however, Rct for the two samples is reversed after cycling tests. A lower Rct of ZFO-HT before cycling tests might be because that the spherical particles ZFO-HT have a smaller size than the rod-shaped ZFO-NR. As shown in Fig. 5, the small spherical ZFO-HT particles mix well with the conductive carbon and binder rather than rod-shaped ZFO-NR. Then, it makes the lithiation/delithiation of lithium ions easier resulting in a lower Rct. However, the ZFO-HT nanoparticles agglomerated after the repeated charge/discharge tests as shown in Fig. 5(d) and 6(a). After cycling, the battery was dissembled inside the glovebox and the electrode was washed with DMC for structural analysis. After cycling tests, the ZFO-HT electrode exhibited an increased particle size due to the alloying/dealloying and conversion reaction during the charge/discharge process (Fig. 5(d) and 6(a)).20 The alloying/dealloying and conversion reaction induce the change of composition and structure of active material, therefore, it could easily make the agglomerates during the charge/discharge. Whereas the ZFO-NR did not show any significant agglomeration while the deconstruction of nanorods was observed. It appears that porous ZFO-NR is deformed and reconstructed by cleavage into nanoparticles during charging and discharging. The porous ZFO-NR structure provides sufficient space to buffer the volume expansion during lithiation/delithiation, allowing the porous nanoparticle cluster to be retained without aggregation, as observed for ZFO-HT. Although the nanorod structure is lost after cycling, these newly formed porous nanoparticle clusters provide an excellent rate capability by effectively allowing for lithiation/delithiation, even at high current densities. By repeating the lithiation/delithiation, the morphology of ZFO is changed and rearranged due to conversion reactions. This electrochemical reconstruction can provide a high reaction activity, electronic conductivity and stability, triggering improved performance.24–26 Furthermore, the carbon coating could prevent the additional agglomeration of ZFO particles in C/ZFO-NR electrode even with further charge/discharge cycles. The particle distribution after cycling can be more clearly confirmed by elemental analysis using TEM. As shown in Fig. 6, the particles of the ZFO-HT electrode aggregate to form a large lump after cycling, whereas the particles are well dispersed in the C/ZFO-NR electrode. The expected reconstruction process is shown in Scheme 1. This good dispersion of particles in the C/ZFO-NR electrode after cycling than that in the ZFO-HT electrode is attributed to the better rate capability of C/ZFO-NR by providing more reaction sites and improved conductivity and stability.
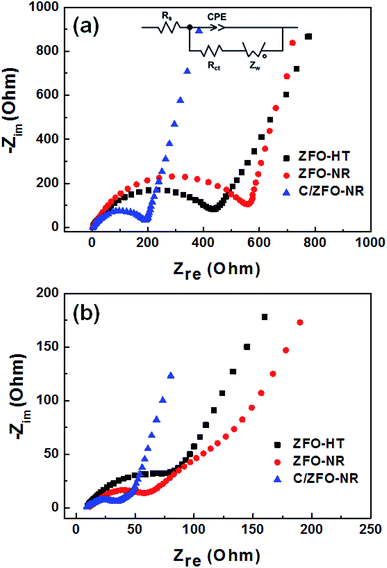 |
| | Fig. 4 EIS (Nyquist plot) of (a) fresh and (b) cycled ZFO-HT, ZFO-NR, and C/ZFO-NR electrodes (after cycling at 1 A g−1 for 200 cycles). | |
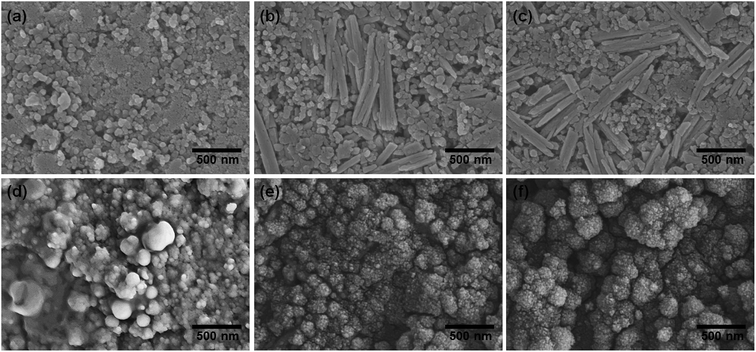 |
| | Fig. 5 SEM images of (a–c) fresh and (d–f) cycled ZFO-HT (a and d), ZFO-NR (b and e), and C/ZFO-NR (c and f) electrodes (after cycling at 1 A g−1 for 200 cycles). | |
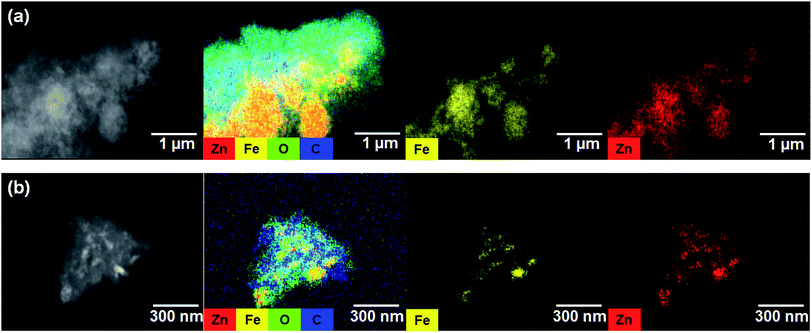 |
| | Fig. 6 TEM-EDX mapping images of (a) ZFO-HT and (b) C/ZFO-NR electrodes after 200 charge/discharge cycles at 1 A g−1. | |
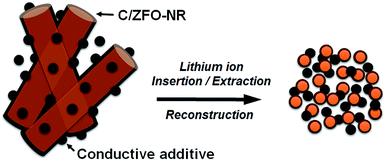 |
| | Scheme 1 Schematic of electrochemical reconstruction for the C/ZFO-NR. | |
Conclusions
In summary, in this study, ZFO-NR samples have been successfully synthesized by a simple thermochemical reaction of FeOOH nanorods with a Zn(NO3)2 solution. Owing to the advantageous features of the nanorod structure and carbonization, C/ZFO-NR demonstrates a high capacity of 706 mA h g−1 after 200 cycles at 1 A g−1 and an excellent rate capability, with a value of 680 mA h g−1 at 6 A g−1. The superior electrochemical performance of C/ZFO-NR can be ascribed to the porous ZFO-NR structure and high conductivity caused by carbonization. The porous ZFO-NR structure provides sufficient space to buffer the volume expansion during lithiation/delithiation, allowing the porous nanoparticle cluster to be retained without aggregation, as observed for ZFO-HT. Moreover, carbonization provides a conductive pathway for electron transport, resulting in an improved rate capability for ZFO-NR.
Conflicts of interest
There are no conflicts to declare.
Acknowledgements
This work was supported by the National Research Foundation of Korea (NRF) grant (No. 2017R1C1B2011147) and the Korea Institute of Energy Technology Evaluation and Planning (KETEP) and the Ministry of Trade, Industry & Energy (MOTIE) of the Republic of Korea (No. 20174010201460), and Kyungpook National University Fund, 2018.
References
- P. Poizot, S. Laruelle, S. Grugeon, L. Dupont and J. M. Tarascon, Nature, 2000, 407, 496–499 CrossRef CAS.
- L. Zhang, H. B. Wu and X. W. Lou, Adv. Energy Mater., 2014, 4, 1300958 CrossRef.
- M. V. Reddy, G. V. S. Rao and B. V. R. Chowdari, Chem. Rev., 2013, 113, 5364–5457 CrossRef CAS.
- S. Ni, J. Liu, D. Chao and L. Mai, Adv. Energy Mater., 2019, 9, 1803324 CrossRef.
- R. Wu, X. Qian, K. Zhou, J. Wei, J. Lou and P. M. Ajayan, ACS Nano, 2014, 8, 6297–6303 CrossRef CAS.
- Y. Ding, Y. Yang and H. Shao, Electrochim. Acta, 2011, 56, 9433–9438 CrossRef CAS.
- X. Guo, X. Lu, X. Fang, Y. Mao, Z. Wang, L. Chen, X. Xu, H. Yang and Y. Liu, Electrochem. Commun., 2010, 12, 847–851 CrossRef CAS.
- P. Pan, T. Wang, L. Chen, F. Wang, X. Yang, C. Qin and Y. Ding, RSC Adv., 2018, 8, 16187–16192 RSC.
- P. F. Teh, Y. Sharm, S. S. Pramana and M. Srinivasan, J. Mater. Chem., 2011, 21, 14999–15008 RSC.
- H. Xu, X. Chen, L. Chen, L. e. Li, L. Xu, J. Yang and Y. Qian, Int. J. Electrochem. Sci., 2012, 7, 7976–7983 CAS.
- B. Jiang, C. Han, B. Li, Y. He and Z. Lin, ACS Nano, 2016, 10, 2728–2735 CrossRef CAS.
- L. Hoe, L. Lian, L. Zhang, G. Pang, C. Yuan and X. Zhang, Adv. Funct. Mater., 2015, 25, 238–246 CrossRef.
- X. Yao, J. Kong, D. Zhou, C. Zhao, R. Zhou and X. Lu, Carbon, 2014, 79, 493–499 CrossRef CAS.
- X.-B. Zhong, B. Jin, Z.-Z. Yang, C. Wang and H.-Y. Wang, RSC Adv., 2014, 4, 55173–55178 RSC.
- F. Zou, X. Hu, Z. Li, L. Qie, C. Hu, R. Zeng, Y. Jiang and Y. Huang, Adv. Mater., 2014, 26, 6622–6628 CrossRef CAS PubMed.
- D. Bresser, E. Paillard, R. Kloepsch, S. Krueger, M. Fiedler, R. Schmitz, D. Baither, M. Winter and S. Passerini, Adv. Energy Mater., 2013, 3, 513–523 CrossRef CAS.
- Y. Deng, Q. Zhang, S. Tang, L. Zhang, S. Deng, Z. Shi and G. Chen, Chem. Commun., 2011, 47, 6828–6830 RSC.
- J. Sui, C. Zhang, D. Hong, J. Li, Q. Cheng, Z. Li and W. Cai, J. Mater. Chem., 2012, 22, 13674–13681 RSC.
- X.-B. Zhong, Z.-Z. Yang, H.-Y. Wang, B. J. Lun Lu, M. Zha and Q.-C. Jiang, J. Power Sources, 2016, 306, 718–723 CrossRef CAS.
- Y. Gao, L. Yin, S. J. Kim, H. Yang, I. Jeon, J.-P. Kim, S. Y. Jeong, H. W. Lee and C. R. Cho, Electrochim. Acta, 2019, 296, 565–574 CrossRef CAS.
- Y. Park, M. Oh and J. H. Kim, Energies, 2019, 12, 304 CrossRef CAS.
- Y. Park, S.-H. Kang and W. Choi, Phys. Chem. Chem. Phys., 2011, 13, 9425–9431 RSC.
- F. Zheng, Z. Wang, J. Chen and S. Li, RSC Adv., 2014, 4, 30605–30609 RSC.
- Y. Sun, X. Hu, F. Xia and Y. Huang, Adv. Funct. Mater., 2013, 23, 2436–2444 CrossRef CAS.
- Y. Jiang, X. Yan, P. Mei, Y. Zhang, W. Xiao and H. Tang, J. Alloys Compd., 2018, 764, 80–87 CrossRef CAS.
- S. Ni, B. Zheng, J. Liu, D. Chao, X. Yang, Z. Shen and J. Zhao, J. Mater. Chem. A, 2018, 6, 18821–18826 RSC.
- S. Ni, X. Lv, J. Ma, X. Yang and L. Zhang, J. Power Sources, 2014, 270, 564–568 CrossRef CAS.
- W. Yao, Z. Xu, X. Xu, Y. Xie, W. Qiu, J. Xu and D. Zhang, Electrochim. Acta, 2018, 292, 390–398 CrossRef CAS.
- X. Hou, Y. Hu, H. Jiang, Y. Li, W. Li and C. Li, J. Mater. Chem. A, 2015, 3, 9982–9988 RSC.
|
| This journal is © The Royal Society of Chemistry 2019 |
Click here to see how this site uses Cookies. View our privacy policy here. 
 Open Access Article
 This Open Access Article is licensed under a Creative Commons Attribution-Non Commercial 3.0 Unported Licence
 *a,
Misol Ohb,
Yebin Leea and
Hyunwoong Park
*a,
Misol Ohb,
Yebin Leea and
Hyunwoong Park