 Open Access Article
Pyrolysis-based separation mechanism for waste crystalline silicon photovoltaic modules by a two-stage heating treatment
Ruixue Wangab,
Erxiao Songab,
Chenglong Zhang *ab,
Xuning Zhuangab,
En Maab,
Jianfeng Baiab,
Wenyi Yuanab and
Jingwei Wangab
aResearch Center of Resource Recycling Science and Engineering, Shanghai Polytechnic University, No. 2360 Jinhai Road, Shanghai 201209, People's Republic of China. E-mail: chenglongzh@sina.com
bShanghai Collaborative Innovation Centre for Waste Electrical and Electronic Equipment Recycling, Shanghai Polytechnic University, No. 2360 Jinhai Road, Shanghai 201209, People's Republic of China
First published on 10th June 2019
Abstract
Heating treatment is the mainstream method to separate the modules in the waste photovoltaic (PV) module recycling process, which has not been studied thoroughly. In the present study, a two-stage heating treatment was conducted to separate the waste crystalline silicon solar panels. The TPT backing material could be recovered integrally by heating at 150 °C for 5 min, which was conducive to further recycling and regeneration. The poly(ethylene-co-vinyl) acetate (EVA) binder was removed by the pyrolysis process at the temperature of 500 °C; acetic acid and several hydrocarbon compounds were the main products of the pyrolysis process. Analysis showed that the pyrolysis of the EVA binder could be divided into two stages: deacetylation process (acetic acid formation) and long chain scission with radical reactions (hydrocarbon formation). Furthermore, the pyrolysis kinetics and pyrolysis mechanisms were studied based on the experimental data and sufficient theoretical foundation. Acetic acid was generated by the deacetylation process through a six-member cyclic transition state, and several hydrocarbon compounds were generated through a series of long chain scissions, free radical migrations and Diels–Alder cycloadditions. In this study, undamaged TPT backing materials, glass and silicon wafers were obtained, which could be recycled by further treatment. This study could perfect the process of waste crystalline silicon solar panel recycling and provide a fundamental basis for recycling the waste crystalline silicon solar panels in an environmentally friendly and efficient manner.
Introduction
Solar energy, especially the photovoltaic (PV) technology, currently holds a quite important position in the renewable energy market. The global demand for PV power has increased from 1 GW in 2004 to 57 GWs in 2015; the annual growth rate is more than 20%, which is much higher than that of any other industry, including other emerging renewable energy industries.1 Solar panels are expected to have a relatively long service life of about 25 years. However, a considerable number of the first batch of solar panels will be abandoned.2 With the growing number of PV installations, there will be a huge number of waste PV modules in the future. Predictions made using the available data show that the total amount of PV waste would reach 1![[thin space (1/6-em)]](https://www.rsc.org/images/entities/char_2009.gif) 957
957![[thin space (1/6-em)]](https://www.rsc.org/images/entities/char_2009.gif) 099 tons in 2038,3 due to which the end-of-life (EoL) PV management and recycling are becoming increasingly urgent.4,5 Moreover, EoL PV modules are officially regarded as waste electrical and electronic equipment (WEEE) by the European Union (EU) commission, which means that waste PV modules must be collected and recycled by appropriate ways.5–7 PV modules contain valuable materials such as silicon (Si), silver (Ag), aluminum (Al), copper (Cu), and gallium (Ga) and hazardous materials such as lead (Pb) and cadmium (Cd), which are harmful to humans.8,9 From the economic efficiency aspect, it is quite significant to recycle valuable materials, especially silicon, which can ensure the sustainability of the supply chain in the long term and reduce the energy payback time (EPBT).10,11 Moreover, from the environmental protection aspect, recycling EoL PV modules not only prevents the release of hazardous substances from the waste PV modules, but also reduces the CO2 emission and greenhouse-gas payback time related to the manufacture of PV modules.12–14
099 tons in 2038,3 due to which the end-of-life (EoL) PV management and recycling are becoming increasingly urgent.4,5 Moreover, EoL PV modules are officially regarded as waste electrical and electronic equipment (WEEE) by the European Union (EU) commission, which means that waste PV modules must be collected and recycled by appropriate ways.5–7 PV modules contain valuable materials such as silicon (Si), silver (Ag), aluminum (Al), copper (Cu), and gallium (Ga) and hazardous materials such as lead (Pb) and cadmium (Cd), which are harmful to humans.8,9 From the economic efficiency aspect, it is quite significant to recycle valuable materials, especially silicon, which can ensure the sustainability of the supply chain in the long term and reduce the energy payback time (EPBT).10,11 Moreover, from the environmental protection aspect, recycling EoL PV modules not only prevents the release of hazardous substances from the waste PV modules, but also reduces the CO2 emission and greenhouse-gas payback time related to the manufacture of PV modules.12–14
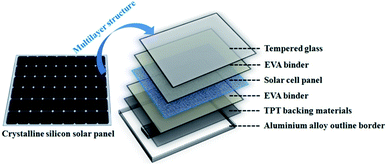
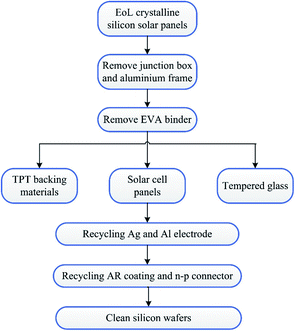
Crystalline silicon panels are the most widely used commercial solar panel materials and account for about 90% of the global PV market.1,15 As shown in Fig. 1, a typical crystalline silicon panel has a structure made of multilayer panels, which include an aluminium alloy outline border, a TPT backboard and a piece of tempered glass in the outer sphere. The inner layer comprises a silicon wafer as the core structure, which is fixed with a poly(ethylene-co-vinyl acetate) (EVA) binder layer. The mainstream recycling method of EoL crystalline silicon solar panels is shown in Fig. 2. It is known that silicon wafers are the most expensive materials in the PV modules and have drawn significant attention from research institutions.16 Reclaimed silicon wafers can be obtained from EoL PV modules as broken or unbroken wafers.11 The broken silicon wafers can be crushed into powder and used as raw materials for PV production. Moreover, it has been reported that the unbroken wafers are almost identical to commercial virgin wafers.6,7 So far, most research works have focused on the chemical leaching method to recycle clean silicon wafers by removing silver, aluminum, the anti-reflection (AR) coating and n–p connector.6,7,17–21 However, as shown in Fig. 2, in the silicon recycling process, the aluminium alloy outline border, the TPT backing materials, the junction box and the tempered glass should be removed from the crystalline silicon solar panel beforehand. The reason is that different materials are glued together, and this kind of sandwich structure would interfere with the silicon wafer recycling process. As a matter of fact, the aluminium alloy frame and the junction box can be artificially dismantled and are easy to recycle. However, the tempered glass, the solar cell panel, and the TPT backing materials are stuck together by the EVA binder, and such specific structure makes the separation and recycling processes quite difficult.
So far, physical separation, organic solvent etching and thermal treatment have been reported to separate the TPT backing materials, tempered glass and solar cell panels. Pablo Dias et al. separated the silicon-based PV modules by an electrostatic separator after mechanical milling; the results showed that the nonconductor fraction contained mostly polymers, the middling fraction contained mostly silicon, and the conductor fraction mostly contained glass.22 It was obvious that physical separation is relatively environmentally friendly and no harmful matter would be needed or generated. However, the silicon wafers were broken in the grinding process, which cannot be reused in the PV manufacturing process directly. Doi T. proposed an organic solvent method to recover silicon cells from conventional crystalline silicon, and the results showed that the silicon wafers could be recovered without any damage after immersing the modules in trichloroethylene at 80 °C for 10 days.23 This process has quite poor efficiency, and the solvent trichloroethylene is harmful to the environment and humans. Kim and Lee investigated an organic solvent-assisted ultrasonic method to improve the dissolution process of EVA in PV modules.24 The results showed that EVA could be completely dissolved in 3 M O-dichlorobenzene (O-DCB) at 70 °C and irradiation power of 900 W within 30 min; the PV cells could be recovered without any cracks in the solvent leaching process. This method could shorten the dissolution time of EVA; however, the ultrasonic treatment would add to the processing cost and also lead to an organic liquid waste problem.
Apart from physical separation and organic solvent etching, thermal treatment is mostly used to separate the sandwich structure of crystalline silicon panels and serves as the pretreatment method for recycling silicon wafers.8,9,25–28 Nochang Park et al. proposed an eco-friendly method to obtain the silicon wafers from PV modules by heating the samples to 480 °C first for module separation. However, the thermal treatment condition details and product analysis were not mentioned in their research.8,9 In Pablo Dias's study, the polymer of PV modules was characterized by Fourier transform infrared spectroscopy (FTIR), and the removal of the EVA resin by pyrolysis was studied.26 The results showed that >99% of the polymers from PV modules could be removed by pyrolysis. Nonetheless, the pyrolysis products and kinetic analysis were not studied in their research. As a matter of fact, the thermal treatment products should be analyzed. On the one hand, useful materials might be recycled and on the other hand, we must ensure that the products are harmless to the environment.
In the present study, a two-stage heating treatment was conducted to separate EoL crystalline silicon PV modules. The TPT backing materials could be recovered integrally by heating at a lower temperature, which was conducive to further recycling and regeneration. Then, the EVA binder was removed by the pyrolysis process. The pyrolysis products from the EVA binder were characterized, and the pyrolysis kinetics and pyrolysis mechanisms were studied based on the experimental data and sufficient theoretical foundation. Through the present process, undamaged TPT backing materials, glass and silicon wafers were obtained, which could be recycled by further treatment. The objective of this study was to perfect the process of waste crystalline silicon solar panel recycling and provide a fundamental basis as well as practical experience for recycling waste crystalline silicon solar panels in an environment friendly and efficient way.
Materials and methods
Waste PV modules containing polycrystalline silicon (160 × 320 mm) and monocrystalline silicon (190 × 250 mm) were used in this study. The aluminium alloy outline borders were removed from the waste crystalline silicon solar panels manually. The panels without outline borders were heated on an electric heating panel at low temperatures. When the EVA binder softened, the TPT backing materials could be integrally peeled off easily from the solar panels. Then, the crystalline silicon solar panels were heated in a tube furnace at different temperatures under nitrogen protection.The pyrolysis products were analyzed by pyrolysis-chromatograph-mass spectroscopy (PY-GC-MS, ISQ It, Agilent Technologies Corporation, U.S.). The pyrolysis temperature was set as 500 °C with nitrogen as the protective gas. GC was fitted with a DB-5 (30 m × 0.25 mm) column. Injection temperature: 280 °C, mass transfer line: 270 °C, and ion source temperature: 220 °C. The temperature program was set as follows: 60 °C (hold 5 min), 270 °C (rate 30 °C min−1; hold 10 min). The analysis was performed using 10 μL injections, and high purity helium was used as the carrier gas at a flow rate of 1.24 mL min−1. Mass spectroscopy was performed in the selected ion monitoring (SIM) mode at electron energy of 70 eV.
Thermogravimetric-Fourier transform infrared spectroscopy (TG-FTIR, TGA4000, FTIR spectrum two, PerkinElmer Corporation, U.S.) was used to study the pyrolysis mechanism and pyrolysis kinetics. High purity nitrogen was used as the protective gas at a flow rate of 20 mL min−1.
The kinetic analysis of the pyrolysis process was evaluated by eqn (1), which is presented as follows:
 | (1) |
 | (2) |
Eqn (1) can be transformed into eqn (3) as follows:
 | (3) |
 ,
,  ,
,  , eqn (3) can be transformed to eqn (4) as follows:
| Y = aX + b | (4) |
When n is assigned different values, eqn (4) can be fitted to a series of curves.
Results and discussion
TPT backing material removal and EVA binder pyrolysis
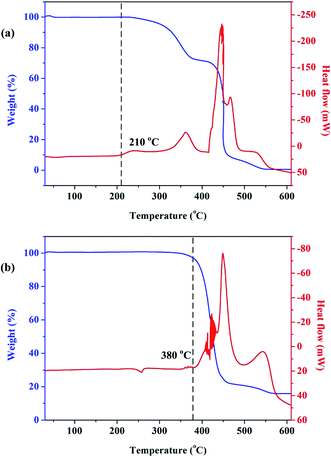
In the present study, thermogravimetric analysis-differential scanning calorimetry (TGA-DSC) was conducted for a better understanding of the characteristics of organic matters (mainly EVA binder and TPT backing materials) during thermal treatment under air condition. The samples were heated from 30 to 600 °C, and the heating rate was chosen as 10 °C min−1. The TGA-DSC curves are shown in Fig. 3. It can be concluded that the heating process of EVA and TPT was exothermic, and EVA began to lose weight at about 250 °C, while TPT began to lose weight at about 380 °C. Furthermore, it should be pointed out that there is an exothermic phenomenon without weight loss in the curve of EVA when the temperature reaches about 210 °C, which suggests that a melting or softening process occurred. Based on the TGA-DSC results, we considered low-temperature heating to separate the TPT backing materials from the solar panels. In the temperature range of 210–250 °C, EVA started to melt or soften, while TPT remained unchanged.In the present study, waste crystalline silicon solar panels were heated on an electric heating panel at low temperatures; it was observed that when heated at 150 °C for 5 min, the EVA binder softened and the TPT backing materials could be integrally peeled off easily from the solar panels, as shown in Fig. 4. As shown in Fig. 4(b), the TPT backing materials can be recovered integrally and in an unreacted state, which is conducive to further recycling and regeneration methods such as prilling and extrusion molding. More importantly, no harmful gas products were released from the heating system, which was environmentally friendly.
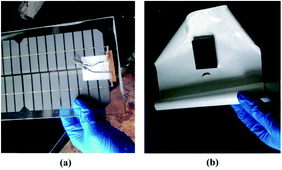 | ||
| Fig. 4 (a) Crystalline silicon solar panels after TPT backing materials were removed; (b) TPT backing materials. | ||
After the TPT backing materials were removed, the crystalline silicon solar panels were heated in a tube furnace at different temperatures for 1 h under nitrogen protection. The physical maps of the panels after the pyrolysis process under different temperatures are shown in Fig. 5. It is obvious that the organic binder can be removed completely when the temperature is above 450 °C and the removal rate can reach above 99 wt% at 500 °C. However, there were some dark colored viscous solids on the panels after the heating process when the temperature was below 450 °C. After the pyrolysis process, undamaged glass and silicon wafers were obtained, which could be recycled by further treatment.
Pyrolysis product analysis by PY-GC-MS
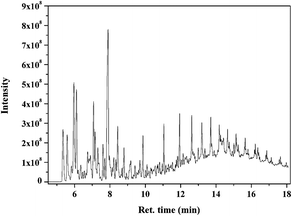
The thermal treatment has been reported in several studies as the pretreatment method to remove the EVA binder from waste PV modules8,9,26–28 and it has been proven to be a better method compared to artificial disassembly and organic solvent washing.29 However, the pyrolysis process is often overlooked during the recovery of whole PV modules; moreover, the pyrolysis products, reaction mechanisms and pyrolysis characteristics have not been studied in researches. In the present study, the EVA binder material obtained from the waste crystalline silicon solar panels was heated and identified by PY-GC-MS. The GC spectrogram at 500 °C is shown in Fig. 6, and the analysis results of the main products are shown in Table 1. It is obvious that the main reaction product is acetic acid, and small amounts of mono-olefins are generated in the pyrolysis process; moreover, traces of other low-molecular-weight organic compounds were detected in the pyrolysis products.| Peak | Ret. time (min) | Area (%) | Compound | Mol. weight |
|---|---|---|---|---|
| 1 | 5.34 | 3.51 | 2-Butene | 56 |
| 2 | 5.58 | 3.14 | 1-Pentene | 70 |
| 3 | 5.96 | 6.58 | 4-Penten-1-ol | 86 |
| 4 | 6.11 | 5.16 | 1-Hexene | 84 |
| 5 | 6.74 | 1.44 | 1,4-Hexadiene | 82 |
| 6 | 6.82 | 1.15 | 5-Hexen-1-ol | 82 |
| 7 | 6.89 | 1.58 | Methyl vinyl ketone | 70 |
| 8 | 7.07 | 3.84 | 1-Heptene | 98 |
| 9 | 7.16 | 2.7 | 2,4-Hexadiene | 82 |
| 10 | 7.32 | 2.07 | Benzene | 78 |
| 11 | 7.61 | 1.61 | 2-Methyl-1,4-hexadiene | 96 |
| 12 | 7.89 | 13.69 | Acetic acid | 60 |
| 13 | 8.22 | 1.06 | Pentanal | 86 |
| 14 | 8.44 | 2.96 | 1-Octene | 112 |
| 15 | 8.8 | 1.65 | Toluene | 92 |
| 16 | 9.18 | 1.54 | Cyclohexaneethanol | 128 |
| 17 | 9.7 | 0.94 | Hexanal | 100 |
| 18 | 9.87 | 1.91 | 1-Nonene | 126 |
| 19 | 11.05 | 1.73 | 1-Decene | 140 |
| 20 | 11.94 | 2.16 | 1-Undecene | 154 |
| 21 | 12.63 | 2.52 | 1-Tetradecene | 168 |
| 22 | 13.2 | 2.13 | 1-Tridecene | 182 |
| 23 | 13.7 | 2.24 | 1-Pentadecene | 210 |
| 24 | 14.18 | 1.5 | 1-Heptadecene | 238 |
| 25 | 14.25 | 1.15 | Dodecanal | 184 |
| 26 | 14.65 | 1.3 | 1-Nonadecene | 266 |
| 27 | 15.13 | 1.38 | 1-Heneicosene | 294 |
| 28 | 15.65 | 1.19 | 1-Docosene | 308 |
TG-FTIR analysis of the EVA binder pyrolysis process
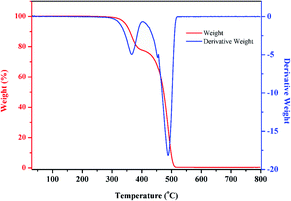
The EVA binder obtained from the waste crystalline silicon solar panels was analyzed by TG-FTIR under nitrogen atmosphere to get a better understanding of the pyrolysis process. The samples were heated from 30 to 800 °C at a heating rate of 10 °C min−1 and held for 10 min at 800 °C. When the samples started to decompose, the decomposition products were volatilized to the FTIR detection zone by a transfer line, which was preheated to 270 °C.The TG and DTG curves of the EVA binder are shown in Fig. 7, and several results can be obtained from the TGA-DTG curves: (i) there was nearly no weight loss below 300 °C. (ii) The pyrolysis of the EVA binder could be divided into two phases: the first phase was between 300 and 400 °C with a weight loss of 21.64% and reached the maximum weight loss rate at 366 °C. The second phase was between 400 and 515 °C with a weight loss of 77.21% and reached the maximum weight loss rate at 488 °C. (iii) There was nearly no weight loss above 515 °C. (iv) The total weight loss of the EVA binder was 99.635%, which meant that the EVA binder could be almost completely removed by the pyrolysis process.
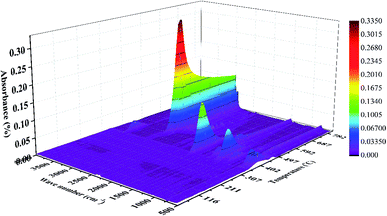
The TG-FTIR three-dimensional (3D) plot of the EVA binder visually reflects the reaction characteristics and is shown in Fig. 8. It is obvious that there were few absorption peaks when the temperature was below 300 °C. Besides, a strong absorption peak at around 1800 cm−1, a weak peak at around 3600 cm−1, and some weak peaks in the low-wavenumber zone began at 310 °C, reached their peaks at 380 °C and disappeared at about 450 °C. Furthermore, the strongest absorption peak at around 2900 cm−1 began at about 410 °C, reached its peak at about 480 °C and leveled off when the temperature was above 550 °C. These FTIR characteristics indicated two reaction stages in the thermal treatment process, which might correspond to the TGA-DTG results.
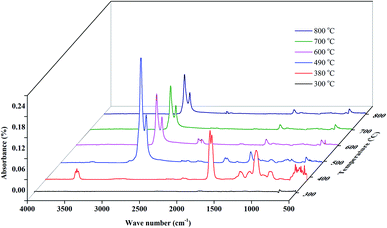
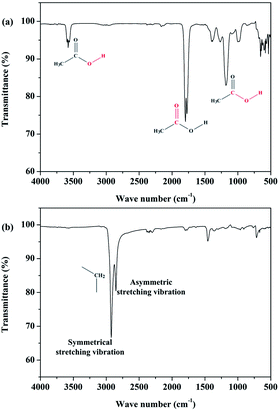
The FTIR spectrograms of the EVA binder at different representative temperatures (shown in Fig. 9) were analyzed in the present study to obtain a deeper insight into the EVA binder pyrolysis process. It is obvious that there is nearly no infrared absorption when the temperature is 300 °C. When the temperature is 380 °C, there is a strong absorption peak at around 1800 cm−1, which can be attributed to the typical absorption of the carbon–oxygen double bond. Besides, a weak absorption peak around 3600 cm−1 was assigned to the stretching vibration of the hydrogen–oxygen bond, and several moderate absorptions around 1100 cm−1 were due to the stretching vibration of the carbon-hydroxy bond and the in(out)-plane flexural vibration of the carbon–oxygen–hydrogen bond. Based on the results of PY-GC-MS (Table 1), the functional groups discussed above can be deemed to arise from acetic acid. The infrared absorptions and the corresponding functional groups are shown in Fig. 10(a).
As shown in Fig. 9, when the temperature reaches about 490 °C, the infrared absorptions of acetic acid disappear and some quite strong absorptions around 2900 cm−1 arise in the FTIR spectrogram. To be specific, as shown in Fig. 10(b), the strong peak at 2923 cm−1 is attributed to the symmetrical stretching vibration of the carbon–hydrogen bond, which originates from saturated methylene; the moderate-intensity peak at 2853 cm−1 is assigned to the asymmetric stretching vibration of the carbon–hydrogen bond, which also originates from saturated methylene. By referring to the results of PY-GC-MS (Table 1), the functional groups discussed above can be deemed to arise from the series of mono-olefins. As a matter of fact, the mono-olefins generated in the EVA binder pyrolysis process have long carbon chains, which means that the unsaturated carbon–hydrogen bonds are much fewer than the saturated carbon–hydrogen bonds, and such molecular structural characteristics make the infrared absorption of the unsaturated carbon–hydrogen bond indistinctive.
Several results could be concluded from the TG-FTIR analysis: (i) a conspicuous decomposition phenomenon begins from 310 °C. (ii) Acetic acid is the main product at the temperature range of 310–450 °C. (iii) Several olefins are generated when the temperature is above 410 °C. (iv) However, the temperature range of the FTIR results has a hysteresis effect compared with that of the TG-DTG results, and the reason might be the transfer line between the TG analyzer and the FTIR spectrometer, which exhibits a temperature difference between the TG system and the FTIR detection zone.
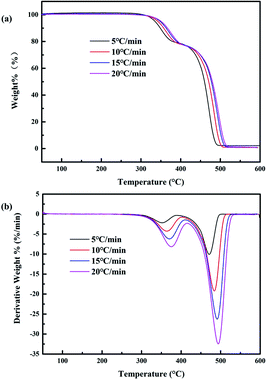
Thermokinetic analysis
The TG and DTG analyses of the EVA binder from waste crystalline silicon solar panels at different heating rates were conducted, and the results are shown in Fig. 11. It can be observed that the shift of the peak to high temperatures and the spread of the main reaction with the heating rate increase. This is because when the heating rate is low, temperature differences and temperature gradients increase in combination with a serious effect of thermal lag between the test point and specimen and the outer layer and inside of the specimen. However, a low heating rate helps reduce the above phenomena.Kinetic analysis was conducted for a better understanding of the EVA binder pyrolysis process. As pyrolysis can be divided into two stages, which are acetic acid generation and hydrocarbon generation, the fitted curves at the low-temperature zone (acetic acid generation) and the high-temperature zone (hydrocarbon generation) were expressed as different graphs. The fitted curves at different heating rates are shown in Fig. 12 and 13.
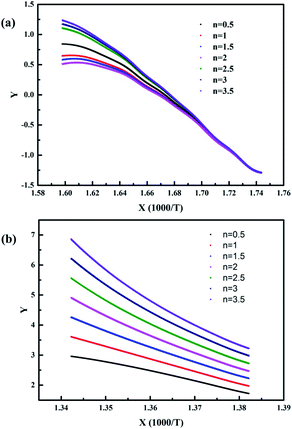 | ||
| Fig. 12 The kinetic analysis fitted curves of the pyrolysis process at the (a) low-temperature zone and (b) high-temperature zone when the heating rate is 5 °C min−1. | ||
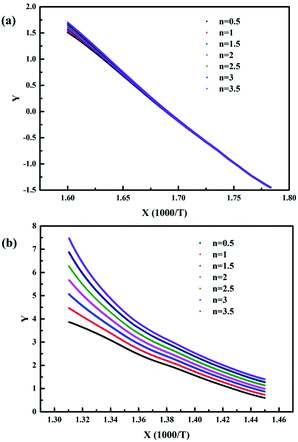 | ||
| Fig. 13 The kinetic analysis fitted curves of the pyrolysis process at the (a) low-temperature zone and (b) high-temperature zone when the heating rate is 15 °C min−1. | ||
When the heating rate was 5 °C min−1, as shown in Fig. 12, it was obvious that the fitting degree was best when n = 3.5 in the low-temperature zone and n = 1 in the high-temperature zone. In contrast, when the heating rate was 15 °C min−1, as shown in Fig. 13, the fitting degree was best when n = 0.5 in the low-temperature zone and n = 0.5 in the high-temperature zone. Furthermore, the temperature (T) and the conversion ratio (α) were used to evaluate the apparent activation energy (Ea) and pre-exponential factor (A) according to eqn (4), respectively. The kinetic parameters of the pyrolysis process of the EVA binder are shown in Table 2. The results indicated that the apparent activation energy in the high-temperature zone was much higher than that in the low-temperature zone, which meant that long chain scission is much more difficult than the deacetylation process. Besides, the apparent activation energy at the heating rate of 5 °C min−1 was much higher than that at 15 °C min−1, which indicated that a higher heating rate could promote the pyrolysis process.
| β (°C min−1) | Temperature (°C) | n | Ea (kJ mol−1) | ln![[thin space (1/6-em)]](https://www.rsc.org/images/entities/char_2009.gif) A A |
|---|---|---|---|---|
| 5 | <400 | 3.5 | 155.0488 | 32.83 |
| 5 | >400 | 1 | 344.9603 | 60.91 |
| 15 | <400 | 0.5 | 138.4863 | 30.87 |
| 15 | >400 | 0.5 | 200.2464 | 38.04 |
Reaction mechanism analysis of the EVA binder pyrolysis process
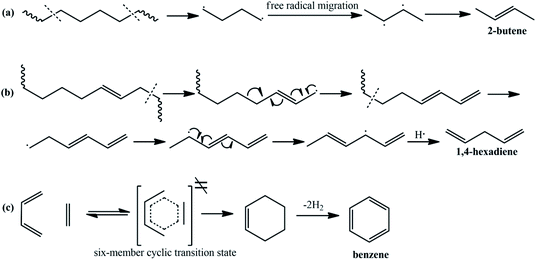
It can be concluded from the above analysis that the pyrolysis process of the EVA binder can be divided into two stages: the deacetylation process, which can generate acetic acid, and the long chain scission process, which can generate a series of hydrocarbon compounds. In the present study, the reaction mechanisms of the pyrolysis process were proposed. The reaction mechanism of acetic acid generation is shown in Fig. 14. As the EVA binder is a copolymer of ethylene (E) and vinyl acetate (VA), some carbethoxy groups are linked to the carbon atoms in the backbone. As shown in Fig. 14, β-H moves close to the carbonyl oxygen atom due to the hydrogen-bond interaction and then, the carbon–oxygen bond at the α position is gradually ruptured, while the bond between β-H and the carbonyl oxygen is gradually formed. Meanwhile, a six-member cyclic transition state (TS) was formed though intramolecular electron transfer. However, the transition state was extremely unstable and decomposed into acetic acid and a carbon–carbon double bond in a very short time.The mechanisms for the generation of several typical hydrocarbon compounds were proposed, as shown in Fig. 15. 2-Butene and 1,4-hexadiene are generated through long chain scission, free radical migrations, intramolecular electron transfers, and radical bonding. Meanwhile, a few aromatic compounds were generated in the pyrolysis process, and the benzene formation mechanism was proposed, as shown in Fig. 15(c). During the long chain scission process, some syn-1,3-butadiene and ethylene species were generated through the above reaction mechanisms. After that, Diels–Alder cycloaddition occurred, and a six-member cyclic transition state was generated, which was extremely unstable and afforded cyclohexene. Then, benzene was formed through dehydrogenation.
Conclusions
In the present study, a two-stage heating treatment was conducted to separate the EoL crystalline silicon PV modules. The TPT backing materials could be recovered integrally by heating at 150 °C for 5 min, which was conducive to further recycling and regeneration. Then, the EVA binder was removed by the pyrolysis process at the temperature of 500 °C. Besides, the pyrolysis products of the EVA binder were characterized by PY-GC-MS; acetic acid and a series of hydrocarbon compounds were the main products obtained during the heating treatment. Meanwhile, TGA-FTIR analysis was conducted for a better understanding of the pyrolysis process. The results indicated that the pyrolysis of the EVA binder could be divided into two stages; acetic acid was the main product in the low-temperature zone (300–400 °C) and a series of olefins were generated in the high-temperature zone (above 410 °C). Furthermore, the pyrolysis kinetics and pyrolysis mechanisms were studied based on the experimental data and sufficient theoretical foundation. Acetic acid was generated by the deacetylation process through a six-member cyclic transition state. Several hydrocarbon compounds were generated through a series of long chain scissions, free radical migrations, intramolecular electron transfers and Diels–Alder cycloadditions. In this study, undamaged TPT backing materials, glass and silicon wafers were obtained, which could be recycled by further treatment. This study can improve the process of waste crystalline silicon solar panel recycling and provide a fundamental basis as well as practical experience for recycling waste crystalline silicon solar panels in an environmentally friendly and efficient manner.Conflicts of interest
There are no conflicts to declare.Acknowledgements
This work was supported by the National Natural Science Foundation of China (51474146), the National Natural Science Foundation of China (21806102), Shanghai Sailing Program (18YF1408800), Natural Science Foundation of Shanghai (16ZR1412500) and Gaoyuan Discipline of Shanghai – Environmental Science and Engineering (Resource Recycling Science and Engineering).Notes and references
- Y. Xu, J. Li, Q. Tan, A. L. Peters and C. Yang, Waste Manage., 2018, 75, 450–458 CrossRef PubMed.
- M. M. Aman, K. H. Solangi, M. S. Hossain, A. Badarudin, G. B. Jasmon, H. Mokhlis, A. H. A. Bakar and S. N. Kazi, Renewable Sustainable Energy Rev., 2015, 41, 1190–1204 CrossRef CAS.
- A. Paiano, Renewable Sustainable Energy Rev., 2015, 41, 99–112 CrossRef.
- C. Sener and V. Fthenakis, Renewable Sustainable Energy Rev., 2014, 32, 854–868 CrossRef.
- F. Corcelli, M. Ripa, E. Leccisi, V. Cigolotti, V. Fiandra, G. Graditi, L. Sannino, M. Tammaro and S. Ulgiati, Ecol. Indic., 2018, 94, 37–51 CrossRef CAS.
- J. Shin, J. Park and N. Park, Sol. Energy Mater. Sol. Cells, 2017, 162, 1–6 CrossRef CAS.
- J. K. Lee, J. S. Lee, Y. S. Ahn, G. H. Kang, H. E. Song, J. I. Lee, M. G. Kang and C. H. Cho, Sol. Energy Mater. Sol. Cells, 2017, 160, 301–306 CrossRef CAS.
- J. Park, W. Kim, N. Cho, H. Lee and N. Park, Green Chem., 2016, 18, 1706–1714 RSC.
- B. Jung, J. Park, D. Seo and N. Park, ACS Sustainable Chem. Eng., 2016, 4, 4079–4083 CrossRef CAS.
- M. L. Bustamante and G. Gaustad, Appl. Energy, 2014, 123, 397–414 CrossRef CAS.
- A. J. Hunt, A. S. Matharu, A. H. King and J. H. Clark, Green Chem., 2015, 17, 1949–1950 RSC.
- J. Tao and S. Yu, Sol. Energy Mater. Sol. Cells, 2015, 141, 108–124 CrossRef CAS.
- P. Wu, B. Xia and X. Zhao, Renewable Sustainable Energy Rev., 2014, 37, 360–369 CrossRef CAS.
- D. Sica, O. Malandrino, S. Supino, M. Testa and M. C. Lucchetti, Renewable Sustainable Energy Rev., 2018, 82, 2934–2945 CrossRef.
- W.-H. Huang, W. J. Shin, L. Wang, W.-C. Sun and M. Tao, Sol. Energy, 2017, 144, 22–31 CrossRef CAS.
- S. Kang, S. Yoo, J. Lee, B. Boo and H. Ryu, Renewable Energy, 2012, 47, 152–159 CrossRef CAS.
- T. Matsubara, M. A. Uddin, Y. Kato, T. Kawanishi and Y. Hayashi, J. Sust. Metall., 2018, 4, 378–387 CrossRef.
- J. Y. Li, M. Cai, X. W. Wu and Y. Tan, J. Inorg. Mater., 2018, 33, 987–992 CrossRef.
- K. Takami, M. Kobashi, Y. Shiraga, M. A. Uddin, Y. Kato and S. J. Wu, Mater. Trans., 2015, 56, 2047–2052 CrossRef CAS.
- J. Park and N. Park, RSC Adv., 2014, 4, 34823–34829 RSC.
- B. Meinel, T. Koschwitz, R. Heinemann and J. Acker, Mater. Sci. Semicond. Process., 2014, 26, 695–703 CrossRef CAS.
- P. Dias, L. Schmidt, L. B. Gomes, A. Bettanin, H. Veit and A. M. Bernardes, J. Sust. Metall., 2018, 4, 176–186 CrossRef.
- T. Doi, I. Tsuda, H. Unagida, A. Murata, K. Sakuta and K. Kurokawa, Sol. Energy Mater. Sol. Cells, 2001, 67, 397–403 CrossRef CAS.
- Y. Kim and J. Lee, Sol. Energy Mater. Sol. Cells, 2012, 98, 317–322 CrossRef CAS.
- P. Dias, S. Javimczik, M. Benevit, H. Veit and A. M. Bernardes, Waste Manage., 2016, 57, 220–225 CrossRef CAS PubMed.
- P. Dias, S. Javimczik, M. Benevit and H. Veit, Waste Manage., 2017, 60, 716–722 CrossRef CAS PubMed.
- E. Klugmann-Radziemska, P. Ostrowski, K. Drabczyk, P. Panek and M. Szkodo, Sol. Energy Mater. Sol. Cells, 2010, 94, 2275–2282 CrossRef CAS.
- J. K. Lee, J. S. Lee, Y. S. Ahn, G. H. Kang, H. E. Song, M. G. Kang, Y. H. Kim and C. H. Cho, Prog. Photovoltaics, 2018, 26, 179–187 CAS.
- H. Park, S. Kwon, J. S. Lee, H. J. Lim, S. Yoon and D. Kim, Sol. Energy Mater. Sol. Cells, 2009, 93, 1773–1778 CrossRef CAS.
| This journal is © The Royal Society of Chemistry 2019 |

