 Open Access Article
Increased power conversion efficiency of dye-sensitized solar cells with counter electrodes based on carbon materials
Shihan Zhang,
Jingsha Jin,
Dan Li,
Zhiqiang Fu,
Shufang Gao,
Shubo Cheng,
Xiangxiang Yu and
Yan Xiong *
*
School of Physics and Optoelectronic Engineering, Yangtze University, Jingzhou 434023, Hubei, PR China. E-mail: xiongyan1215@163.com; Fax: +86 716 8060942; Tel: +86 13986709366
First published on 16th July 2019
Abstract
The good catalytic activity, resistance to iodine corrosion, and stability of carbon materials make them ideally suited for the fabrication of counter electrodes used in dye-sensitized solar cells (DSSCs). Different carbon materials have been used to make counter electrodes, and each has its own advantages, such as good film formation or high electric conductivity. Herein, various carbon materials were mixed and employed for preparing counter electrodes in DSSCs. Both fine film morphology and improved charge-carrier transport were obtained, and the power conversion efficiency of the DSSCs was thus increased. Accordingly, a cell efficiency of 6.29% was obtained by the DSSC with a counter electrode composed of the optimum mixture of carbon nanotubes, graphite, conductive carbon black, and graphene. Furthermore, DSSCs with a flexible counter electrode were fabricated using the optimum carbon material mixture, and the corresponding DSSCs achieved a power conversion efficiency of 4.32%.
1. Introduction
Energy shortages and environmental crises have fostered the recent worldwide development of solar cell technologies. Presently, the mainstream solar cell market is based on silicon devices. However, dye-sensitized solar cells (DSSCs) are third-generation solar cell technology that has attracted considerable attention owing to its advantages of low cost, simple and environmentally friendly production process, and potential to achieve efficient conversion of sunlight into electricity.1,2The structure of a DSSC is sandwich-like and mainly consists of a photoanode, electrolyte, and counter electrode. The photoanode is mainly composed of a conductive transparent substrate, such as fluorine-doped tin oxide (FTO) glass, with an overlying semiconductor oxide film such as TiO2, ZnO that adsorbs a sensitizer, such as a ruthenium dye. The electrolyte contains a redox couple, usually I−/I3−. The counter electrode serves as a reduction catalyst. Under sunlight irradiation, the dye molecules absorb photons of sufficient energy to initiate the transition of electrons from the ground state to excited states, and the excited electrons become injected into the conduction band of the semiconductor oxide film, after which they are transmitted to the conductive substrate, and current flows through the external circuit to the counter electrode. At this time, the oxidation/reduction reaction occurs simultaneously in the electrolyte, and the dye molecules in the reduced oxidation state receive electrons through the external circuit, which returns the dye molecules to their original state. This process forms the working cycle of a DSSC.1–3
Theoretically speaking, the photoelectric response of a DSSC improves with the increasing rate at which oxidized dye molecules in the electrolyte are reduced by electrons on the counter electrode. Therefore, the counter electrode is an important component of a DSSC. Platinum (Pt) is the most commonly employed material for counter electrodes owing to its low resistance and good catalytic effect. A DSSC efficiency of 12.3% was achieved with cobalt(II/III)-based redox electrolytes and Pt-based counter electrodes by M. Grätzel et al. To the best of our knowledge, 12.3% is the highest power conversion efficiency (PCE) of DSSCs with Pt-based counter electrodes.4 However, Pt-based counter electrodes are easily corroded by electrolytes containing I−/I3−. More importantly, the cost of Pt-based counter electrodes is very high, and inexpensive alternatives are urgently required to facilitate the economical and large-scale production of DSSCs.5
Carbon materials have high electrical conductivity, stable chemical properties, and good thermal stability. Moreover, these materials also offer good catalytic activity and resistance to iodine corrosion, with a cost that is substantially less than that of Pt. Presently, carbon-based counter electrodes are mainly fabricated from various materials, such as graphite, activated carbon, conductive carbon black, and graphene.6–17 In addition, these materials can be combined or composited with other materials, such as metal nanowires and metal-sulfide.18,19 However, carbon materials have disadvantages with respect to their use as counter electrodes in DSSCs owing to problems associated with poor film formation and poor adhesion to the conductive substrates of counter electrodes.
The present work addresses these challenges by mixing several carbon materials to obtain counter electrodes that feature improved film formation and provide DSSCs with excellent PCE. Counter electrodes made from the optimum mixture of graphite, conductive carbon black, graphene, and carbon nanotubes (CNTs) achieve good film morphology and a corresponding DSSC PCE of 6.29%. Furthermore, a flexible counter electrode formed of the optimum carbon material mixture on a polyethylene terephthalate (PET)/ITO substrate was also fabricated, and a corresponding DSSC PCE of 4.32% was achieved.
2. Experimental
Materials
Graphite, isopropyl alcohol, nitric acid, and Triton X-100 were purchased from Sinopharm Chemical Reagent Co., Ltd. (Shanghai, China). Conductive carbon black was purchased from Cabot Co., Ltd. (USA). Graphene and CNTs were purchased from Suzhou Tanfeng Graphene Technology Co., Ltd. (Suzhou, China). Isopropyl titanate, cis-bis(isothiocyanato)bis(2,2′-bipyridyl-4,4′-dicarboxylato)ruthenium(II)bis-tetrabutylammonium (N719) ruthenium dye, lithium iodide (LiI), molecular iodine (I2), 1-propyl-3-methylimidazolium iodide, 4-tert-butylpyridine, TiO2 paste, and FTO conductive glass were purchased from Yinkou OPV Tech New Energy Co., Ltd. (Yinkou, China). The TiO2 paste used was composed of TiO2 nanoparticles (Degussa P25), ethyl cellulose, terpineol, and ethanol. All chemicals were reagent grade and used as received without further purification.Preparation of photoanodes
The FTO conductive glass was washed with detergent, deionized water, acetone, and ethanol in turn by intensive sonication for 30 min and then dried in a standard oven.1,20 The TiO2 paste was deposited onto the FTO glass by screen printing. The area of the formed TiO2 films was approximately 0.16 cm2. Then, the TiO2 films were calcined for 2 h in a muffle furnace at 450 °C. A 0.5 mM N719 ethanol solution was configured as a sensitizing dye solution for the TiO2 film. The as-prepared TiO2 film was immersed in the dye solution and stored in the absence of light for 24 h to ensure that the dye pigment molecules were adsorbed fully onto the TiO2 film. The surface of the TiO2 film was rinsed with ethanol to remove non-adsorbed pigment molecules and thereby obtain an N719 dye-sensitized TiO2 thin film, which served as the complete DSSC photoanode.Preparation of carbon counter electrodes
First, a TiO2 colloid was prepared by adding 12.5 ml of Ti(OCH(CH3)2)4 with 2 ml of isopropanol to 75 ml of water dropwise under stirring, and, after the addition of 0.6 ml of 65% nitric acid and heating the solution at 80 °C for 8 h under stirring, the TiO2 precipitate was peptized to a white transparent colloid.21,22 The carbon materials were mixed and ground in a mortar with some ethanol, and the resulting paste was left to dry in the air to form carbon powder. Then, 75 mg of the carbon powder was ground in the mortar with 0.1 ml of the TiO2 colloid, 0.2 ml of water, and a drop of Triton X-100 aqueous solution. The carbon paste was coated on the FTO glass using a doctor blade and subjected to air dry.DSSC device fabrication and characterization
The electrolyte, which consisted of 0.3 M LiI, 0.6 M 1, 2-dimethyl-3-n-propylimidazolium iodide, 0.05 M I2, and 0.5 M 4-tert-butylpyridine in acetonitrile, was injected between the photoanode and the counter electrode through a siphonic effect. The photovoltaic performances, including the short circuit current density (Jsc), open-circuit voltage (Voc), fill factor (FF), and power conversion efficiency (η), of each DSSC were evaluated by measuring the current density–voltage (J–V) characteristics of the cells using a Keithley 2450 source meter under a light intensity of 100 mW cm−2 from a xenon lamp (300 W; Nbet, HSX-F300). Incident photon-to-current efficiency (IPCE) was measured by a solar cell IPCE test system (Zolix, SCS10-X150). The microstructure of the counter electrodes was analyzed with the field emission scanning electronic microscope (SEM; TESCAN, MIRA3 & JEOL, JSM7100F). Electrochemical impedance spectroscopy (EIS) measurements were conducted using an electrochemical workstation (CorrTest, CS 350H). Tafel polarization measurements were carried out on another electrochemical workstation (Zahner Zennium E). The sheet resistance was measured by a four-probe meter (RTS-3, 4Probes Tech, China). Profilometry (Tencor Alfa-Step D-600) was used to determine the thickness of the films.3. Results and discussion
Attempts to form a counter electrode from pure graphite or pure conductive carbon black failed to obtain a film of sufficient quality. Here, a uniform mixture of pure graphite, TiO2 colloid, water, and surfactant is difficult to obtain because the TiO2 colloid always floats on the surface. In addition, the graphite tends to agglomerate, and its adhesion to the FTO glass is poor. In contrast, the mixture of pure conductive carbon black, TiO2 colloid, water, and surfactant readily adheres to the glass substrate, but a complete thin film is difficult to form due to agglomeration of the carbon black. Thus, a combination of graphite and conductive carbon black is complementary, such that the mixture with TiO2 colloid is uniform, and thin films with good adherence and homogeneity can be formed on FTO glass. Therefore, a combination of graphite and conductive carbon black serves as a good base material for subsequent evaluation.Counter electrodes composed of mixed graphite and conductive carbon black in the proportions listed in Table 1 were employed in DSSCs, and the cells subjected to testing. The J–V characteristics of the resulting DSSCs are shown in Fig. 1. Table 1 also lists the detailed photovoltaic properties of the DSSCs.
| Sample | Mass ratio (graphite![[thin space (1/6-em)]](https://www.rsc.org/images/entities/char_2009.gif) : :![[thin space (1/6-em)]](https://www.rsc.org/images/entities/char_2009.gif) conductive carbon black) conductive carbon black) |
Jsc (mA cm−2) | Voc (V) | η (%) | FF |
|---|---|---|---|---|---|
| GB1.5 | 1.5![[thin space (1/6-em)]](https://www.rsc.org/images/entities/char_2009.gif) : :![[thin space (1/6-em)]](https://www.rsc.org/images/entities/char_2009.gif) 1 1 |
13.28 | 0.60 | 4.23 | 0.53 |
| GB3 | 3![[thin space (1/6-em)]](https://www.rsc.org/images/entities/char_2009.gif) : :![[thin space (1/6-em)]](https://www.rsc.org/images/entities/char_2009.gif) 1 1 |
13.36 | 0.63 | 5.21 | 0.62 |
| GB4 | 4![[thin space (1/6-em)]](https://www.rsc.org/images/entities/char_2009.gif) : :![[thin space (1/6-em)]](https://www.rsc.org/images/entities/char_2009.gif) 1 1 |
13.44 | 0.63 | 5.32 | 0.63 |
| GB5 | 5![[thin space (1/6-em)]](https://www.rsc.org/images/entities/char_2009.gif) : :![[thin space (1/6-em)]](https://www.rsc.org/images/entities/char_2009.gif) 1 1 |
13.12 | 0.59 | 4.62 | 0.60 |
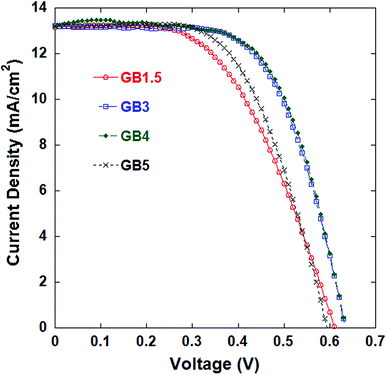 | ||
| Fig. 1 Current density–voltage (J–V) characteristics of DSSCs with counter electrode samples composed of mixed graphite and conductive carbon black in the ratios listed in Table 1. | ||
The results indicate that the photocurrent slightly increases as the graphite![[thin space (1/6-em)]](https://www.rsc.org/images/entities/char_2009.gif) :
:![[thin space (1/6-em)]](https://www.rsc.org/images/entities/char_2009.gif) conductive carbon black mass ratio increases from 1.5
conductive carbon black mass ratio increases from 1.5![[thin space (1/6-em)]](https://www.rsc.org/images/entities/char_2009.gif) :
:![[thin space (1/6-em)]](https://www.rsc.org/images/entities/char_2009.gif) 1 to 4
1 to 4![[thin space (1/6-em)]](https://www.rsc.org/images/entities/char_2009.gif) :
:![[thin space (1/6-em)]](https://www.rsc.org/images/entities/char_2009.gif) 1 and then decreases at 5
1 and then decreases at 5![[thin space (1/6-em)]](https://www.rsc.org/images/entities/char_2009.gif) :
:![[thin space (1/6-em)]](https://www.rsc.org/images/entities/char_2009.gif) 1. From Table 1, we note that the value of Jsc similarly increases from 13.28 mA cm−2 to 13.44 mA cm−2 as the mass ratio increases from 1.5
1. From Table 1, we note that the value of Jsc similarly increases from 13.28 mA cm−2 to 13.44 mA cm−2 as the mass ratio increases from 1.5![[thin space (1/6-em)]](https://www.rsc.org/images/entities/char_2009.gif) :
:![[thin space (1/6-em)]](https://www.rsc.org/images/entities/char_2009.gif) 1 to 4
1 to 4![[thin space (1/6-em)]](https://www.rsc.org/images/entities/char_2009.gif) :
:![[thin space (1/6-em)]](https://www.rsc.org/images/entities/char_2009.gif) 1 and then decreases to 13.12 mA cm−2 when the mass ratio is increased to 5
1 and then decreases to 13.12 mA cm−2 when the mass ratio is increased to 5![[thin space (1/6-em)]](https://www.rsc.org/images/entities/char_2009.gif) :
:![[thin space (1/6-em)]](https://www.rsc.org/images/entities/char_2009.gif) 1. This same trend is observed for Voc as well. The maximum Jsc and Voc values obtained for electrode sample GB4 ensure that it achieves the highest values of η (5.32%) and FF (0.63). These results reflect the effects of carbon black addition. Here, the addition of carbon black is expected to increase contact among the graphite particles and thereby improve the film quality. Furthermore, the relatively large specific surface area of carbon black benefits the catalytic activity of the counter electrode. However, excess carbon black in the sample tends to coat the graphite particles in the mixture and thereby weaken the oxidation–reduction reaction of the electrode. As such, the mass ratio of 4 parts graphite to 1 part conductive carbon black represents an optimum value that attains a relatively high DSSC efficiency.23 Therefore, subsequent studies began with a base material composed of graphite and conductive carbon black with a graphite
1. This same trend is observed for Voc as well. The maximum Jsc and Voc values obtained for electrode sample GB4 ensure that it achieves the highest values of η (5.32%) and FF (0.63). These results reflect the effects of carbon black addition. Here, the addition of carbon black is expected to increase contact among the graphite particles and thereby improve the film quality. Furthermore, the relatively large specific surface area of carbon black benefits the catalytic activity of the counter electrode. However, excess carbon black in the sample tends to coat the graphite particles in the mixture and thereby weaken the oxidation–reduction reaction of the electrode. As such, the mass ratio of 4 parts graphite to 1 part conductive carbon black represents an optimum value that attains a relatively high DSSC efficiency.23 Therefore, subsequent studies began with a base material composed of graphite and conductive carbon black with a graphite![[thin space (1/6-em)]](https://www.rsc.org/images/entities/char_2009.gif) :
:![[thin space (1/6-em)]](https://www.rsc.org/images/entities/char_2009.gif) carbon black mass ratio of 4
carbon black mass ratio of 4![[thin space (1/6-em)]](https://www.rsc.org/images/entities/char_2009.gif) :
:![[thin space (1/6-em)]](https://www.rsc.org/images/entities/char_2009.gif) 1 (i.e., sample GB4).
1 (i.e., sample GB4).
We investigated modifications to the above base carbon material for preparing counter electrodes that provided enhanced DSSC performance. To this end, CNTs and graphene were added to the base material successively, and the resulting DSSC performances were compared.
Counter electrodes composed of CNTs and GB4 in the proportions listed in Table 2 were employed in DSSCs, and the cells subjected to testing. The J–V characteristics of the DSSCs are shown in Fig. 2, and the detailed photovoltaic properties are also listed in Table 2. Similarly, counter electrodes composed of graphene and GB4 in the proportions listed in Table 3 were employed in DSSCs, and the cells subjected to testing. The J–V characteristics of the DSSCs are shown in Fig. 3, and the detailed photovoltaic properties are also listed in Table 3.
| Sample | Mass ratio (CNTs![[thin space (1/6-em)]](https://www.rsc.org/images/entities/char_2009.gif) : :![[thin space (1/6-em)]](https://www.rsc.org/images/entities/char_2009.gif) GB4) GB4) |
Jsc (mA cm−2) | Voc (V) | η (%) | FF |
|---|---|---|---|---|---|
| C-GB1 | 1![[thin space (1/6-em)]](https://www.rsc.org/images/entities/char_2009.gif) : :![[thin space (1/6-em)]](https://www.rsc.org/images/entities/char_2009.gif) 1 1 |
10.15 | 0.64 | 4.65 | 0.72 |
| C-GB2 | 2![[thin space (1/6-em)]](https://www.rsc.org/images/entities/char_2009.gif) : :![[thin space (1/6-em)]](https://www.rsc.org/images/entities/char_2009.gif) 1 1 |
13.23 | 0.64 | 5.61 | 0.66 |
| C-GB3 | 3![[thin space (1/6-em)]](https://www.rsc.org/images/entities/char_2009.gif) : :![[thin space (1/6-em)]](https://www.rsc.org/images/entities/char_2009.gif) 1 1 |
12.93 | 0.71 | 5.13 | 0.56 |
| C | 1![[thin space (1/6-em)]](https://www.rsc.org/images/entities/char_2009.gif) : :![[thin space (1/6-em)]](https://www.rsc.org/images/entities/char_2009.gif) 0 0 |
10.03 | 0.64 | 4.10 | 0.64 |
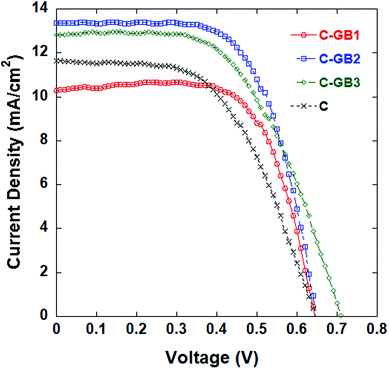 | ||
| Fig. 2 J–V curves of DSSCs with counter electrode samples composed of mixed CNTs and GB4 in the ratios listed in Table 2. | ||
| Samples | Mass ratio (graphene![[thin space (1/6-em)]](https://www.rsc.org/images/entities/char_2009.gif) : :![[thin space (1/6-em)]](https://www.rsc.org/images/entities/char_2009.gif) GB4) GB4) |
Jsc (mA cm−2) | Voc (V) | η (%) | FF |
|---|---|---|---|---|---|
| G | 1![[thin space (1/6-em)]](https://www.rsc.org/images/entities/char_2009.gif) : :![[thin space (1/6-em)]](https://www.rsc.org/images/entities/char_2009.gif) 0 0 |
10.59 | 0.61 | 3.15 | 0.49 |
| GB-G3 | 1![[thin space (1/6-em)]](https://www.rsc.org/images/entities/char_2009.gif) : :![[thin space (1/6-em)]](https://www.rsc.org/images/entities/char_2009.gif) 3 3 |
8.64 | 0.66 | 3.44 | 0.60 |
| GB-G4 | 1![[thin space (1/6-em)]](https://www.rsc.org/images/entities/char_2009.gif) : :![[thin space (1/6-em)]](https://www.rsc.org/images/entities/char_2009.gif) 4 4 |
13.83 | 0.66 | 4.94 | 0.54 |
| GB-G5 | 1![[thin space (1/6-em)]](https://www.rsc.org/images/entities/char_2009.gif) : :![[thin space (1/6-em)]](https://www.rsc.org/images/entities/char_2009.gif) 5 5 |
11.68 | 0.64 | 3.77 | 0.50 |
| GB-G6 | 1![[thin space (1/6-em)]](https://www.rsc.org/images/entities/char_2009.gif) : :![[thin space (1/6-em)]](https://www.rsc.org/images/entities/char_2009.gif) 6 6 |
11.26 | 0.62 | 2.20 | 0.32 |
| GB-G9 | 1![[thin space (1/6-em)]](https://www.rsc.org/images/entities/char_2009.gif) : :![[thin space (1/6-em)]](https://www.rsc.org/images/entities/char_2009.gif) 9 9 |
8.95 | 0.43 | 1.40 | 0.36 |
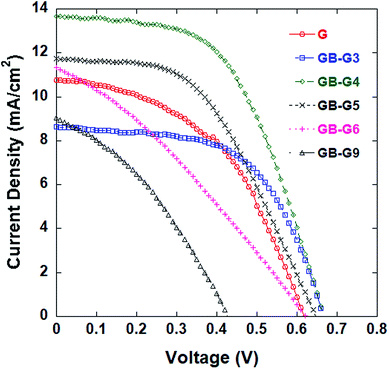 | ||
| Fig. 3 J–V curves of DSSCs with counter electrode samples composed of mixed graphene and GB4 in the ratios listed in Table 3. | ||
Acceptable films of pure CNTs and pure graphene are difficult to obtain without specific treatment because both CNTs and graphene adhere poorly to the FTO glass, and the resultant films easily crack, particularly in the case of graphene. As a result, the DSSCs employing the corresponding counter electrodes obtain relatively low values of η. For the DSSC with the counter electrode of pure CNTs, η = 4.10%, Jsc = 10.03 mA cm−2, and Voc = 0.64 V. For the DSSC with the counter electrode of pure graphene, η is much less and is only 3.15%, while Jsc = 10.59 mA cm−2, and Voc = 0.61 V. However, mixing CNTs and graphene with carbon material GB4 greatly enhances film formation and DSSC performance.
As shown in Table 2 and Fig. 2, the Jsc, Voc, and η values of the DSSCs based on the mixed CNTs and GB4 electrodes are substantially greater than those obtained with the electrode composed of pure CNTs. In fact, the DSSC with the counter electrode composed of a CNTs![[thin space (1/6-em)]](https://www.rsc.org/images/entities/char_2009.gif) :
:![[thin space (1/6-em)]](https://www.rsc.org/images/entities/char_2009.gif) GB4 mass ratio of 2
GB4 mass ratio of 2![[thin space (1/6-em)]](https://www.rsc.org/images/entities/char_2009.gif) :
:![[thin space (1/6-em)]](https://www.rsc.org/images/entities/char_2009.gif) 1 yields an efficiency of 5.61%, which is greater than that of the DSSC employing the GB4 electrode (5.32%).
1 yields an efficiency of 5.61%, which is greater than that of the DSSC employing the GB4 electrode (5.32%).
As shown in Table 3 and Fig. 3, the Jsc, Voc, and η values of the DSSCs based on the mixed graphene and GB4 electrodes increase up to a graphene![[thin space (1/6-em)]](https://www.rsc.org/images/entities/char_2009.gif) :
:![[thin space (1/6-em)]](https://www.rsc.org/images/entities/char_2009.gif) GB4 mass ratio of 1
GB4 mass ratio of 1![[thin space (1/6-em)]](https://www.rsc.org/images/entities/char_2009.gif) :
:![[thin space (1/6-em)]](https://www.rsc.org/images/entities/char_2009.gif) 4 and then begin decreasing until obtaining smaller values than those obtained for the pure graphene electrode at mass ratios of 1
4 and then begin decreasing until obtaining smaller values than those obtained for the pure graphene electrode at mass ratios of 1![[thin space (1/6-em)]](https://www.rsc.org/images/entities/char_2009.gif) :
:![[thin space (1/6-em)]](https://www.rsc.org/images/entities/char_2009.gif) 6 and 1
6 and 1![[thin space (1/6-em)]](https://www.rsc.org/images/entities/char_2009.gif) :
:![[thin space (1/6-em)]](https://www.rsc.org/images/entities/char_2009.gif) 9. However, the optimum graphene
9. However, the optimum graphene![[thin space (1/6-em)]](https://www.rsc.org/images/entities/char_2009.gif) :
:![[thin space (1/6-em)]](https://www.rsc.org/images/entities/char_2009.gif) GB4 mass ratio of 1
GB4 mass ratio of 1![[thin space (1/6-em)]](https://www.rsc.org/images/entities/char_2009.gif) :
:![[thin space (1/6-em)]](https://www.rsc.org/images/entities/char_2009.gif) 4 obtained relatively low parameter values of only η = 4.94%, Jsc = 13.83 mA cm−2, and Voc = 0.66 V, which are less than those obtained for the DSSC employing the GB4 electrode. This is due to the poor film formation and adhesion of graphene.
4 obtained relatively low parameter values of only η = 4.94%, Jsc = 13.83 mA cm−2, and Voc = 0.66 V, which are less than those obtained for the DSSC employing the GB4 electrode. This is due to the poor film formation and adhesion of graphene.
The sheet resistance of several electrode samples listed in Tables 2 and 3 was measured. The pure C and G electrode samples exhibited high electrical conductivity with sheet resistance values of 7.5 Ω □−1 and 7.4 Ω □−1, respectively. The electrical conductivity of the mixed CNTs and graphene electrode samples decreased relative to the pure samples. For example, the sheet resistance of samples C-GB2 and GB-G4 were 8.5 Ω □−1 and 8.2 Ω □−1, respectively.
Nevertheless, graphene has many excellent electronic properties, such as remarkable electron mobility at room temperature. Therefore, counter electrodes composed of CNTs, GB4, and graphene in the mass ratios listed in Table 4 were employed in DSSCs, and the cells subjected to testing. The J–V curves of the DSSCs are shown in Fig. 4, and the photovoltaic properties are also listed in Table 4. It can be seen from Table 4 and Fig. 4 that the DSSC employing the C-GB-G2 counter electrode sample attains the highest η value of 6.29%, with a modest Jsc value of 13.59 mA cm−2 and Voc = 0.67 V. The higher doping concentration of graphene in the C-GB-G1 sample leads to a higher Voc but a lower Jsc. Moreover, the as-prepared film suffers from poor adhesion. In addition, the lower doping concentration of graphene in the C-GB-G3 sample results in a higher Jsc but a lower Voc, which substantially decreases the efficiency of the DSSC.
| Sample | Mass ratio (CNTs![[thin space (1/6-em)]](https://www.rsc.org/images/entities/char_2009.gif) : :![[thin space (1/6-em)]](https://www.rsc.org/images/entities/char_2009.gif) GB4 GB4![[thin space (1/6-em)]](https://www.rsc.org/images/entities/char_2009.gif) : :![[thin space (1/6-em)]](https://www.rsc.org/images/entities/char_2009.gif) graphene) graphene) |
Jsc (mA cm−2) | Voc (V) | η (%) | FF | |
|---|---|---|---|---|---|---|
| C-GB-G1 | 4![[thin space (1/6-em)]](https://www.rsc.org/images/entities/char_2009.gif) : :![[thin space (1/6-em)]](https://www.rsc.org/images/entities/char_2009.gif) 2 2![[thin space (1/6-em)]](https://www.rsc.org/images/entities/char_2009.gif) : :![[thin space (1/6-em)]](https://www.rsc.org/images/entities/char_2009.gif) 1 1 |
13.09 | 0.69 | 6.00 | 0.66 | |
| C-GB-G2 | 6![[thin space (1/6-em)]](https://www.rsc.org/images/entities/char_2009.gif) : :![[thin space (1/6-em)]](https://www.rsc.org/images/entities/char_2009.gif) 3 3![[thin space (1/6-em)]](https://www.rsc.org/images/entities/char_2009.gif) : :![[thin space (1/6-em)]](https://www.rsc.org/images/entities/char_2009.gif) 1 1 |
13.59 | 0.67 | 6.29 | 0.69 | |
| C-GB-G3 | 8![[thin space (1/6-em)]](https://www.rsc.org/images/entities/char_2009.gif) : :![[thin space (1/6-em)]](https://www.rsc.org/images/entities/char_2009.gif) 4 4![[thin space (1/6-em)]](https://www.rsc.org/images/entities/char_2009.gif) : :![[thin space (1/6-em)]](https://www.rsc.org/images/entities/char_2009.gif) 1 1 |
13.95 | 0.63 | 5.24 | 0.60 |
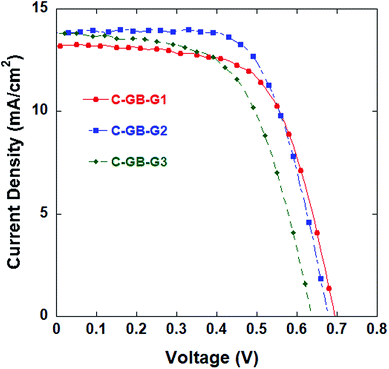 | ||
| Fig. 4 J–V curves of DSSCs with counter electrode samples composed of mixed CNTs, GB4, and graphene in the ratios listed in Table 4. | ||
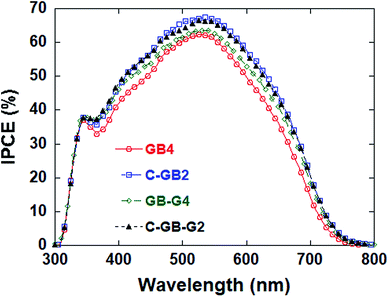
Fig. 5 shows the IPCE of DSSCs with counter electrodes based on GB4, C-GB2, GB-G4 and C-GB-G2. There is little difference in the shape of IPCE curves. However, the IPCE values within the region of visible light of the counter electrodes based on C-GB2 (mixture of CNTs and GB4) and C-GB-G2 (mixture of CNTs, graphene and GB4) are obviously higher than that based on GB4.
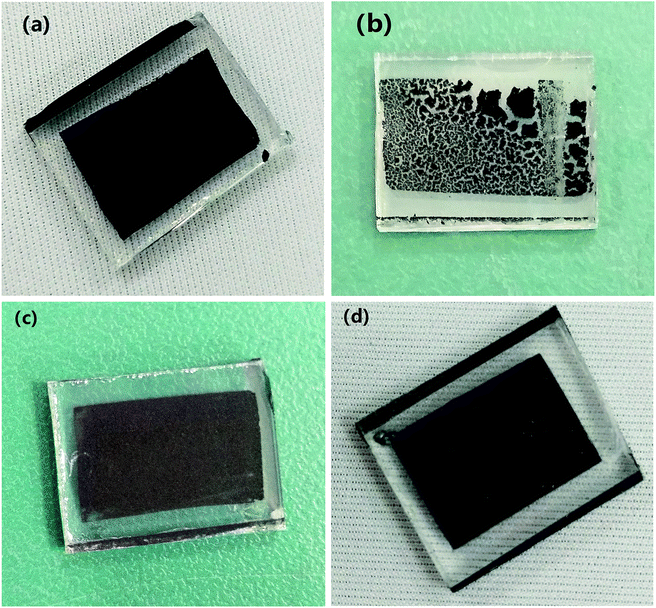
The pictures of the counter electrodes based on GB4, G, C and C-GB-G2 are shown in Fig. 6. As seen, the film made of pure graphene (G) cracks. It seems that GB4 (mixture of graphite, conductive carbon black) and pure CNTs (C) are better at forming smooth film. And the counter electrode made of the mixture of CNTs, graphite, conductive carbon black and graphene (C-GB-G2) is relatively smooth and uniform. The average thickness of the carbon material film is 16.0 μm.
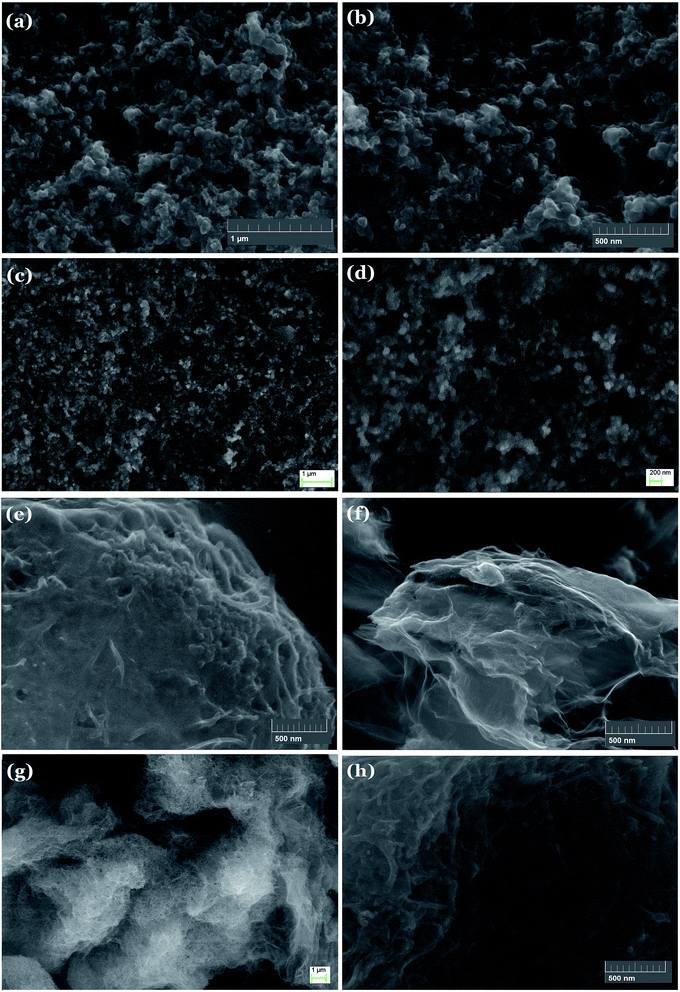
SEM images were obtained to further explore the morphology of counter electrodes (Fig. 7). As shown in Fig. 7(a) and (b), on the surface of pure carbon black film, particles or clusters of tens of nanometers are uniformly distributed. The morphology of counter electrodes based on GB4 is shown in Fig. 7(c) and (d), which is similar to that of the pure carbon black film. The morphology of counter electrodes based on C-GB2 and GB-G4 is shown in Fig. 7(e) and (f), respectively. CNTs and lamellar graphene could be clearly seen in the images. The morphology of sample C-GB-G2 is shown in Fig. 7(g) and (h). As seen, the graphene and CNTs are mixed uniformly with graphite and conductive carbon black.
To explore the interfacial charge transfer on the counter electrode surface, Tafel polarization curves were obtained and shown in Fig. 8. The Tafel lines of the anode (i.e. photoanode) and the cathode (i.e. counter electrode) are fitted, and the slope of the anodic polarization curve ba and that of the cathodic polarization curve bc are respectively shown in Table 5.24 The exchange current I0 was obtained on the intersection point of the cathodic polarization curve and the anodic polarization curve, as listed in Table 5. As seen, the sample GB-G4 has larger bc, ba and I0 than others, indicating that the graphene has better electrocatalytic activity.
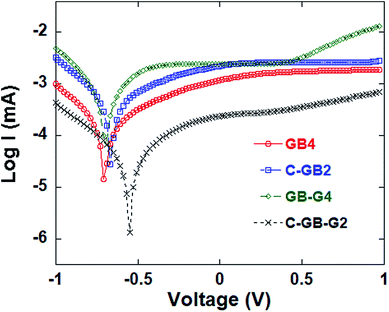 | ||
| Fig. 8 Tafel curves of DSSCs with four different counter electrode samples under 100 mW cm−2 illumination. | ||
| Sample | Anodic polarization curve ba | Cathodic polarization curve bc | I0 (μA) |
|---|---|---|---|
| GB4 | 1.7635 | −2.7591 | 136.85 |
| C-GB2 | 1.6098 | −2.8772 | 360.94 |
| GB-G4 | 2.6803 | −3.4469 | 479.28 |
| C-GB-G2 | 2.1022 | −2.4762 | 33.206 |
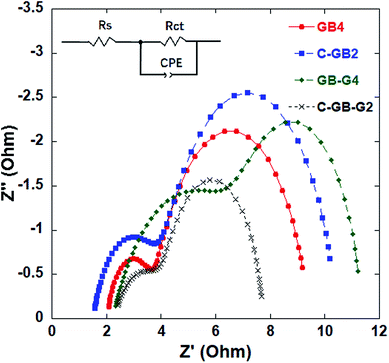
The effects of the counter electrodes based on mixed carbon materials on DSSC performance were further investigated by EIS testing with DSSCs using counter electrode samples GB4, C-GB2, GB-G4, and C-GB-G2. The EIS measurements were conducted over a frequency range of 1–105 Hz under 100 mW cm−2 illumination, and the Nyquist plots of the DSSCs are presented in Fig. 9. As can be seen, each of the plots consists of two semicircles. The semicircle in the high-frequency region is caused by the redox reaction at the counter electrode, and the other semicircle in the middle-frequency region is caused by electron transfer at the TiO2/dye/electrolyte interface. The high-frequency semicircle obtained for each DSSC was fitted according to the equivalent circuit shown in the inset in Fig. 9.24,25 The equivalent circuit is composed of a series resistance (Rs), a charge carrier transfer resistance (Rct) at the electrolyte/counter electrode interface, and a chemical capacitance CPE. The values of Rs and Rct obtained from the fitting process are listed in Table 6.26,27 As seen, the DSSC with counter electrode sample GB4 provides a low Rct, and the value of Rct increases as the electrode sample is mixed with CNTs (C-GB2) and, in particular, with graphene (GB-G4). For the DSSC with counter electrode sample C-GB-G2, the value of Rct is the lowest among all counter electrodes considered, which indicates that the counter electrode composed of CNTs, graphite, conductive carbon black, and graphene in the optimum mass ratio (i.e., 30![[thin space (1/6-em)]](https://www.rsc.org/images/entities/char_2009.gif) :
:![[thin space (1/6-em)]](https://www.rsc.org/images/entities/char_2009.gif) 12
12![[thin space (1/6-em)]](https://www.rsc.org/images/entities/char_2009.gif) :
:![[thin space (1/6-em)]](https://www.rsc.org/images/entities/char_2009.gif) 3
3![[thin space (1/6-em)]](https://www.rsc.org/images/entities/char_2009.gif) :
:![[thin space (1/6-em)]](https://www.rsc.org/images/entities/char_2009.gif) 5) contributes to charger carrier transfer at the interface. This result is in agreement with the obtained photovoltaic characteristics of the device.
5) contributes to charger carrier transfer at the interface. This result is in agreement with the obtained photovoltaic characteristics of the device.
| Sample | Rs (Ω) | Rct (Ω) |
|---|---|---|
| GB4 | 1.956 | 2.296 |
| C-GB2 | 1.489 | 3.032 |
| GB-G4 | 1.789 | 10.68 |
| C-GB-G2 | 2.276 | 2.146 |
Pt-based counter electrodes were also fabricated and η value of 6.60% was achieved, while Jsc = 13.36 mA cm−2, and Voc = 0.66 V. For DSSCs with a carbon counter electrode, the cell efficiency is comparable to the performance of Pt-based devices.
The C-GB-G2 carbon material was used to fabricate a flexible counter electrode on a PET/ITO substrate, which was then employed in a DSSC for testing. The J–V curve of the DSSC is shown in Fig. 10. Accordingly, the DSSC achieved a cell efficiency of 4.32% with a Jsc value of 12.43 mA cm−2, Voc of 0.65 V, and FF of 0.53. Compared with the C-GB-G2 carbon material formed on rigid FTO glass with a sheet resistance of 8.0 Ω □−1, the carbon material film formed on the PET/ITO substrate has a higher surface resistance of 14.7 Ω □−1.
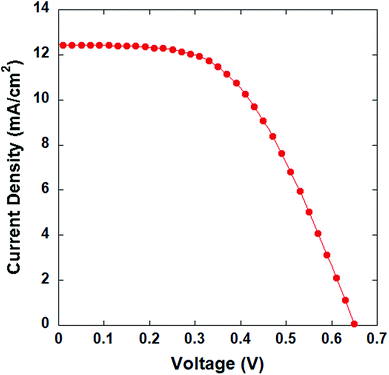 | ||
| Fig. 10 J–V characterization of the DSSC with a flexible counter electrode formed of C-GB-G2 carbon material. | ||
4. Conclusion
Several carbon materials were mixed in various mass ratios to prepare counter electrodes in an effort to obtain high-performance DSSCs at relatively low cost. The counter electrode composed of the mixture of CNTs, graphite, conductive carbon black, and graphene in a mass ratio of 30![[thin space (1/6-em)]](https://www.rsc.org/images/entities/char_2009.gif) :
:![[thin space (1/6-em)]](https://www.rsc.org/images/entities/char_2009.gif) 12
12![[thin space (1/6-em)]](https://www.rsc.org/images/entities/char_2009.gif) :
:![[thin space (1/6-em)]](https://www.rsc.org/images/entities/char_2009.gif) 3
3![[thin space (1/6-em)]](https://www.rsc.org/images/entities/char_2009.gif) :
:![[thin space (1/6-em)]](https://www.rsc.org/images/entities/char_2009.gif) 5 achieved an enhanced DSSC PCE of 6.29%. The analysis of EIS results suggested that the reason for the improved efficiency can be attributed to enhanced charge carrier transfer at the electrolyte/counter electrode interface and because of improved film morphology as well. The optimum carbon material mixture was employed to fabricate a flexible counter electrode, and the corresponding DSSC obtained a PCE of 4.32%.
5 achieved an enhanced DSSC PCE of 6.29%. The analysis of EIS results suggested that the reason for the improved efficiency can be attributed to enhanced charge carrier transfer at the electrolyte/counter electrode interface and because of improved film morphology as well. The optimum carbon material mixture was employed to fabricate a flexible counter electrode, and the corresponding DSSC obtained a PCE of 4.32%.
Conflicts of interest
There are no conflicts to declare.Acknowledgements
This work was supported by the Grants No. 11804032 from the National Natural Science Foundation of China, No. 201801023A from the Intellectual Property Office of Hubei Province of China, No. 2015D-5006-0404 from Petro China Innovation Foundation.References
- S. Ito, P. Liska, P. Comte, R. Charvet, P. Péchy, U. Bach, L. Schmidt-Mende, S. M. Zakeeruddin, A. Kay, M. K. Nazeeruddin and M. Grätzel, Control of dark current in photoelectrochemical (TiO2/I−–I3−) and dye-sensitized solar cells, Chem. Commun., 2005, 34, 4351–4353 RSC.
- E. Singh, K. S. Kim, G. Y. Yeom and H. S. Nalwa, Two-dimensional transition metal dichalcogenide-based counter electrodes for dye-sensitized solar cells, RSC Adv., 2017, 7, 28234–28290 RSC.
- B. O'Regan and M. Grätzel, A low-cost high-efficiency solar cell based on dye-sensitized colloidal TiO2 films, Nature, 1991, 353, 737–740 CrossRef.
- A. Yella, H.-W. Lee, H. N. Tsao, C. Yi, A. K. Chandiran, M. K. Nazeeruddin, E. W.-G. Diau, C.-Y. Yeh, S. M Zakeeruddin and M. Grätzel, Porphyrin-Sensitized Solar Cells with Cobalt (II/III)–Based Redox Electrolyte Exceed 12 Percent Efficiency, Science, 2011, 334, 629–634 CrossRef CAS.
- X. Chen, Z. Li, Y. Bai, Q. Sun, L. Wang and S. Dou, Room-Temperature Synthesis of Cu2_xE (E=S, Se) Nanotubes with Hierarchical Architecture as High-Performance Counter Electrodes of Quantum-Dot-Sensitized Solar Cells, Chem.–Eur. J., 2014, 20, 1–10 CrossRef CAS.
- K. Imoto, K. Takahashi, T. Yamaguchi, T. Komura, J. Nakamura and K. Murata, High-performance carbon counter electrode for dye-sensitized solar cells, Sol. Energy Mater. Sol. Cells, 2003, 79, 459 CrossRef CAS.
- G. Wang, L. Wang, W. Xing and S. Zhuo, A novel counter electrode based on mesoporous carbon for dye-sensitized solar cell, Mater. Chem. Phys., 2010, 123, 690 CrossRef CAS.
- G. Veerappan, K. Bojan and S. W. Rhee, Sub-micrometer-sized Graphite As a Conducting and Catalytic Counter Electrode for Dye-sensitized Solar Cells, ACS Appl. Mater. Interfaces, 2011, 3, 857 CrossRef CAS.
- L. Chu, Y. Gao, M. Wu, L. Wang and T. Ma, Fabrication and Application of a Carbon Counter Electrode with Excellent Adhesion Properties for Dye-Sensitized Solar Cells, Acta Phys.-Chim. Sin., 2012, 28, 1739–1744 CAS.
- W. Hong, Y. Xu, G. Lu, C. Li and G. Shi, Transparent graphene/PEDOT-PSS composite films as counter electrodes of dye-sensitized solar cells, Electrochem. Commun., 2008, 10, 1555 CrossRef CAS.
- H. Choi, H. Kim, S. Hwang, W. Choi and M. Jeon, Dye-sensitized solar cells using graphene-based carbon nano composite as counter electrode, Sol. Energy Mater. Sol. Cells, 2011, 95, 323 CrossRef CAS.
- S. S. Nemala, S. Siva, K. S. Aneja, P. Bhargava, H. L. M. Bohm, S. Mallika and S. Bohm, Novel high-pressure airless spray exfoliation method for graphene nanoplatelets as a stable counter electrode in DSSC, Electrochim. Acta, 2018, 285, 86–93 CrossRef CAS.
- Z. Chen, L. Fang and Y. F. Chen, Fabrication and photovoltaic performance of counter electrode of 3D porous carbon composite, Acta Phys. Sin., 2019, 68, 017802 Search PubMed.
- I. P. Liu, Y. C. Hou, C. W. Li and Y. L. Lee, Highly electrocatalytic counter electrodes based on carbon black for cobalt(III)/(II)-mediated dye-sensitized solar cells, J. Mater. Chem. A, 2017, 5, 240–249 RSC.
- U. Mehmood, A. U. Rehman, H. M. Irshad, A. U. H. Khan and A. A. Ahmed, Carbon/carbon nanocomposites as counter electrodes for platinum free dye-sensitized solar cells, Org. Electron., 2016, 35, 128–135 CrossRef CAS.
- P. Joshi, Y. Xie, M. Ropp, D. Galipeau, S. Bailey and Q. Qiao, Dye-sensitized solar cells based on low cost nanoscale carbon/TiO2 composite counter electrode, Energy Environ. Sci., 2009, 2, 426–429 RSC.
- M. Wu, X. Lin, T. Wang, J. Qiu and T. Ma, Low-cost dye-sensitized solar cell based on nine kinds of carbon counter electrodes, Energy Environ. Sci., 2011, 4, 2308–2315 RSC.
- I. N. Kholmanov, C. W. Magnuson, A. E. Aliev, H. Li, B. Zhang, J. W. Suk, L. L. Zhang, E. Peng, S. H. Mousavi, A. B. Khanikaev, R. Piner, G. Shvets and R. S. Ruoff, Improved Electrical Conductivity of Graphene Films Integrated with Metal Nanowires, Nano Lett., 2012, 12, 5679–5683 CrossRef CAS.
- C. V. V. M. Gopi, S. Ravi, S. S. Rao, A. E. Reddy and H.-J. Kim, Carbon nanotube/metal-sulfide composite flexible electrodes for high-performance quantum dot-sensitized solar cells and supercapacitors, Sci. Rep., 2017, 7, 46519 CrossRef.
- C. Zhang, S. Liu, X. Liu, F. Deng, Y. Xiong and F.-C. Tsai, Incorporation of Mn2+ into CdSe quantum dots by chemical bath co-deposition method for photovoltaic enhancement of quantum dot-sensitized solar cells, R. Soc. Open Sci., 2018, 5, 171712 CrossRef.
- T. N. Murakami, S. Ito, Q. Wang, M. K. Nazeeruddin, T. Bessho, I. Cesar, P. Liska, R. H. Baker, P. Comte, P. Péchy and M. Grätzelz, Highly Efficient Dye-Sensitized Solar Cells Based on Carbon Black Counter Electrodes, J. Electrochem. Soc., 2006, 153, A2255–A2261 CrossRef CAS.
- A. Kay and M. Grätzel, Low cost photovoltaic modules based on dye sensitized nanocrystalline titanium dioxide and carbon powder, Sol. Energy Mater. Sol. Cells, 1996, 44, 99–117 CrossRef CAS.
- S. Tong, B. Yang, C. Zhou, L. Wang, Y. Zhang and F. Zhang, Electrical and electrochemical properties of graphite/TiO2 based carbon counter electrode, J. Funct. Mater. Devices, 2012, 18(2), 122–127 CAS.
- C. G. Zoski, Handbook of Electrochemistry, Elsevier, Amsterdam, 2007, p. 591 Search PubMed.
- G. Dai, L. Zhao, S. Wang, J. Hu, B. Dong, H. Lu and J. Li, Double-layer composite film based on sponge-like TiO2 and P25 as photoelectrode for enhanced efficiency in dye-sensitized solar cells, J. Alloys Compd., 2012, 539, 264–270 CrossRef CAS.
- A. Hauch and A. Georg, Diffusion in the electrolyte and charge-transfer reaction at the platinum electrode in dye-sensitized solar cells, Electrochim. Acta, 2001, 46, 3457 CrossRef CAS.
- Y. L. Xie, Z. X. Li, Z. G. Xu and H. L. Zhang, Preparation of coaxial TiO2/ZnO nanotube arrays for high-efficiency photo-energy conversion applications, Electrochem. Commun., 2011, 13, 788–791 CrossRef CAS.
| This journal is © The Royal Society of Chemistry 2019 |

