
 Open Access Article
 This Open Access Article is licensed under a Creative Commons Attribution-Non Commercial 3.0 Unported Licence
Direct extraction of astaxanthin from the microalgae Haematococcus pluvialis using liquid–liquid chromatography
Andreas Bauer and
Mirjana Minceva*
and
Mirjana Minceva*
Technical University of Munich, TUM School of Life Sciences, Biothermodynamics, Maximus-von-Imhof-Forum 2, 85354 Freising, Germany. E-mail: mirjana.minceva@tum.de
First published on 23rd July 2019
Abstract
The microalgae Haematococcus pluvialis (H. pluvialis) is used for biotechnological production of the red carotenoid astaxanthin. Astaxanthin synthesis involves the formation of a rigid cell wall that impedes direct astaxanthin extraction into a solvent. During the subsequent downstream processing, the algal broth is harvested by centrifugation, dried and mechanically disrupted; finally, astaxanthin is extracted with supercritical CO2. In this study, an alternative extraction process was established, using a liquid–liquid chromatographic column to directly extract astaxanthin from the fermentation broth into a solvent. To achieve this, germination of H. pluvialis cyst cells was initiated, resulting in the release of flagellated zoospores into the fermentation broth. It was shown that astaxanthin could be extracted from the zoospores directly from the algal broth using different solvents; with ethyl acetate, yields reaching 85% were achieved in a shake-flask extraction. Using a liquid–liquid chromatographic column, astaxanthin concentrations reaching 500 mg L−1 were obtained, corresponding to eightfold concentration of the astaxanthin content in the fermentation broth. The mechanical cell disruption, drying and extraction with supercritical CO2 in the conventional astaxanthin production can be replaced by a direct astaxanthin extraction process, using a liquid–liquid chromatographic column. This allows direct astaxanthin extraction at the site of H. pluvialis production.
Introduction
Astaxanthin (3,3′-dihydroxy-β,β′-carotene-4,4′-dione) is a red carotenoid used as a dye in the aquaculture, poultry and cosmetic industries.1,2 It is a strong antioxidant, stabilising and reducing free radicals.3 Astaxanthin shows anti-inflammatory4,5 and antidiabetic activity, and it has the potential to prevent cardiovascular diseases.6,7 Additionally, astaxanthin exhibits great potential for use in the pharmaceutical industry as it shows anticancer activity.8–10 Due to the above health benefits, a significant increase in the demand for natural astaxanthin as a dietary supplement and additive to cosmetic products is predicted. The total market cap of astaxanthin (synthetic and natural) is expected to increase from $555.4 million in 2016 to $2.57 billion in 2025. The price of natural astaxanthin is 2500–7000 $ per kg.11H. pluvialis is the best source of natural astaxanthin, containing up to 4 wt%, compared to other sources such as Phaffia rhodozyma (0.4 wt%), Euphausia pacifica (Pacific krill, 0.012 wt%) and Pandalus borealis (Arctic shrimp, 0.12 wt%).12,13
The cultivation of H. pluvialis can be performed under phototrophic, mixotrophic and heterotrophic conditions, usually via a two-step process. After producing algal biomass in the green stage under optimum growth conditions, astaxanthin synthesis is initiated and performed under so-called stress conditions. The astaxanthin synthesis is accompanied by formation of a resistant cell wall. The astaxanthin synthesis may be affected by light intensity and quantity, temperature, pH, phosphate and nitrate deficiency, as well as by variation in salt concentration.2 The downstream process involves harvesting, drying and mechanical disruption of H. pluvialis cysts followed by astaxanthin extraction with supercritical CO2. A flow chart of the biotechnological production of astaxanthin with H. pluvialis is shown in Fig. 1.14
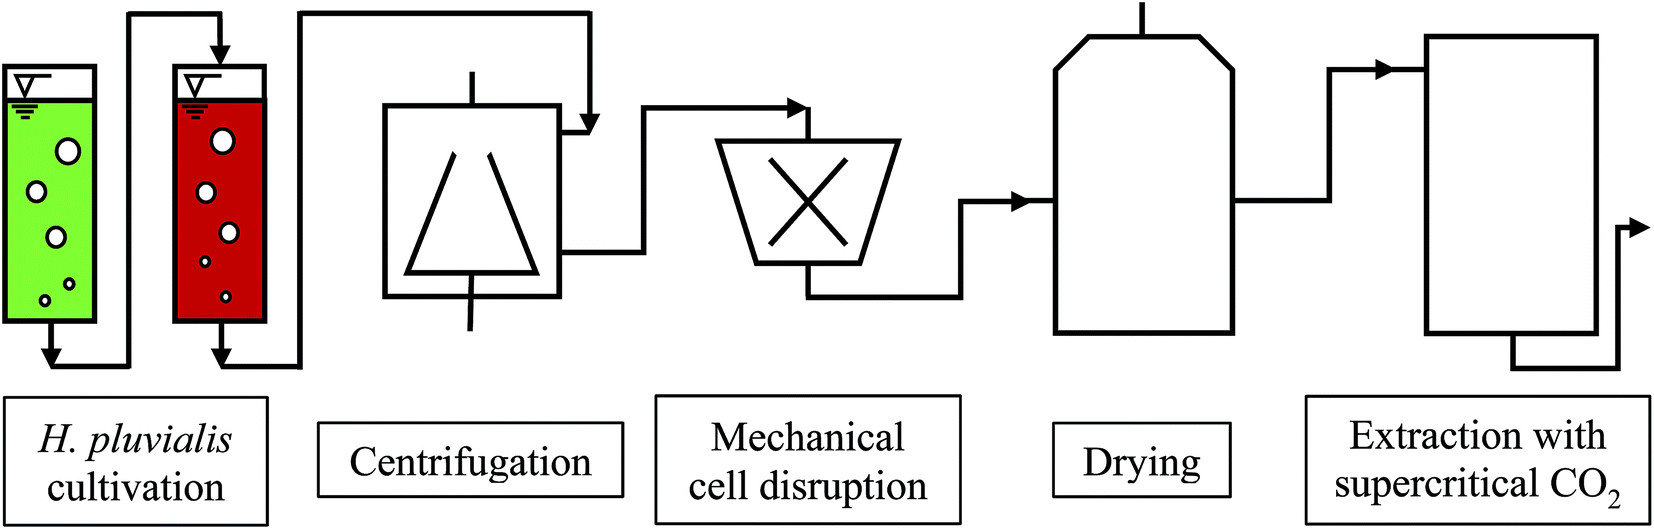 | ||
| Fig. 1 Flow chart of the biotechnological astaxanthin production from H. pluvialis. | ||
A major factor in terms of operating costs is harvesting of the algal biomass, which accounts for up to 20–30% of the total production costs.15 The high harvesting costs are due to the low biomass concentrations reached in the cultivations, the small cell diameter (2–40 μm) and the electronegatively charged cell surface for pH 2.5–11.5, which creates a repulsive force that holds the cells in suspension, as well as the high growth rates of microalgae in comparison to crops, which necessitate high harvesting frequencies.15–17 To harvest H. pluvialis, gravimetric settling, disk-stack centrifugation or a combination of both processes is normally used.16,18
Subsequently, drying and mechanical cell disruption of the algal cysts are performed. The sequence of these two steps can be changed depending on the desired process.14,15 Mechanical cell disruption is mostly performed with bead mills, which have the highest efficiency with biomass concentrations of 100–200 g L−1.17
After cell wall disruption, the broth must be rapidly processed to prevent oxidation of the exposed astaxanthin. The most common drying methods for microalgae are solar drying, freeze drying and spray drying.19,20 Generally, spray drying is used to dry high quality algal products such as astaxanthin, where yields of around 95% are achieved based on the dry biomass.21 The residual moisture in the dried biomass is about 5%.
Industrial astaxanthin extraction is performed with supercritical CO2. This extraction method is often used to extract high value non-polar substances from natural products. In laboratory-scale experiments, the astaxanthin recovery was increased from 45% to 70% by adding 10% ethanol as co-solvent at 300 bar and 60 °C.22 In industry, up to 1000 bar must be used to achieve sufficient yields.23
In the current process for producing natural astaxanthin, the mechanical cell disruption (bead milling), spray drying and supercritical CO2 extraction account for 20.6–32.3% of the total energy requirement. This indicates enormous potential to safe energy by replacing these steps. Additionally, extraction with supercritical CO2 is often performed by an external service provider. This requires storage of the disrupted cells and transport of the biomass. In addition to the danger of astaxanthin degradation during storage and transport, the latter also negatively impacts the total energy consumption of the process.15 The complex life cycle of H. pluvialis can be divided into a motile and non-motile stage. Within these stages, the cells can exist as motile cells, zoospores, non-motile cells and aplanospores, whereby they can interconvert through sporangium formation. Motile cells (Fig. 2a) are elliptical swimming cells with two flagella. The cell size is usually 20–30 μm.24 The flagellated cells have a cell membrane (CM) and a gelatinous cell wall, the extracellular matrix (ECM), which is characteristic for volvocalean motile cells. The cell wall composition is presented schematically in Fig. 3.25 H. pluvialis motile cells are reported to be present from only a few hours26 up to seven days27 after being released from the sporangium. Under unfavourable conditions, motile cells or zoospores released from the sporangium lose their flagella and become non-motile aplanospores (Fig. 2b).26 Under prolonged stress conditions (including high light intensity, high salt concentrations, nitrate and/or phosphate deficiency), the non-motile cells start to accumulate astaxanthin in the middle of the cell (Fig. 2c) around the nucleus until the whole cytoplasm is filled with it (Fig. 2d).24 Transformation from the motile to the non-motile cell is accompanied by changes in the cell wall structure (see Fig. 3). In the final stage, the H. pluvialis cyst is delimited from the periphery by a trilaminar sheath (TLS) as presented schematically in Fig. 3. The TLS contains acetolysis-resistant material, so-called algaenan. The secondary cell wall (SW) consists of an amorphous, electron-dense material and is 400–700 nm thick. In the cyst stadium, the complex multi-layered cell wall gives H. pluvialis high physical and chemical resistance.25,28
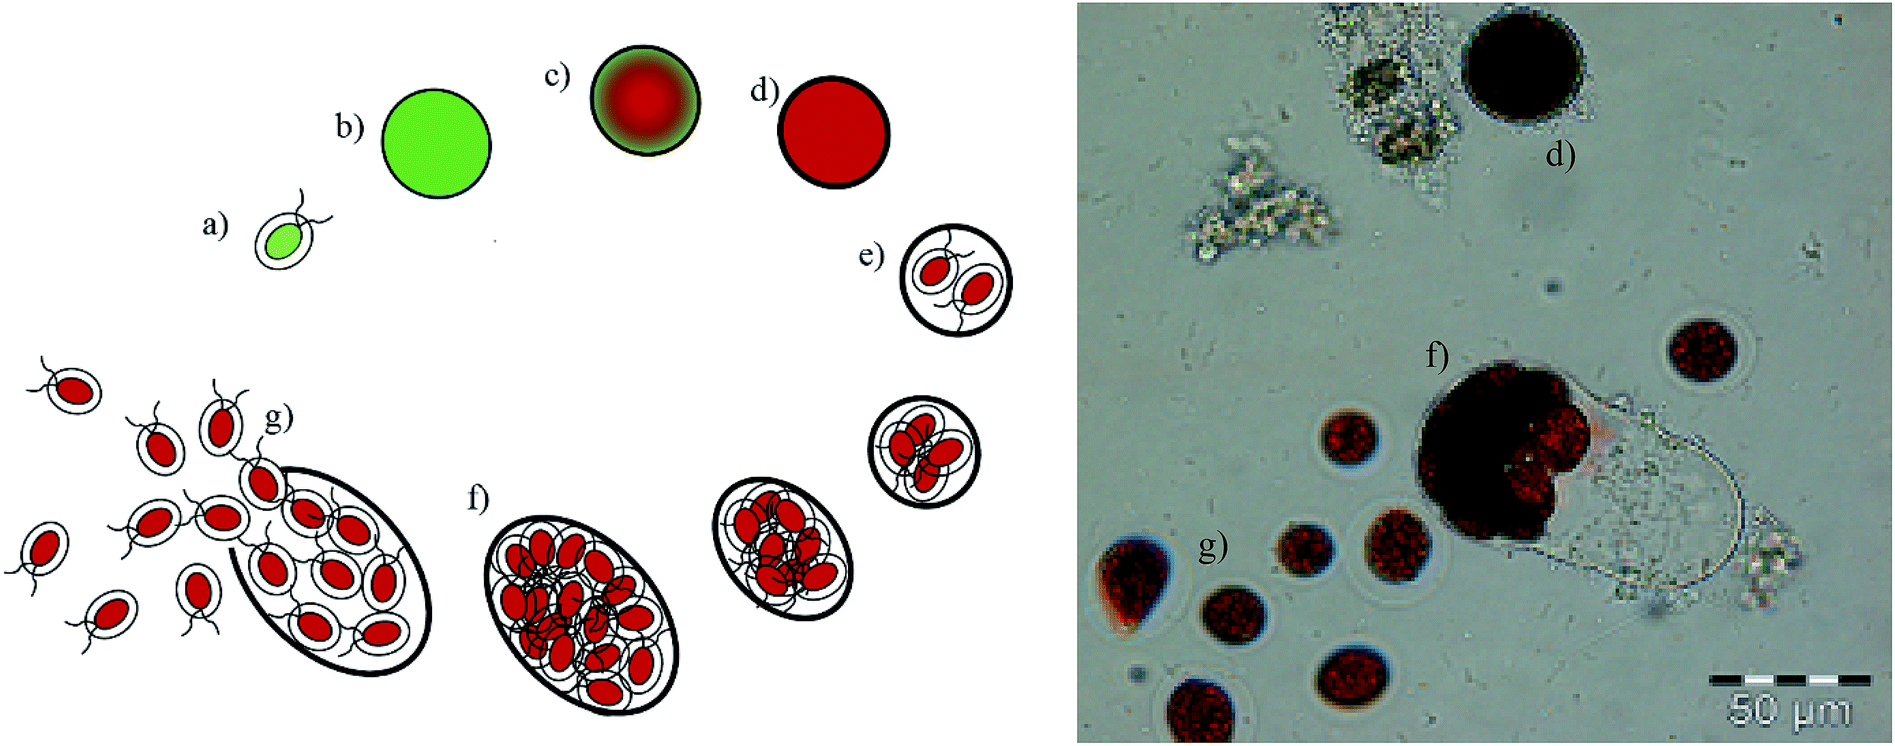 | ||
| Fig. 2 Proliferation of H. pluvialis: (a) motile, flagellated cell, (b) aplanospore, (c) astaxanthin-accumulating aplanospore, (d) red cyst cell, (e) formation of a sporangium, (f) sporangium in the final stage, (g) zoospores released from the sporangium. | ||
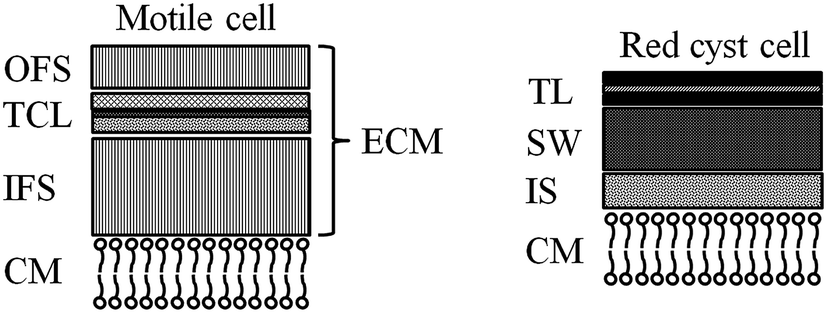 | ||
| Fig. 3 Structure of the motile zoospore cell wall: CM: cell membrane, IFS: inner fibrillar strata, TCL: tripartite crystalline layer, OFS: outer fibrillar strata, ECM: extracellular matrix. Structure of the red cyst cell: CM: cell membrane, IS: interspace, SW: secondary wall, TLS: trilaminar sheath. | ||
When red cyst cells are exposed to favourable growth conditions again, a new life cycle begins through sporangium formation, as shown in Fig. 2e for red cyst cells. The sporangium swells (Fig. 2f) until the cell wall breaks, releasing motile, flagellated cells (Fig. 2g).24,28 The cell cycle of H. pluvialis cysts and the occurrence of different morphologies of released zoospores were observed in 1899 by Hazen.29
Formation of the resistant cell wall in the cyst stage prevents direct astaxanthin extraction. This is why the described, complex downstream process is necessary in industry.30 Inducing the germination and release of flagellated zoospores from the sporangium of the red H. pluvialis cysts allows direct astaxanthin extraction from the zoospores, e.g. into ionic liquids or organic solvents.12,30 Sun et al.30 showed that astaxanthin can be extracted directly from germinated red H. pluvialis cells into various organic solvents. For instance, extraction yields reaching 85% and astaxanthin concentrations of about 70 mg L−1 were achieved with the water-soluble solvent dimethyl sulfoxide (DMSO).30 Praveenkumar et al.12 extracted astaxanthin directly from germinated flagellated red zoospores into an ionic liquid. An extraction yield of 82% was reached with the ionic liquid [Emim]EtSO4 12 h after initiation of germination.12 These extraction experiments were performed on a laboratory scale. For industrial-scale extractions, where difficult phase separation is expected, mixer-settler systems or centrifugal extractors are used.31
Liquid–liquid chromatography units represent a suitable alternative to conventional centrifugal extractors. Liquid–liquid chromatography is a solid support-free chromatographic method based on the distribution of solutes between two liquid phases. One of the two liquid phases is held stationary in the unit by a centrifugal force. The other phase, the mobile phase, is pumped through the stationary phase. Through dispersion of the mobile phase into the stationary phase, solutes with lower partition coefficients travel faster through the column than those with higher partition coefficients. Depending on the partition coefficients of the solutes, solute separation or extraction can be achieved. If the partition coefficient of a solute is very high, the solute will take a long time to elute from the column. This situation is unfavourable for chromatographic separation but highly advantageous for extraction.32 Liquid–liquid chromatography units are classified as hydrodynamic countercurrent chromatography (CCC) and hydrostatic centrifugal partition chromatography (CPC) units. Numerous CCC columns have been developed over the years by Y. Ito and are described in detail in various publications.33–35 Most CCC systems are biaxial planetary coil centrifuges using open tubes wound around coils that rotate in a planetary motion. The planetary motion in the CCC coils changes the intensity and direction of the centrifugal field. In high centrifugal fields, phase demixing occurs, while during reversion of the centrifugal field, the two phases mix and allow mass transfer i.e. extraction of the target compound from one phase into the other.36,37 A CPC column is composed of alternately stacked annular plates and annular discs. Chambers are milled into the annular disks, and these chambers are linked by channels. Between two annular discs, an annular plate connects the last chamber of an annular disc with the next through a hole in the annular plate. Annular discs and annular plates are alternately placed on top of each other and mounted on the axis of a centrifuge. A centrifugal force is generated by rotation, and one phase is retained in the chambers (stationary phase, SP), while another phase (mobile phase, MP) is pumped through the column from chamber to chamber.38 If the mobile phase is the denser phase (this mode is called descending mode), or in centripetal direction if the mobile phase is the less dense phase (ascending mode).39
CPC units have been used successfully to extract carotenoids from algal and yeast cells. Marchal et al.40 used a CPC unit to extract β-carotene from Dunaliella salina using decane with 5% dichloromethane. After extraction and evaporation of dichloromethane, further cultivation of the extracted cells was possible.40 Ungureanu et al.41 extracted torularhodin from the yeast Rhodotorula rubra using a CPC unit. To make torularhodin accessible to the solvent, the cell wall was disrupted by three freeze–thaw cycles. To achieve this, the samples were frozen for 24 h and then heated to 50 °C prior to extraction with CPC.41
In this study, a new process for extracting astaxanthin from H. pluvialis is presented. A CCC unit is used to directly extract astaxanthin from zoospore-containing fermentation broth into a solvent. Thereby, the steps of mechanical cell wall disruption, drying and extraction with supercritical CO2 of the conventional astaxanthin downstream process can be replaced. Thus, a novel, simplified downstream process is established.
Materials and methods
Chemicals and solvents
The chemicals used to extract astaxanthin from the red cyst cells and zoospores, n-heptane (≥99.9%), ethyl acetate (EtOAc) (≥99.5%) and dichloromethane (DCM) (99.8%) were purchased from Merck KGaA (Germany), methyl-tert-butyl ether (MTBE) (>99.5%) from Honeywell (Israel) and butan-1-ol (≥99.8%) from VWR Chemicals (Germany). Deionised water was supplied by an in-house network. HPLC analysis was performed using Millipore 18 Mohm water, methanol (liquid chromatography grade) from VWR Chemicals (Germany) and MTBE (>99.5%) from Honeywell (Israel). The relevant physical properties of the solvents used in this study are reported in Table 1. Solvents were chosen according to their solubility in water, hydrophobicity (log![[thin space (1/6-em)]](https://www.rsc.org/images/entities/char_2009.gif) Poctanol/water) and enthalpy of vaporisation.
Poctanol/water) and enthalpy of vaporisation.
| Solubility in water/g L−1 | logPoctanol/water/— |
Enthalpy of vaporisation ΔvapH, (101.325 kPa, T = 25 °C)/kJ mol−1 | |
|---|---|---|---|
| n-Heptane | 0.0024 (at 25 °C) | 4.5 | 36.57 |
| Butan-1-ol | 80 (at 25 °C) | 0.84 | 52.35 |
| Methyl-tert-butyl ether (MTBE) | 44 (at 20 °C) | 0.84 | 29.82 |
| Ethyl acetate (EtOAc) | 87.9 (at 25 °C) | 0.73 | 35.60 |
| Dichloromethane (DCM) | 17.6 (25 °C) | 1.25 | 28.82 |
Microalgae and culture medium
Haematococcus pluvialis (SAG number 192.80) was obtained from the Culture Collection of Algae at the University of Göttingen, Germany. Bold Modified Basal Medium (BBM) was used as culture medium. This was prepared by diluting 20 mL BBM freshwater nutrient solution (50 × concentrate) from Sigma-Aldrich (Germany) with 980 mL deionised water, obtaining the following composition (per litre): 11.42 mg H3BO3, 25.0 mg CaCl2·2H2O, 0.49 mg Co(NO3)2·6H2O, 1.57 mg CuSO4·5H2O, 50.0 mg EDTA (free acid), 4.98 mg FeSO4·7H2O, 75 mg MgSO4·7H2O, 1.44 mg MnCl2·4H2O, 0.71 mg MoO3, 0.003 mg NiCl2·6H2O, 31.0 mg KOH, 0.003 mg KI, 175.0 mg KH2PO4, 75 mg K2HPO4, 25 mg NaCl, 250.0 mg NaNO3, 0.002 mg Na2SeO3, 0.001 mg SnCl4, 0.0022 mg VOSO4·3H2O and 8.82 mg ZnSO4·7H2O. Additionally, 1.64 g of sodium acetate (molecular biology grade, >99.0%) from VWR Chemicals (Germany) was added to the medium. The pH of the culture medium was 6.8.Cultivation and encystment of H. pluvialis
Parts of the H. pluvialis colonies were transferred from an agar plate into a 250 mL Erlenmeyer flask, and 150 mL culture medium was added. The culture was cultivated on a shaking plate at 175 rpm for 16 days at 24 °C until an optical density of 0.6 at 750 nm (OD750) was reached. Light was continuously supplied by one cool fluorescent lamp with a light intensity (photon flux density) of 50 μmoL m−2 s−1. The broth was subsequently transferred into a 2000 mL Erlenmeyer flask, which was filled up with fresh culture medium (working volume 1600 mL) and incubated under the same conditions for 14 days. This broth was used as an inoculum to cultivate 8 litres with an initial OD750 of 0.1 in a self-designed open pond. Water loss by evaporation was compensated for once every 24 h by adding distilled water. The open pond was illuminated continuously using two cool fluorescent lamps with a light intensity (photon flux density) of 100 μmoL m−2 s−1 at 24 °C for 14 days. The photon flux intensity was then increased to 300 μmoL m−2 s−1 for 10 days to enrich the cyst cells with astaxanthin. The OD750 was measured with a SPECORD 50 Plus spectrophotometer from Analytik Jena (Germany).Inducing zoospore release from the H. pluvialis cyst cells
To induce zoospore release from H. pluvialis cyst cells, 300 mL of the cyst culture broth was transferred into a 500 mL Erlenmeyer flask and placed on the shaking plate (175 rpm) for 24 h at a light intensity (photon flux density) of 50 μmoL m−2 s−1 and 24 °C. This step was performed to ensure similar starting conditions for zoospore release experiments, as cysts stored for different times were used during the study. The broth was then centrifuged at 5500 rpm for 2 min, and the supernatant was discarded. The cyst biomass was suspended in 100 mL fresh culture medium to adjust the OD750 to 1 and transferred into a 250 mL Erlenmeyer flask.Optimum extraction time for zoospore release from H. pluvialis cysts
To determine the ideal time for extracting astaxanthin from the released zoospores, two cyst cell cultures (culture 1 and culture 2) with a time gap of 8 h were prepared as described above. One shake-flask extraction experiment was performed 0, 16, 24, 40, 48 and 64 h (culture 1) and 8, 32 and 56 h (culture 2) after fresh culture medium was added to the cysts, i.e. zoospore release was initiated. For the shake-flask experiments, aliquots of the broth were centrifuged for 5 min at 5500 rpm with a Sigma 3-16KL centrifuge from Sigma GmbH (Germany). Defined amounts of the supernatant were discarded to adjust the OD750 to 4. At each of the above time points, 1 mL of the algal broth with an OD750 of 4 was transferred into a 15 mL Falcon tube, 5 mL of MTBE was added and the mixture was intensively shaken for 30 min with a Multi Bio RS-24 shaker from Biosan (Latvia) at 24 °C. To separate the phases, the mixture was centrifuged for 2 min at 5500 rpm; 4 mL of the astaxanthin-rich MTBE phase was then withdrawn and evaporated with a Heidolph Hei-VAP rotary vacuum evaporator from Heidolph Instruments (Germany). The astaxanthin content in the extracts was quantified by HPLC.Determination of the biomass concentration
The dry weight (DW) biomass concentrations were determined in quadruplicate; 1 mL culture aliquot was transferred into 2 mL microcentrifuge tubes, centrifuged at 5500 rpm for 5 min and washed with distilled water. The distilled water was discarded after centrifugation at 5500 rpm, and the moist biomass was stored at −80 °C and lyophilised with an Alpha 3-4 LSCbasic freeze dryer from Martin Christ Gefriertrocknungsanlagen GmbH (Germany). The freeze-dried samples were weighed, and the biomass concentration was calculated.Astaxanthin quantification
To determine the astaxanthin content in the algal broth, 5 mg of the DW was disrupted with a mortar and pestle. The astaxanthin from the disrupted cells was extracted by adding 10 mL of DCM. The extraction was repeated three times until the cell debris was colourless. The astaxanthin-rich DCM extract was evaporated with the Heidolph Hei-VAP rotary evaporator and saponified for 3 h at room temperature in the dark using the method reported by Taucher et al.43 Accordingly, 2.25 mL of acetone, 0.25 mL of methanol and 0.5 mL of 0.05 M NaOH in methanol were added to the extracted astaxanthin. Afterwards, 3 mL petroleum ether was added. The mixture was washed with 3 mL of 10 wt% aqueous NaCl solution and centrifuged for 2 min at 5500 rpm. The lower phase was then discarded, and the washing step with the NaCl solution was repeated twice more. The organic phase was evaporated, and the extracted astaxanthin was dissolved in 3 mL of solvent B (methanol, MTBE, water, 8:89:3, v/v), which was used in the HPLC method, and filtered with a 0.22 μm disposable nylon syringe filter from Berrytec (Germany).
The de-esterified astaxanthin samples were analysed with an HPLC unit (LC-20AB, Shimadzu, Japan) with a diode-array detector (SPD-M20A, Shimadzu, Japan) using a YMC Carotenoid column (C30, 3 μm, 150 × 4.6 mm, YMC Co., Japan). As the mobile phase, solvent A (methanol, MTBE, water, 81:15:4, v/v) and solvent B (methanol, MTBE, water, 8:89:3, v/v) were used with the following gradient: 2% solvent B for 11 min, a linear gradient from 2% solvent B to 40% solvent B for 7 min, 40% solvent B for 6.5 min followed by a linear gradient to 100% solvent B for 2.5 min, 100% solvent B for 3 min, a linear gradient to 2% solvent B for 3 min, held for 7 min. The flow rate was 1 mL min−1, the injection volume was 10 μl and the column temperature was maintained at 22 °C. For the astaxanthin quantification, a calibration curve was established with an astaxanthin standard from Dr Ehrenstorfer GmbH (Germany). The signal of the diode-array detector was recorded at 478 nm. The limit of detection (LOD) and limit of quantification (LOQ) were calculated according to DIN 32645, using the calibration curve.44 The calculated values of the LOD and LOQ were 1.85 mg L−1 and 5.51 mg L−1. Low concentrated fractions were concentrated prior to HPLC analysis, to remain above the values of the LOD and LOQ.
Extraction of astaxanthin with a countercurrent chromatography unit
Astaxanthin extraction experiments were performed on a CCC unit, model HPCCC-Mini Centrifuge with a column volume of 18.2 mL (0.8 mm i.d. and a β value between 0.5 and 0.78) from Dynamic Extractions (Wales). Two isocratic pumps, model 306 50C, from Gilson (USA), equipped with an 806 Manometric Module (Gilson, USA) were used to deliver the mobile and stationary phases. CCC extraction experiments were conducted using MTBE as an extraction solvent. Accordingly, MTBE was stirred for two hours with the culture medium at 24 °C. The equilibrated biphasic system was split into an upper solvent-rich phase and a lower culture-medium-rich phase using a separatory funnel. The phases were degassed in a Bandelin Sonorex Digitec DT 512H ultrasonic bath from Bandelin Electronic GmbH & Co. KG (Germany).The process for extracting astaxanthin from the zoospores using the CCC unit proposed in this work is presented schematically in Fig. 4. The CCC unit was prepared by filling the column with the solvent-rich phase (the stationary phase). Rotation was set and the culture medium, saturated with MTBE (the mobile phase), was pumped in the descending mode with a defined flow rate (Fig. 4a). Depending on the set flow rate and rotational speed, a certain amount of stationary phase was displaced from the column. After hydrodynamic equilibrium was reached in the column, i.e. the stationary phase volume was constant, the biomass containing zoospores was injected into the column via an injection loop (Fig. 4b). The mobile phase was further pumped in the descending mode into the CCC column, the fermentation broth was dispersed and mixed with the solvent-rich phase and the astaxanthin from the zoospores was extracted into the solvent-rich phase (Fig. 4c and d). After a predefined switching time, tswitch, the stationary phase was pushed out of the column (Fig. 4e). This was achieved by changing the flow direction of the mobile phase, switching from the descending mode to the ascending mode. In Fig. 4g and f, the fractionated stationary phase is shown, numbered starting with the most concentrated fraction. Aliquots of the collected fractions were pipetted into round bottom flasks, evaporated and further processed to analyse the astaxanthin content using HPLC.
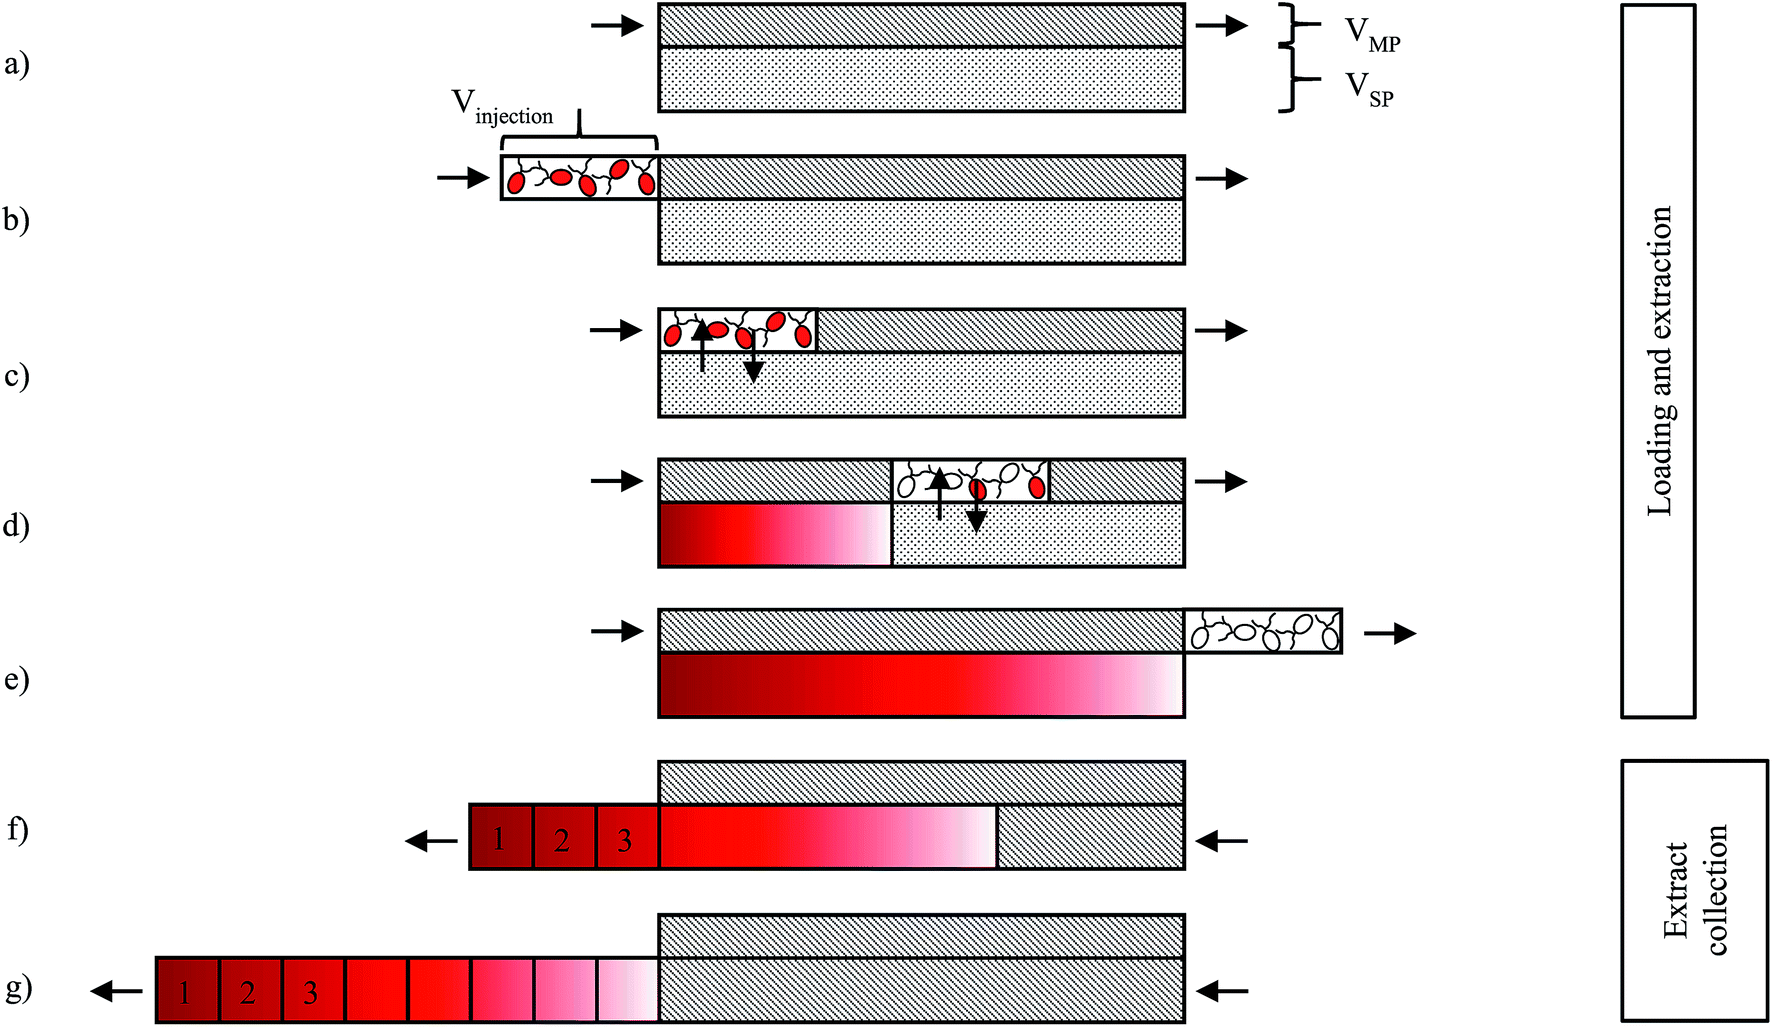 | ||
| Fig. 4 Scheme of the astaxanthin extraction process using a CCC column: (a) equilibration of the CCC column, (b) injection of algal broth, (c–e) extraction of astaxanthin from the zoospores into the solvent, (f) and (g) collection of astaxanthin-rich stationary phase (solvent). | ||
The shortest switching time, tswitch,0, was calculated according to eqn (1).
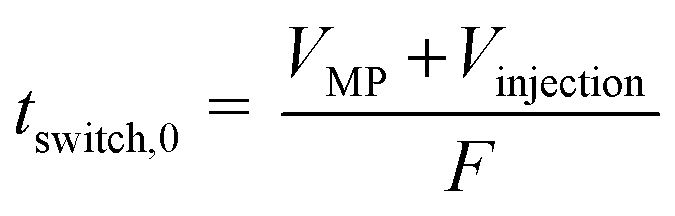 | (1) |
The volume fraction of the stationary phase in the column, called the stationary phase retention Sf, was calculated using eqn (2).
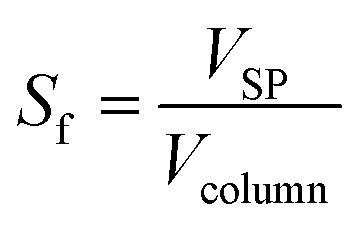 | (2) |
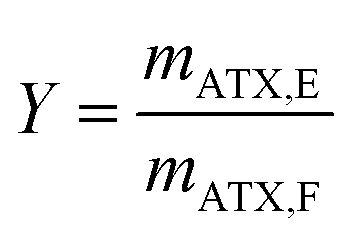
The yield Y is conventionally defined as the ratio of the astaxanthin mass mATX,E extracted into a solvent through the extraction process to the total amount of astaxanthin in the biomass injected in the column, i.e. in the feed, mATX,F.
 | (3) |
Astaxanthin cannot be extracted from cyst cells. Hence, the extracted amount of astaxanthin (mATX,E) in eqn (3) depends on the amount of released zoospores present in the algal broth, namely, the time for which the extraction experiments were performed. Therefore, to obtain more representative results, the yield Yextract, which considers the actual extractable amount of astaxanthin from the algal broth, was defined.
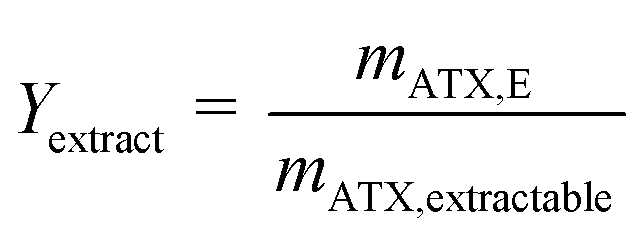 | (4) |
Results and discussion
Determination of the optimum extraction time
As mentioned above, direct astaxanthin extraction from H. pluvialis cyst cells using an organic solvent is impossible due to the thick cell wall. To overcome this problem, germination was induced by adding fresh culture medium to the red cyst cells. This led to release of zoospores with only a thin cell membrane and an extracellular matrix as a boundary to the environment (see Fig. 3). Direct astaxanthin extraction from these zoospores into a solvent is possible. As shown in the literature, induction of germination and zoospore release from H. pluvialis cysts or aplanospores is highly dependent on the cultivation conditions, particularly the medium composition and light intensity.12,24,27–29 Therefore, the optimum time for astaxanthin extraction must be determined for the cultivation conditions used in this work. This was done by shaking 1 mL of the algal broth with an OD750 of 4 with 5 mL of MTBE in a Falcon tube for 30 minutes at the shown time intervals and subsequently centrifuged. The astaxanthin content in the algal broth, mATX,F, before the extraction, the extracted amount of astaxanthin, mATX,E, and the corresponding yield Y for different extraction times, i.e. the time after induction of germination of the cyst cells by adding a fresh medium, are presented in Fig. 5. The optimal time for extracting astaxanthin from the released zoospores was determined to be between 24 and 32 h after fresh culture medium was added to the cyst cells. In this time frame, the yield reached approximately 60%. At 40 h, the yield decreased to 31% and then to 17%, 64 h after germination was induced. The astaxanthin content in the algal broth remained constant within the investigated time range. The decrease in the yield after 32 h was caused by morphological changes in the motile zoospores. After 32 h, the number of zoospores that lost their flagella and became non-motile again increased. As reported for green motile H. pluvialis zoospores,25,26 the transformation into non-motile cyst cells is accompanied by the formation of a primary wall, a trilaminar sheath and a secondary wall. While zoospore cells can be stained with aniline blue (789.91 g mol−1) in lactophenol, the trilaminar sheath was found to be a barrier to this dye.25 trans-Astaxanthin has a molecular weight of 596.85 g mol−1 and represents around 5% of the astaxanthin in H. pluvialis. The astaxanthin mono- and diester have molecular weights of 855 to 1128 g mol−1 and represent 95% of the astaxanthin in H. pluvialis. They are larger than aniline blue and consequently cannot pass the trilaminar sheath. This is consistent with the results at t = 0 h (only H. pluvialis cysts available) where, with yields of around 3%, almost no astaxanthin was extracted from the cyst cells. The time span before the motile zoospores became non-motile again was reported to range from only few hours26 to seven days,27 but is strongly dependent on the chosen culture conditions.24 Consequently, germination for the subsequent extraction experiments was planned for 24 to 32 h after initiation.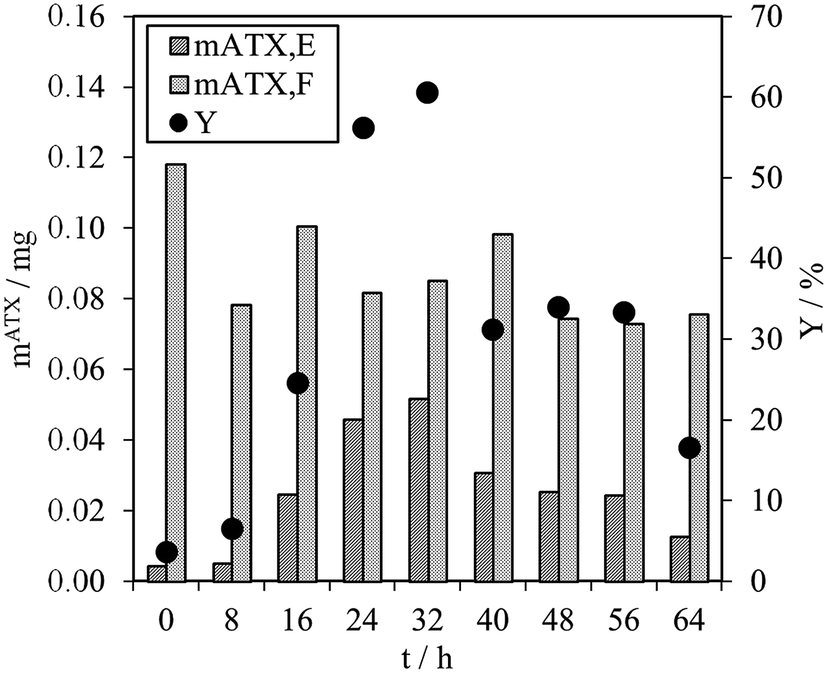 | ||
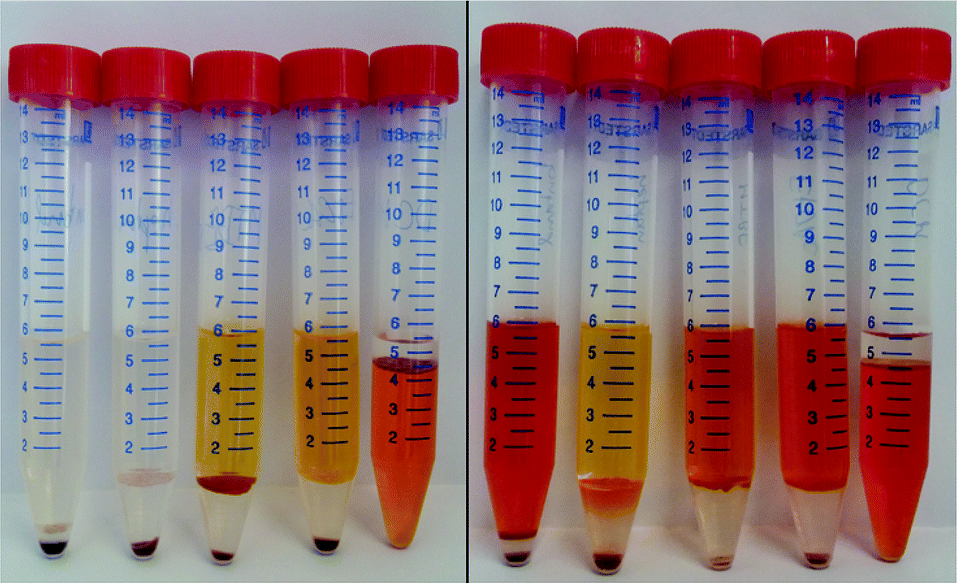
| Fig. 5 Shake-flask experiments with the solvents butan-1-ol, n-heptane, MTBE, EtOAc and DCM (from left to right) with cyst cells and 24 h after germination was induced by adding new culture medium to the H. pluvialis cysts. | ||
Solvent selection
After determining the optimal time for astaxanthin extraction from the released zoospores, the solvent for extraction with a CCC column must be selected. In the proposed extraction process (see Fig. 4), the solvent is used as a stationary phase and retained inside the column using a centrifugal field. Hence, ideally the solvent should fulfil the following criteria: it should show high stationary phase retention in the column at high flow rates, so that a large amount of astaxanthin can be extracted per extraction run. The solvent should be almost immiscible with water in the fermentation broth. It should be able to extract astaxanthin from the cytoplasm of the released zoospores. Additionally, it should have a low evaporation enthalpy to allow low-cost solvent recovery.For this study, n-heptane, butan-1-ol, EtOAc, MTBE and DCM were tested for their ability to extract astaxanthin from the released zoospores. The use of green solvents allows environmentally friendly liquid–liquid extraction processes to be established.45 According to the ‘Pfizer Solvent Selection Guide’, EtOAc and butan-1-ol are ranked as ‘preferred’, n-heptane and MTBE as ‘usable’ and DCM as ‘undesirable’ solvents.46,47 The ability of the solvents to extract astaxanthin were tested using cells in the cyst stadium and 24 h after germination was induced by adding a fresh medium to the cyst cells. Fig. 6 shows the distribution of astaxanthin between the solvents butan-1-ol, n-heptane, MTBE, EtOAc and DCM, after mixing 5 mL of each solvent with 1 mL algal broth at the mentioned time points. The astaxanthin concentration in the solvents was determined and the corresponding yield (Y) was calculated. The yields for all tested solvents were below 1% when the cells were in the cyst stadium. The yield for the extraction was highest with EtOAc (85%) 24 h after inducing germination. The order of the yields achieved with the tested solvents was as follows:
| [EtOAc, 85%] > [DCM, 76%] > [MTBE, 49%] > [butan-1-ol, 44%] > [n-heptane, 2%] |
 | ||
| Fig. 6 Astaxanthin content in the algal broth mATX,F (before the extraction), in the solvent mATX,E (after the extraction) and 24 h after new culture medium was added to the cyst cells, i.e. germination was induced. Solvents (from left to right): butan-1-ol, n-heptane, MTBE, EtOAc and DCM. | ||
In contrast to the reported yield of 65% for astaxanthin extraction from wet germinated H. pluvialis cells with n-hexane,30 almost no astaxanthin extraction from released H. pluvialis zoospores was possible with n-heptane in our study. This was due to the poor solubility of n-heptane (as well as n-hexane) in water (see Table 1), resulting in poor contact between the water-rich H. pluvialis zoospore phase and the solvent. Conversely, when dewatered biomass is used, sufficient contact of the biomass with n-hexane might be possible. The relatively low yield with butan-1-ol could be due to the high solubility of water in this solvent (around 20 wt% at 20 °C), which might limit the capacity of the solvent for non-polar astaxanthin. Also, the high viscosity (2.57 mPas at 25 °C) of butan-1-ol may reduce diffusion into the cell.
Considering the obtained yields and its classification as a green solvent, EtOAc is the most promising solvent for extraction with a countercurrent chromatography unit. At a flow rate of 1 mL min−1 and a rotational speed of 1900 rpm, the EtOAc-rich phase could not be retained in the CCC column used in this study. The EtOAc/water system is reported in the literature to be extremely stable as a result of the ratio of its interfacial tension to density difference between the phases. This parameter ratio is commonly used in liquid–liquid chromatography for describing the flow regime.48 Additionally, the EtOAc water system has an extremely low bond number of 0.03. This dimensionless value sets the gravitational force that acts on a liquid in relation to the surface tension force. For small bond numbers, the dispersed droplets are stable. Consequently, the droplets tend to be less dispersed in the stationary phase, causing the mobile phase to displace the stationary phase from the column.48 Therefore, MTBE was chosen as solvent for the extraction over DCM and butan-1-ol as the former is ‘undesirable’ with respect to green solvent classification and the latter has a low vapor pressure (13.3 mbar at 30 °C), which makes it difficult to evaporate after extraction. It is noteworthy that the stationary phase retention is column-specific (type, design and size). For example, the EtOAc-rich phase shows good retention in centrifugal partition chromatographic columns49 and hence should not be excluded as a potential solvent for extracting astaxanthin from algal broth.
CCC experiments
After the solvent selection, the operating parameters for the astaxanthin extraction from the germinated H. pluvialis cells must be selected. The flow rate and rotational speed influence the stationary phase retention and dispersion of the mobile phase in the stationary phase, i.e. the germinated cells (zoospores) in the solvent-rich phase.32,41 Variations in the rotational speed (1500 and 1900 rpm) and flow rate (0.5 and 1.0 mL min−1) were initially investigated to determine the stationary phase retention, defined by eqn (2).As shown in Table 2, applying the highest rotational speed of 1900 rpm and the lowest flow rate of 0.5 mL min−1 used in this study results in the largest stationary phase retention of 72.53%. A decrease in the rotational speed to 1500 rpm at a flow rate of 0.5 mL min−1 only resulted in a slight decrease in the stationary phase retention to 71.43%. At a certain flow rate, increasing the rotational speed does not further increase the stationary phase retention.50 At 1900 rpm, an increase in the flow rate to 1.0 mL min−1 decreased the stationary phase retention to 64.3%. A hydrodynamic equilibrium exists between the mixing and demixing zones of the countercurrent chromatographic column, when the residence time of the mobile phase equals the settling time of the two phases. Consequently, by increasing the flow rate, the residence time of the mobile phase was reduced and more stationary phase was discharged from the column.51 An even larger decrease in the stationary phase retention from 71.4% to 43.4% could be observed when the flow rate was increased from 0.5 to 1.0 mL min−1 at a rotational speed of 1500 rpm. Due to the weaker gravitational field acting on the stationary phase at 1500 rpm compared to that at 1900 rpm, an increase in the flow rate causes a larger loss of the stationary phase at 1500 rpm than at 1900 rpm. Generally, in countercurrent chromatography, at a fixed rotational speed, the stationary phase retention decreases linearly with the square root of the flow rate.52
| ω/rpm | F/mL min−1 | Sf/% |
|---|---|---|
| 1900 | 1.0 | 64.3 |
| 1900 | 0.5 | 72.5 |
| 1500 | 1.0 | 43.4 |
| 1500 | 0.5 | 71.4 |
For the process, a high flow rate and stationary phase retention are preferred. High flow rates allow good dispersion of the mobile phase in the stationary phase, enhancing the mass transfer of astaxanthin into the solvent. Due to the low stationary phase retention of 43.41% at 1500 rpm and 1.0 mL min−1, the influence of the flow rate on the yield Yextract and the astaxanthin concentration in the extracted fractions was determined only at 1900 rpm for 0.5 and 1.0 mL min−1.
Under each of the two operating conditions (0.5 mL min−1 and 1900 rpm, 1.0 mL min−1 and 1900 rpm), 2 mL of the biomass containing zoospores with an OD750 of 4 (cDW = 13.25 g L−1) was injected, after equilibrating the column with culture medium (saturated with MTBE). After time tswitch,0, calculated according to eqn (1), the flow direction of the mobile phase was changed by switching from the descending to the ascending operating mode (see Fig. 4e and f). Fractions of 0.5 mL were collected until the MTBE-rich stationary phase was pushed out of the column.
The astaxanthin concentrations in each fraction were determined by HPLC and are presented in Fig. 7. The astaxanthin concentrations in the fractions collected during the experiments performed using a rotational speed of 1900 rpm and a flow rate of 1.0 mL min−1 were higher than those performed with a flow rate of 0.5 mL min−1. All collected fractions were analysed with HPLC to determine the extracted amount of astaxanthin, mATX,E. A yield Yextract of 83% was reached for a mobile phase flow rate of 1 mL min−1, while Yextract was only 43% for a flow rate of 0.5 mL min−1. The lower yield may be due to reduced mixing and mass transfer of astaxanthin from the zoospores into the solvent at lower flow rates. Thus, the following experiments were performed at a flow rate of 1 mL min−1 and a rotational speed of 1900 rpm.
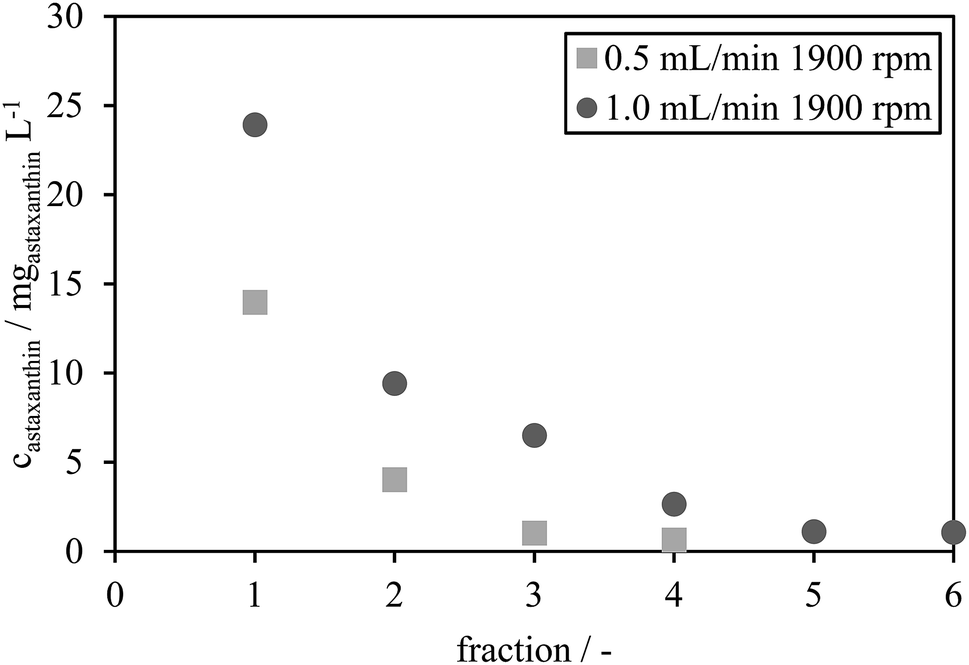 | ||
| Fig. 7 Astaxanthin concentration of the collected fractions under the two operating conditions (0.5 mL min−1 and 1900 rpm, 1.0 mL min−1 and 1900 rpm). | ||
To study the influence of the switching time on the extraction process (Fig. 4e and f), the time for switching from the descending to ascending mode was extended. For each of the two injection volumes, 0.5 and 2.0 mL, three experiments were performed with switching times equal to tswitch,0 and for two longer switching times, tswitch, shown in Table 3.
| Vinjection/mL | tswitch,0/min | tswitch/min | |
|---|---|---|---|
| 0.5 | 6.9 | 18.9 | 36.9 |
| 2.0 | 8.4 | 20.4 | 38.4 |
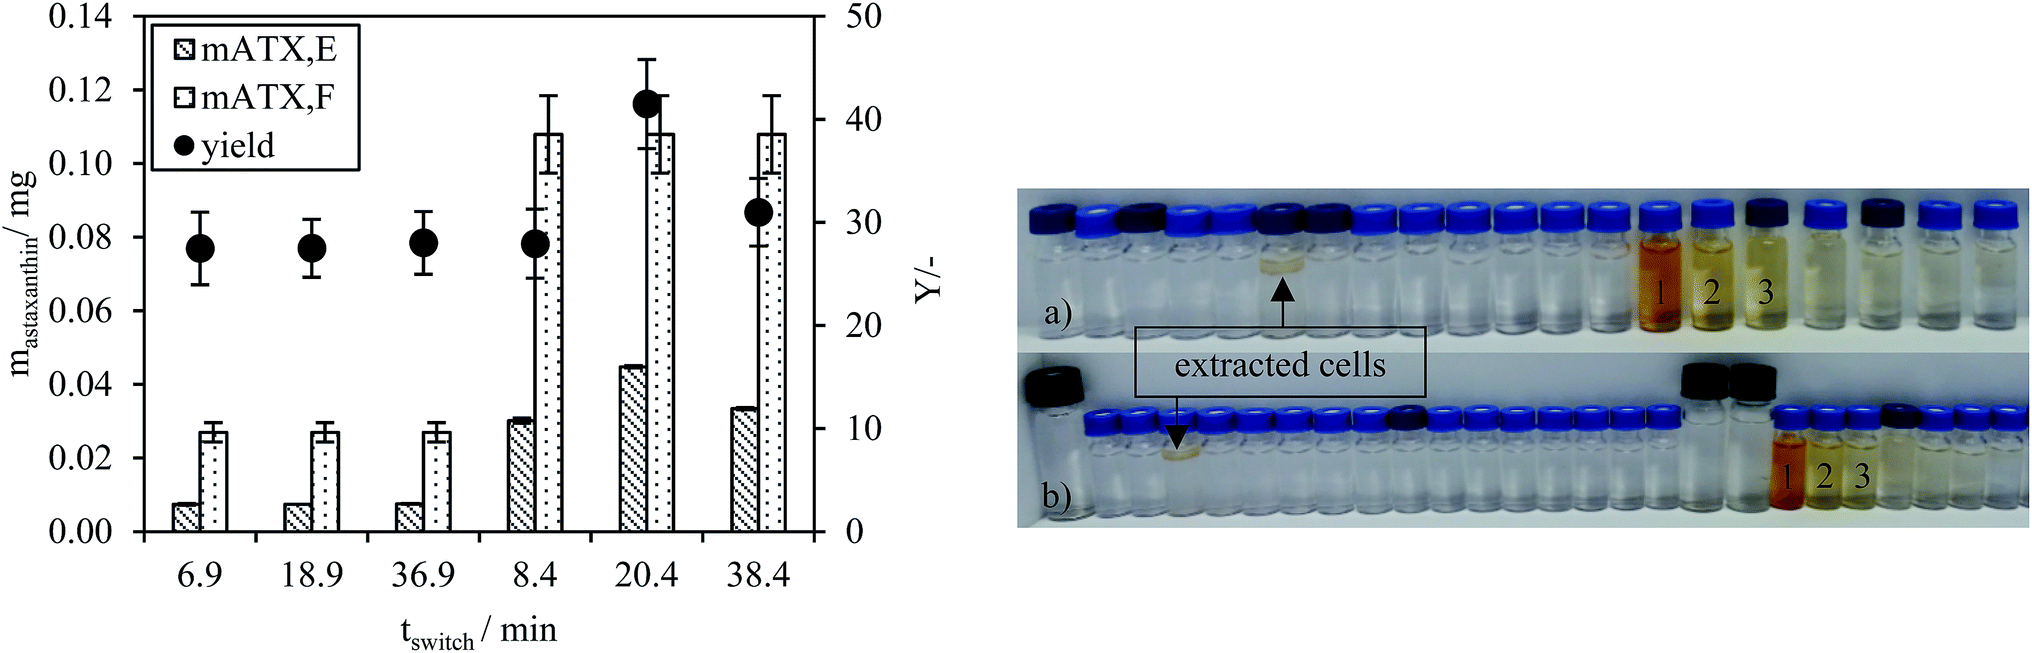
The astaxanthin content in the injected biomass (zoospores) mATX,F, the astaxanthin content in the collected fractions mATX,E and the yield Y are presented in Fig. 8a. Except for a switching time of 20.4 min, where a yield of about 40% was reached, yields of around 30% were achieved for all other switching times. The deviation at 20.4 min is due to experimental error during preparation of the extract for HPLC analysis, as many steps are required for the sample preparation. The collected fractions for an injection volume of 0.5 mL and switching times of 18.9 and 36.9 min are presented in Fig. 8a and b. The astaxanthin concentrations measured in the first collected fraction were 5.6 and 5.04 mgastaxanthin L−1 for switching times of 18.9 and 36.9 min. The concentrations in fractions 2 and 3 were determined with UV/VIS spectroscopy at 478 nm as one 16th and one 30th of the concentration in the first fraction. The constant yields achieved for different switching times show that tswitch,0 (time needed for the extracted cells to leave the column) is sufficient for the extraction. Therefore, in the following experiments, a switching time tswitch,0 (eqn (1)) was used to ensure low process times. The concentration profiles of the collected fractions show that large parts of the solvent are not loaded with astaxanthin. Thus, in subsequent experiments, the objective was to increase the astaxanthin concentration in the collected fractions by increasing the injection volumes to 2, 5 and 10 mL. The astaxanthin concentrations of the injected zoospore-containing fermentation broth and in the collected fractions after extraction are presented in Fig. 9. In this experiment, a fermentation broth composed of germinated cells with an OD750 of 4 was used. The astaxanthin concentration in the algal broth was 65 mgastaxanthin L−1. The concentration of astaxanthin in the first collected fraction increased from 47 to 507 mgastaxanthin L−1 with an increase in the injection volume from 2 to 10 mL. For the 10 mL injection volume, an eight-fold increase in the astaxanthin feed concentration was obtained in the first fraction. The average concentration of astaxanthin in all collected fractions (total stationary phase volume) was 90 mgastaxanthin L−1. This concentration exceeded the highest concentration achieved by Sun et al.30 for extracting astaxanthin from wet biomass, where the highest concentration of around 75 mgastaxanthin L−1 was obtained with a solvent mixture of dimethyl sulfoxide/acetone (4:1, v/v). The productivity, calculated as the mass of extracted astaxanthin per unit column volume and unit time, increased from 0.034 gastaxanthin L−1 h−1 (Vinjection = 2 mL) to 0.071 gastaxanthin L−1 h−1 (Vinjection = 5 mL) and 0.086 gastaxanthin L−1 h−1 (Vinjection = 10 mL). The yield Y was around 70% in all experiments.
 | ||
| Fig. 8 (Left) Extracted amount of astaxanthin mATX,E, the mass of astaxanthin in the injected feed mATX,F and the yield Y for injection volumes of 0.5 and 2.0 mL and different times, tswitch. (Right) Collected fractions of the CCC experiments with (a) an injection volume of 0.5 mL (tswitch = 18.9 min) and (b) an injection volume of 0.5 mL (tswitch = 36.9 min). | ||
 | ||
| Fig. 9 Astaxanthin concentrations reached in the first, second and remaining fractions of the three injection volumes, 2, 5 and 10 mL, as well as the injected astaxanthin concentration of the algal broth. | ||
Conclusion
The astaxanthin accumulation in the microalgae H. pluvialis is accompanied by the synthesis of a rigid cell wall, which prevents direct dye extraction from the cell. Thus, complex downstream processing is necessary in the current industrial process. This involves harvesting of the biomass by centrifugation, mechanical cell disruption, drying and supercritical astaxanthin extraction with CO2.14In this study, an industrially scalable liquid–liquid extraction method allowing direct astaxanthin extraction from H. pluvialis zoospores from a fermentation broth into a solvent is presented. The process concept was tested using a lab-scale column. A study of the influence of the process operating parameters was performed to better understand the process governing phenomena and parameters. The solvents EtOAc, MTBE, DCM and butan-1-ol were able to extract astaxanthin from the zoospore containing algal broth in shake-flask experiments. Unfortunately, stationary phase retention could not be obtained with the green solvent EtOAc in the CCC unit used in this investigation. Therefore, MTBE was selected for the extraction experiments instead. It is likely that the process can be transferred to a different liquid–liquid chromatography unit in which EtOAc could be used instead.
In choosing the operating parameters, a compromise must be found between a large stationary phase retention of the solvent in the unit and the dispersion of the algal broth in the solvent. A prolongation of the extraction time beyond the time needed for elution of the extracted cells from the column did not result in an increase of the yield, only in a longer process time. By increasing the injection volume, the productivity of the process could be significantly increased, attaining astaxanthin concentrations up to 500 mg L−1 in the collected fractions.
Assuming a column volume of 12.5 L and a stationary phase retention of 60% at a flow rate of 1 L min−1, a total process time of around 48 min can be estimated including filling of the column with solvent, equilibration of the column with the mobile phase, loading and extraction time and emptying of the column for fractionation. A capacity of 11.25 kg astaxanthin can be processed, assuming an astaxanthin solubility of 500 mgastanxthin Lsolvent−1 and 2400 working hours (300 working days of 8 h).
The use of a liquid–liquid extraction plant would allow astaxanthin extraction at the H. pluvialis production site, avoiding transport of dried biomass to a third-party service provider for supercritical CO2 extraction. Admittedly, when using solvents, an additional process step must be included for their recovery by distillation or disposal by incineration. The proposed process is an interesting option for small and new market participants, as it excludes mechanical cell disruption, drying and supercritical extraction with CO2.
With this study, a proof of concept of an alternative extraction process for the downstreaming of H. pluvialis was demonstrated. Currently, we are working on transferring the process concept to a preparative-scale liquid–liquid chromatographic column and optimising the process conditions for the germination of H. pluvialis. Additionally, a cost analysis will be performed to calculate the process economic feasibility.
Conflicts of interest
No conflict of interest to declare.Acknowledgements
We acknowledge Ference Raab and Michael Schobesberger for carrying out part of the experiments. Andreas Bauer is supported by a fellowship granted by the Foundation of German Business (sdw). This work was supported by the German Research Foundation (DFG) and the Technical University of Munich within the funding programme Open Access Publishing.Notes and references
- L. Waldenstedt, J. Inborr, I. Hansson and K. Elwinger, Anim. Feed Sci. Technol., 2003, 108, 119–132 CrossRef CAS.
- M. M. Shah, Y. Liang, J. J. Cheng and M. Daroch, Frontiers in Plant Science, 2016, 7, 531 Search PubMed.
- R. R. Ambati, S. M. Phang, S. Ravi and R. G. Aswathanarayana, Mar. Drugs, 2014, 12, 128–152 CrossRef PubMed.
- M. Bennedsen, X. Wang, R. Willén, T. Wadström and L. P. Andersen, Immunol. Lett., 2000, 70, 185–189 CrossRef.
- B. S. Kamath, B. M. Srikanta, S. M. Dharmesh, R. Sarada and G. A. Ravishankar, Eur. J. Pharmacol., 2008, 590, 387–395 CrossRef CAS PubMed.
- K. Uchiyama, Y. Naito, G. Hasegawa, N. Nakamura, J. Takahashi and T. Yoshikawa, Redox Rep., 2002, 7, 290–293 CrossRef CAS PubMed.
- R. Otton, D. P. Marin, A. P. Bolin, C. Santos Rde, T. G. Polotow, S. C. Sampaio and M. P. de Barros, Chem.-Biol. Interact., 2010, 186, 306–315 CrossRef CAS PubMed.
- B. Chew, J. Park, M. Wong and T. Wong, Anticancer Res., 1999, 19, 1849–1853 CAS.
- R. Nakao, O.L. Nelson, J. S. Park, B. D. Mathison, P. A. Thompson and B. P. Chew, Anticancer Res., 2010, 30, 2171–2175 CAS.
- P. Palozza, C. Torelli, A. Boninsegna, R. Simone, A. Catalano, M. C. Mele and N. Picci, Cancer Lett., 2009, 283, 108–117 CrossRef CAS PubMed.
- Astaxanthin Market Analysis By Source (Natural[Yeast, Krill/Shrimp, Microalgae] And Synthetic), By Product (Dried Biomass/Powder, Oil, Soft gels, Liquid), By Application, And Segment Forecasts, 2014 - 2025, https://www.grandviewresearch.com/industry-analysis/global-astaxanthin-market, accessed 2018.01.10, 2018.
- R. Praveenkumar, K. Lee, J. Lee and Y. K. Oh, Green Chem., 2015, 17, 1226–1234 RSC.
- R. T. Lorenz and G. R. Cysewski, Trends Biotechnol., 2000, 18, 160–167 CrossRef CAS PubMed.
- A. Richmond, Handbook of Microalgal Culture: Biotechnology and Applied Phycology, 2004 Search PubMed.
- G. Panis and J. R. Carreon, Algal Res., 2016, 18, 175–190 CrossRef.
- N. Uduman, Y. Qi, M. K. Danquah, G. M. Forde and A. Hoadley, J. Renewable Sustainable Energy, 2010, 2, 012701 CrossRef.
- H. C. Greenwell, L. M. Laurens, R. J. Shields, R. W. Lovitt and K. J. Flynn, J. R. Soc., Interface, 2010, 7, 703–726 CrossRef CAS PubMed.
- A. Golberg, M. Sack, J. Teissie, G. Pataro, U. Pliquett, G. Saulis, T. Stefan, D. Miklavcic, E. Vorobiev and W. Frey, Biotechnol. Biofuels, 2016, 9, 94 CrossRef PubMed.
- E. M. Grima, E. H. Belarbi, F. G. A. Fernandez, A. R. Medina and Y. Chisti, Biotechnol. Adv., 2003, 20, 491–515 CrossRef.
- L. Brennan and P. Owende, Renewable Sustainable Energy Rev., 2010, 14, 557–577 CrossRef CAS.
- J. J. Milledge, Doctoral thesis, University of Southampton, Faculty of Engineering and the Environment, 2013.
- B. Nobre, F. Marcelo, R. Passos, L. Beirao, A. Palavra, L. Gouveia and R. Mendes, Eur. Food Res. Technol., 2006, 223, 787–790 CrossRef CAS.
- N. Igl and J. Schulmeyr, https://www.nateco2.de/images/Downloads/posterbarcelona2008.pdf, accessed 2019.04.08, 2019.
- C. H. Zhang, J. G. Liu and L. T. Zhang, Chin. J. Oceanol. Limnol., 2017, 35, 1205–1211 CrossRef.
- C. Hagen, S. Siegmund and W. Braune, Eur. J. Phycol., 2002, 37, 217–226 CrossRef.
- A. Montsant, A. Zarka and S. Boussiba, Mar. Biotechnol., 2001, 3, 515–521 CrossRef CAS PubMed.
- K. Grünewald, C. Hagen and W. Braune, Eur. J. Phycol., 1997, 32, 387–392 CrossRef.
- A. Triki, P. Maillard and C. Gudin, Phycologia, 1997, 36, 190–194 CrossRef.
- T. E. Hazen, Memories of the Torrey Botanical Club, 1899, vol. 6, pp. 211–244 Search PubMed.
- H. Sun, B. Guan, Q. Kong, Z. Geng and N. Wang, Sci. Rep., 2016, 6, 20578 CrossRef CAS PubMed.
- H. J. F. Klaus Sattler, Thermal Separation Processes, 1994 Search PubMed.
- A. Berthod, J. Liq. Chromatogr. Relat. Technol., 2007, 30, 1447–1463 CrossRef CAS.
- Y. Ito, J. Chromatogr. A, 2005, 1065, 145–168 CrossRef CAS PubMed.
- Y. Ito and J. Sandlin, J. Chromatogr., 1982, 244, 247–258 CrossRef CAS.
- Y. Ito, J. Biochem. Biophys. Methods, 1981, 5, 105–129 CrossRef CAS PubMed.
- Y. Ito and W. D. Conway, Crit. Rev. Anal. Chem., 1986, 17, 65–143 CrossRef CAS.
- Y. Ito and R. L. Bowman, Science, 1970, 167, 281–283 CrossRef CAS PubMed.
- J. Goll, G. Audo and M. Minceva, J. Chromatogr. A, 2015, 1406, 129–135 CrossRef CAS PubMed.
- N. Mekaoui and A. Berthod, J. Chromatogr. A, 2011, 1218, 6061–6071 CrossRef CAS PubMed.
- L. Marchal, M. Mojaat-Guemir, A. Foucault and J. Pruvost, Bioresour. Technol., 2013, 134, 396–400 CrossRef CAS PubMed.
- C. Ungureanu, L. Marchal, A. A. Chirvase and A. Foucault, Bioresour. Technol., 2013, 132, 406–409 CrossRef CAS PubMed.
- D. R. Lide, CRC Handbook of Chemistry and Physics, Internet Version 2005, Boca Raton, FL, 2005 Search PubMed.
- J. Taucher, S. Baer and P. Schwerna, J. Thermodyn. Catal., 2016, 7, 7 Search PubMed.
- DIN 32645:2008-11, Chemische Analytik - Nachweis-, Erfassungs- und Bestimmungsgrenze unter Wiederholbedingungen - Begriffe, Verfahren, Auswertung.
- C. Capello, U. Fischer and K. Hungerbuhler, Green Chem., 2007, 9, 927–934 RSC.
- K. Alfonsi, J. Colberg, P. J. Dunn, T. Fevig, S. Jennings, T. A. Johnson, H. P. Kleine, C. Knight, M. A. Nagy, D. A. Perry and M. Stefaniak, Green Chem., 2008, 10, 31–36 RSC.
- Green chemistry at Pfizer.
- A. P. Foucault, E. C. Frias, C. G. Bordier and F. L. Goffic, J. Liq. Chromatogr., 1994, 17, 1–17 CrossRef CAS.
- S. Adelmann, C. Schwienheer and G. Schembecker, J. Chromatogr. A, 2011, 1218, 6092–6101 CrossRef CAS PubMed.
- S. Roehrer and M. Minceva, Chem. Eng. Res. Des., 2019, 143, 180–189 CrossRef CAS.
- C. Schwienheer, J. Merz and G. Schembecker, J. Chromatogr. A, 2015, 1390, 39–49 CrossRef CAS PubMed.
- A. Berthold, Countercurrent Chromatography: The Support-Free Liquid Stationary Phase, 2002 Search PubMed.
| This journal is © The Royal Society of Chemistry 2019 |