
 Open Access Article
 This Open Access Article is licensed under a Creative Commons Attribution-Non Commercial 3.0 Unported Licence
Synergetic effects of graphene–CoPc/silk fibroin three-dimensional porous composites as catalysts for acid red G degradation†
Hui Ma ,
Huanxia Zhang,
Mingqiong Tong,
Jianda Cao and
Wen Wu*
,
Huanxia Zhang,
Mingqiong Tong,
Jianda Cao and
Wen Wu*
China-Australia Institute for Advanced Materials and Manufacturing, College of Material and Textile Engineering, Jiaxing University, Jiaxing, 314001, China. E-mail: 13967327877@163.com; Fax: +86-573-83640322; Tel: +86-573-83641175
First published on 9th August 2019
Abstract
The disposal of dye wastewater is one of the hotspots of scientific research. Upon combining the ability of graphene to accelerate the hydroxyl radical generation with the Fenton system, it has shown a faster degradation rate and can be recycled, showing greater degradation efficiency than the traditional dye treatment method. Herein, a catalytic system based on the regenerated silk fibroin (SF) gel integrated with cobalt tetraaminophthalocyanine (CoTAPc)-grafted-reduced graphene oxide (RGO) sheets were fabricated, and its catalytic activity was assessed via the degradation of acid red G (ARG) at varying catalyst and H2O2 dosages, pH values, and temperatures. The results revealed that the three-dimensional (3D) porous RGO-CoTAPc/SF gel exhibited a much stronger catalytic behavior than the other arbitrary components due to its high surface area and synergetic hydroxyl radical generation efficiency, with the dye removal ratio by RGO-CoTAPc/SF being higher in an acidic medium than in an alkaline medium. It also increases with the increase in temperature and RGO-CoTAPc/SF and H2O2 dosages. Further, the catalytic oxidation process of ARG was determined, and the possible degradation mechanism of ARG has been discussed. Our results suggest that the composite materials with high catalytic activity can provide a reference for future Fenton-like catalytic systems.
1. Introduction
In recent years, about 100 tons per year of dyestuffs have been discharged into the water system, from the textile industry, automobile industry, plastic industry and so on, which brings enormous pressure on the environment.1,2 The conventional treatment methods, include membrane filtration, adsorption, Fenton oxidation, phytoremediation, and electrolytic precipitation, which use metallophthalocyanines, TiO2, silver particles, graphene, and bacteria as main materials.3–8 Among these methods, the Fenton and Fenton-like oxidation, as one of the prospective wastewater treatment technologies, are particularly suitable for degrading the dyes into final simple and non-toxic products, such as H2O and CO2, which can hardly be degraded by other chemical reagents.9,10In the field of Fenton and Fenton-like systems, metallophthalocyanines (MPc) as analogous structures to metalloporphyrins, have been considered as promising catalysts in recent years.11,12 MPc is a two-dimensional 18-π electron aromatic macrocycle with a metal atom located at the central cavity, which leads to their high electron transfer ability, in addition to their thermal and chemical stabilities. The heterogeneous MPc-based catalysts have been widely developed to overcome the major drawbacks of metal leaching and non-recycling ability of homogeneous MPc system, by loading on solid supporters, such as TiO2, carbon nanotubes, cellulosic fibers (CFs), chitosan.13–16 Compared with the above carriers, the reduced graphene oxide (RGO), a conductive support to improve their electrocatalytic activity and stability, displays an ideal host for CoPc complexation through – stacking, electrostatic interaction, and hydrogen bonding.17,18 Yang et al. organized cobalt phthalocyanine (CoPc) onto/into graphene sheets through a strong π–π interaction between CoPc and graphene, and it showed a significant improvement in the electro-oxidation of dopamine.19 Wang et al. reported non-covalently graphene/iron(II) phthalocyanine hybrid (Gr/FePc) and used it for the photocatalytic degradation of phenols with enhanced activity.20 Liu et al. synthesized a novel FePc–Gr composite as a catalyst for the oxygen reduction reaction that exhibited high activity and good stability.21 Mukherjee et al. reported chemically synthesized graphene/CuPc nanotube composites, which exhibited a much stronger catalytic behavior for the degradation of rhodamine B than for the pristine CuPc nanotube.22 Therefore, the composite material, obtained by combining the graphene and Fenton system, is expected to improve the degradation efficiency of dyes profoundly.
Normally, the catalytic efficiency gets affected by the catalyst's structure, surface atomic arrangement, and coordination, etc. Therefore, methods to effectively construct the graphene and Fenton system composite materials play a key role.23 The formation of three-dimensional (3D) porous catalytic materials can effectively prevent MPc from aggregation and retain the high specific surface area that is necessary to achieve high catalytic efficiency. Further, the regenerated silk fibroin (SF) gel is considered to be an ideal 3D skeleton due to its large specific surface area and easy physical and chemical modifications. The silk fibroin consists of 18 amino acids and has a typical natural protein structure, which is favorable for dye adsorption and provides a reaction microenvironment for metallophthalocyanines to construct highly active catalysts.24 We do believe that the highly interconnected 3D network will facilitate electron transport, and the interpenetrating porous network will allow rapid ion transport. However, fewer reports are available on the usage of the degrading dye pollutants.
In summary, a flexible and porous 3D material was fabricated using Co-tetraamino phthalocyanine (CoTAPc), graphene oxide (GO), and silk fibroin (SF) as raw materials. In this system, the SF shapes the honeycomb frameworks, providing functional groups, such as –NH2, –COOH, and –SH, which could bind with dyes; CoTAPc undertook the catalytic entity, and GO was employed for the transfer of electrons. The morphology and structure of the hybrid material and its application for the degradation of acid red G were studied in detail. In addition, the recycling ability of the material was also determined. Furthermore, a proposed synergistic mechanism of the acid red G degradation by the GO–CoTAPc/SF composite has been presented here. Thus, the obtained materials can provide research ideas for designing new catalytic materials in the future.
2. Experimental part
2.1. Materials
Hexafluoroisopropanol (HFIP), 99.5%, Meryer (Shanghai) Chemical Technology Co., Ltd.; 1-(3-dimethylaminopropyl)-3-ethylcarbodiimide hydrochloride (EDC·HCl), 98.5%, klamar-reagent company; N-hydroxysuccinimide (NHS), 98%, klamar-reagent company; graphite powder (<30 μm) was purchased from the Sinopharm Chemical Reagent Co. Ltd., Shanghai; co-tetraamino phthalocyanine (CoTAPc) was a gift sample from Zhejiang Sci-Tech University; the regenerated silk fibroin (SF) was made from silkworm cocoons in our laboratory; hydrazine hydrate (HI), NaNO3, KMnO4, H2SO4 (98 wt%), and H2O2 (30 wt%) were of analytical grade and used as received.2.2. Preparation of RGO-CoTAPc/SF catalysts
Starting from the graphite powder, GO was synthesized by a modified Hummers' method.25 The resultant product was a stock GO aqueous suspension containing approximately 10 mg mL−1 GO. The hybrid catalysts, including RGO-CoTAPc and RGO-CoTAPc/SF, were prepared using the freeze-drying method. In a typical run, 7.5 mg of CoTAPc, a little amount of EDC·HCl and NHS were added to 10 mL of the obtained aqueous suspension of GO (10 mg mL−1), with the reaction mixture being stirred at 30 °C for 1 day. Then, 16.7 mL of SF (60 mg mL−1, dissolved in HFIP) was added to the above solution and a ternary mixture was obtained. The gel was then sonicated for 4 h to obtain a homogeneous gelation state. Brown GO–CoTAPc/SF gels were obtained after freeze-drying at −50 °C for 3 days. Subsequently, the obtained gels were crosslinked with ethanol steam and reduced by hydrazine hydrate. Another set of the bi-component nanocomposite was prepared following the same procedure as that for RGO-CoTAPc, CoTAPc/SF, and RGO/SF composites. The as-synthesized samples were used further for different characterizations and measurements (Scheme 1).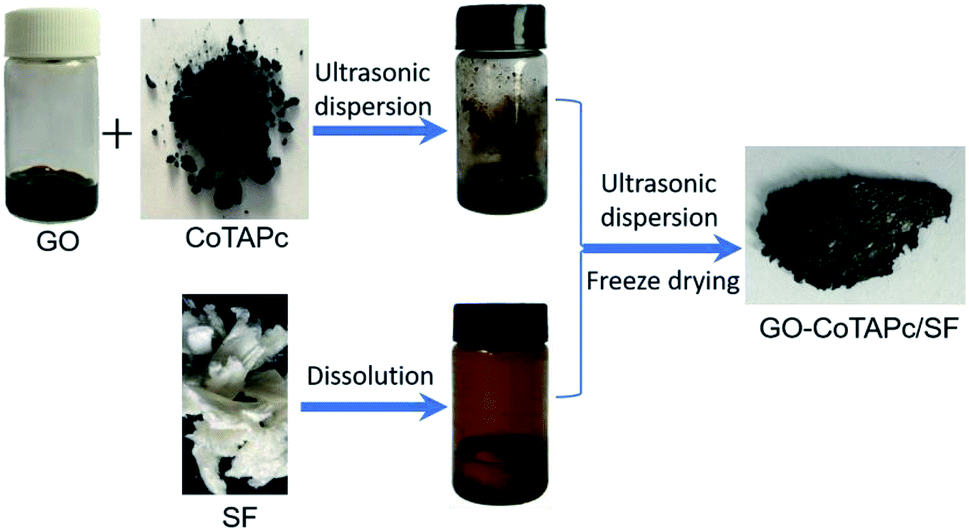 | ||
| Scheme 1 Illustration for the preparation of GO–CoTAPc/SF gels. | ||
2.3. Catalytic activity test
Acid red (ARG), an azo dye, was selected as an assessment system to investigate the catalytic activity of the RGO-CoTAPc/SF gels. Typically, 30 mg of RGO-CoTAPc/SF and 0.5 mmol H2O2 were added to a 10 mL of ARG (5 × 10⁻⁵ mol L−1) aqueous solution in a glass vial with a vibration rate of 100 rpm. During the catalytic tests, 3 mL of solution was taken in every 30 min and centrifuged to remove the catalyst. The supernatant was analyzed using a UV-vis spectrophotometer (Shimadzu UV-2550, Japan) at a wavelength of 510 nm. Further, the percentage of dye removal (R) of ARG was calculated using the following equation:where R represents the removal rate of ARG, and C0 and C are the initial concentration of ARG solution and concentration of remaining ARG solution at time t, respectively. A0 is the absorbance of the initial ARG solution, and A is the absorbance of the remaining ARG solution.

The effects of the mass and composition of the catalyst, temperature, pH, and the dosage of H2O2 on the ARG degradation rate were also studied.
2.4. Characterization
The as-synthesized products were characterized by scanning electron microscopy (SEM) (Hitachi S-4800, Japan) equipped with (EDS) energy dispersive X-ray spectroscopy and (WDS) wavelength dispersive X-ray spectroscopy, transmission electron microscopy (TEM) (Talos F200X, USA), and X-ray diffraction (XRD) (DX-2600 X-ray diffractometer with Cu Kα radiation). FT-IR spectra were recorded on a VERTEX 70 spectrometer. The specific surface area was measured using the Brunauer–Emmett–Teller (BET) method (NOVA 1000e, Quantachrome Instruments, USA) at liquid nitrogen temperature. For further characterization of the products obtained after ARG degradation by RGO-CoTAPc/SF, the samples were collected after 12 h. Further, these samples were centrifuged and the supernatant was collected and dried to carry out the analysis by high-performance liquid chromatography (HPLC) and mass spectrometry (MS) to distinguish the degraded products formed.3. Results and discussion
3.1. Characterizations of catalysts
TEM images (Fig. 1A and B) of GO and GO–CoTAPc clearly show that the graphene sheets stacked together with many wrinkles, thereby forming a thin transparent layer. Compared with GO sheets, the GO–CoTAPc composite exhibited a different morphology with many dark spots on the surfaces, indicating that the CoTAPc molecules were anchored on the GO sheets and had a relatively uniform particle size distribution. Besides, Co was detected on the surface of the GO–CoTAPc/SF gel by the energy-dispersive X-ray spectroscopy (EDX) (Fig. 1C). The above analysis indicated that both graphene and CoTAPc existed in the as-prepared composites. XRD was also employed to identify whether CoTAPc was grafted onto the graphene sheets. As shown in Fig. 1D, for GO, a sharp and strong diffraction peak appeared at 2θ = 10.4°, which corresponds to the interlayer distance of 0.84 nm, which indicated the good crystallization of the as-prepared GO.26 CoTAPc, tending to aggregate, exhibited a weak reflection at 2θ = 27.1°, corresponding to the stacking distance of 0.33 nm between the phthalocyanine moiety within the column.27 The intensity of the characteristic peaks of the GO–CoTAPc composite was lower than that of the pure GO, which may be attributed to the broadening of the inter-planar spacing due to the grafting of the CoTAPc molecules onto the graphene sheets. As for GO–CoTAPc/SF gel, the diffraction peak shifted up to 2θ = 11.6°, and the intensity of the peak further decreased due to the low percentage content and low crystallinity of GO in the GO–CoTAPc/SF sample. These observations indicate the amorphous structure of the as-prepared catalysts due to the insertion of SF and well dispersion of CoTAPc on the surface of the GO sheets. Comparative FTIR spectra of the samples are displayed in Fig. 1E. The spectra show the presence of various functional groups in GO sheets. The peak at 1713 cm−1 and 1618 cm−1 corresponds to the stretching vibrations of C![[double bond, length as m-dash]](https://www.rsc.org/images/entities/char_e001.gif) O and C–C. The peak at 1220 cm−1 was attributed to the bending and stretching vibrations of epoxy groups. The band located at 1041 cm−1 was related to the alkoxy group.28 For pure CoTAPc, the peak located at 1663 cm−1 was assigned to CO stretching vibrations. The vibrations of the skeleton structure of phthalocyanine were located at 1390, 1102, and 1061 cm−1.29 Compared with pure GO and pure CoTAPc, the red-shift of the CO carbonyl stretching vibration from 1713 cm−1 in GO to 1704 cm−1 in CoPc–GO was observed, and the new peaks appeared at 1415 and 1278 cm−1 in the GO–CoTAPc composite related to the C–N stretching modes.30 It suggests that CoTAPc was grafted onto the GO sheets through amide bond, and the synthetic procedure of CoTAPc–GO/SF is illustrated in Fig. 2B. In this study, the CoTAPc molecules were grafted onto GO through an amidation reaction between the carboxyl groups of GO and the amido groups of CoTAPc, and there also existed a π–π assembly between CoTAPc and graphene to form the GO–CoTAPc composite. The CoTAPc nanoparticles could be anchored on graphene closely by covalent bonding and π–π interactions, which would be beneficial for the oxygen reduction reaction.
O and C–C. The peak at 1220 cm−1 was attributed to the bending and stretching vibrations of epoxy groups. The band located at 1041 cm−1 was related to the alkoxy group.28 For pure CoTAPc, the peak located at 1663 cm−1 was assigned to CO stretching vibrations. The vibrations of the skeleton structure of phthalocyanine were located at 1390, 1102, and 1061 cm−1.29 Compared with pure GO and pure CoTAPc, the red-shift of the CO carbonyl stretching vibration from 1713 cm−1 in GO to 1704 cm−1 in CoPc–GO was observed, and the new peaks appeared at 1415 and 1278 cm−1 in the GO–CoTAPc composite related to the C–N stretching modes.30 It suggests that CoTAPc was grafted onto the GO sheets through amide bond, and the synthetic procedure of CoTAPc–GO/SF is illustrated in Fig. 2B. In this study, the CoTAPc molecules were grafted onto GO through an amidation reaction between the carboxyl groups of GO and the amido groups of CoTAPc, and there also existed a π–π assembly between CoTAPc and graphene to form the GO–CoTAPc composite. The CoTAPc nanoparticles could be anchored on graphene closely by covalent bonding and π–π interactions, which would be beneficial for the oxygen reduction reaction.
 | ||
| Fig. 1 (A) and (B) TEM images of GO and GO–CoTAPc, respectively; (C) the EDX spectrum of the as-prepared GO–CoTAPc/SF composite. (D) XRD of GO, CoTAPc, GO–CoTAPc, and GO–CoTAPc/SF; (E) the FTIR spectra of GO, CoTAPc, and GO–CoTAPc/SF hybrid. | ||
 | ||
| Fig. 2 (A)–(D) SEM images of CoTAPc, RGO, RGO/SF, and RGO-CoTAPc/SF, respectively. | ||
The microstructure of the hybrid gels was analyzed by SEM, and the images are shown in Fig. 2A–D. CoTAPc displayed a granular morphology,31 while RGO showed a macroporous structure with a thicker wall, which consists of folded graphene sheets with some wrinkles, as seen in the upper right picture in Fig. 2B.32 RGO/SF showed a porous structure with a smaller pore size and smooth surface (Fig. 2C). Compared with RGO/SF, the RGO-CoTAPc/SF hybrid presented the microporous inter-linked network with a thinner wall (Fig. 2D). Also, there were CoTAPc particles immobilized on the folded graphene sheets as seen from the high magnification photo in Fig. 2D. Such morphology is thought to be advantageous as it offers significantly increased surface area and open edge sites, which are much needed for catalysis.33,34 With the introduction of SF, the surface area of RGO/SF was increased to 392 m2 g−1 compared with 212 m2 g−1 of RGO. Due to the miniaturization and networking of the pores, the specific surface area of RGO-CoTAPc/SF was dropped to 63 m2 g−1, but it was still much higher than the 2 m2 g−1 of CoTAPc, as shown in Fig. S1.†
3.2. Catalytic properties of the catalysts
Typically, the dye removal gets affected by many factors, such as catalyst component, temperature, H2O2, and pH value. In detail, we studied the influence of these factors on the ARG dye removal.To investigate the effect of the catalyst component, the degradation was performed at an equivalent catalyst amount (49.43 mg SF, 18 mg RGO, and 2.59 mg CoTAPc in 70 mg RGO-CoTAPc/SF) and pH 7, with the dye concentration of 5 × 10⁻⁵ mol L−1. The curves of CoTAPc, RGO, RGO-CoTAPc, CoTAPc/SF, RGO/SF, and RGO-CoTAPc/SF versus time are shown in Fig. 3A, showing three different trends. The removal ratios of CoTAPc were determined to be only about 3.4%. RGO-CoTAPc showed the degradation activity for ARG, but not more than ∼40% of ARG was degraded in the measured period. The same phenomenon was found in the study of Co3O4/graphene as heterogeneous catalysts in Orange II degradation. However, the degradation efficiency significantly improved suggesting a synergistic catalytic activity of Co3O4 and graphene in the hybrid as it was more conductive than the individual semiconductor CoTAPc clusters because of the hybridization between Co-4d orbital and graphene-p orbital.35 curves of RGO/SF further revealed that the catalytic activities of the composite for ARG degradation were relatively high, as more than ∼60% of ARG was removed during 720 min. When 3D RGO-CoTAPc/SF gel was used, almost 100% of ARG degradation products were removed within 720 min. The results demonstrated that the catalytic efficiency of RGO-CoTAPc/SF was significantly improved due to the remarkable synergistic effect of the heterogeneous surface between CoTAPc, graphene sheets, and SF.
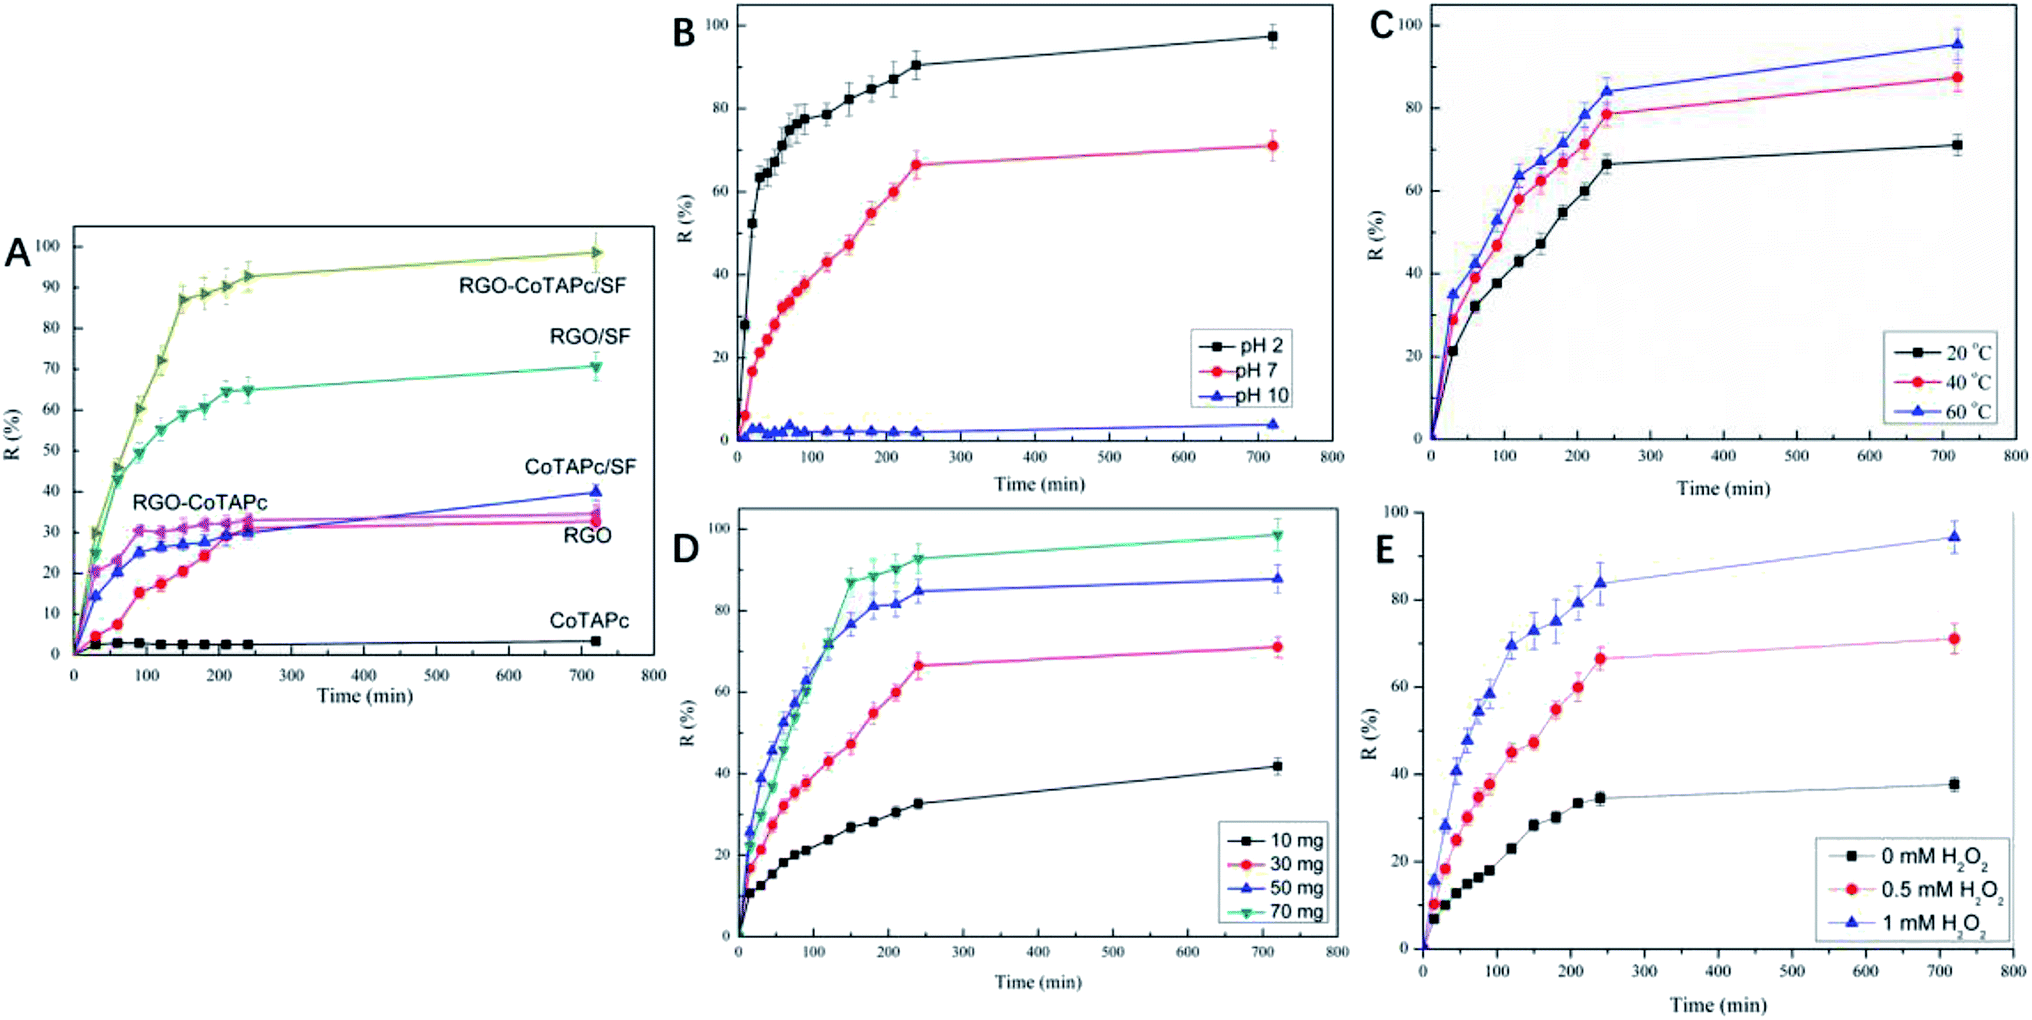 | ||
| Fig. 3 (A) Plot of the ARG removal by different samples (RGO-CoTAPc/SF 70 mg); (B) the pH effect on the degradation of ARG; (C) the temperature effect on the degradation of ARG; (D) the effect of the dosage of RGO-CoTAPc/SF on the degradation of ARG; (E) the effect of H2O2 on the degradation of ARG. Reaction conditions: ARG-10 mL (5 × 10⁻⁵ mol L−1), initial pH = 7 (nature pH), initial H2O2-0.5 mM, and RGO-CoTAPc/SF-30 mg, temperature-20 °C. | ||
Due to the high catalytic efficiency of RGO-CoTAPc/SF, the following reactions choose the hybrid of RGO-CoTAPc/SF as the catalyst. The removal of the products obtained after ARG degradation by RGO-CoTAPc/SF gel was significantly influenced by the pH of the reaction medium. 0.1 M HCl and 0.1 M NaOH solutions were used to adjust the pH in acidic and alkaline media of the reaction solution. The effect of pH on the removal of the products of ARG degradation in the presence of RGO-CoTAPc/SF composite is shown in Fig. 3B. It was obvious that the removal efficiency of RGO-CoTAPc/SF gel towards ARG increased with a decrease in the pH of the medium. At pH 2, the removal percentage of dye was 97.4%, which was higher than 71.1% in the neutral region (pH 7) and 3.9% at pH 10. This could be due to the change in the surface charges of the RGO-CoTAPc/SF gel, which was caused by the presence of various functional groups, such as amide, hydroxy, and carboxyl, which were distributed on the RGO-CoTAPc/SF gel surface. In an acidic medium, H+ ions were adsorbed, which in turn imparted NH3+ cationic properties to the gel surface. With the increase in the pH value, the surface of the catalyst gradually became negative due to the ionization of the –COOH groups in the presence of the OH− ions. ARG is an anionic azo dye molecule, and the interaction of the ARG molecules with the catalyst surface changed from the electrostatic attraction in the acidic medium to the electrostatic exclusion under high pH. The electrostatic attraction accelerates the degradation of dye molecules, whereas the electrostatic repulsion slows down the degradation of the dye molecules.36 Compared with the straight working pH value of 2.0–3.5 of the traditional homogeneous Fenton (Fe2+/H2O2) systems, our system works effectively in the 2–7 pH range.37,38
Usually, the catalytic reaction gets affected by temperature. To study the effect of temperature on the reaction, 20 °C, 40 °C, and 60 °C were set to study the effect of temperature on the removal of products obtained after ARG dye degradation, as shown in Fig. 3C. The catalytic efficiency towards ARG increased with the increase in temperature. Moreover, the degradation rates of ARG were determined to be 71.1%, 85.5%, and 95.4% under 20 °C, 40 °C, and 60 °C, respectively. On one hand, the diffusion of the dye molecules increased with the increase in temperature, which improved the catalytic efficiency by improving the contact of dyes and catalysts. On the other hand, increasing the compatible temperature would increase the rate of the catalytic reaction.39
The dosage of the RGO-CoTAPc/SF used in the reaction also affected the degradation process, as presented in Fig. 3D. It can be found that the percentage removal of the dye was increased with an increase in the catalyst amount, which reached 41.8%, 71.1%, 87.8%, and 96.3%. This result was due to the fact that as the catalyst amount increased, more dye adsorbed on the catalyst surface and the degradation efficiency was increased. An oxidant is another important factor that affects the removal of the products after degradation of the dye molecules. Thus, we compared the degradation removal without or with 0.25 mL H2O2, as shown in Fig. 3E. When H2O2 was added into the mixture solution, the degradation efficiency was enhanced from 71.4% to 94.3% at 720 min.
3.3. Reaction kinetics
As seen in Fig. 3D and E, the rate of degradation in the first 90 min was faster than in the later 120 min. In the whole degradation process, neither zero-order nor quasi-first-order kinetics can be used to fit the kinetics. Therefore, the pseudo-first-order kinetics was used to analyze the first 90 min and the remaining process, using the formula expressed as:ln(C0 − C/C0) = ln![[thin space (1/6-em)]](https://www.rsc.org/images/entities/char_2009.gif) R = kt + y R = kt + y |
Upon drawing lnR with t, as shown in Fig. 4A–D, the slope of the linear relation curve, i.e., the reaction rate constant k (k1 for the initial 90 min stage of degradation and k2 for the remaining catalyzing process) was obtained. The k values and the correlation coefficients (R2) are listed in Table 1.
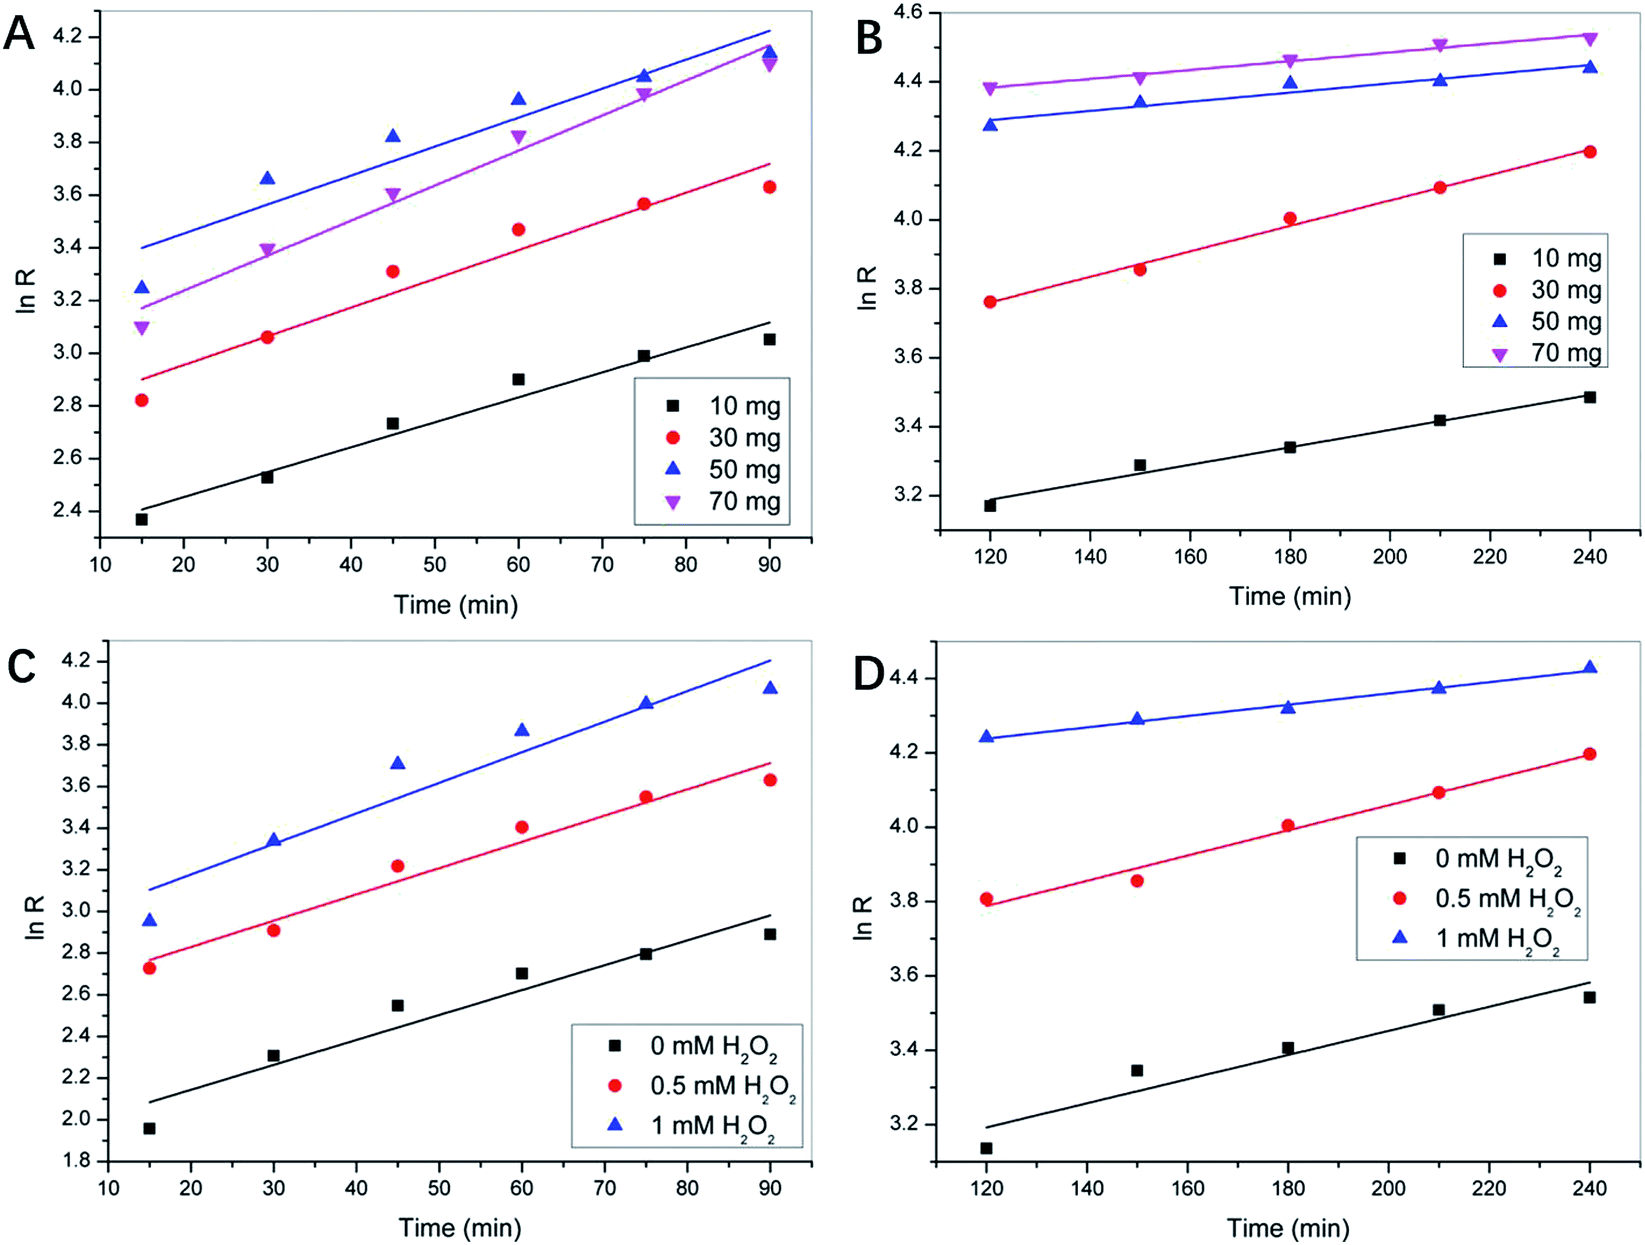 | ||
| Fig. 4 The plot of lnR with t, both at the initial stage that took place in the first 90 min of the reaction, and the remaining catalyzing process of different RGO-CoTAPc/SF dosage (A and B) and different H2O2 usage (C and D). | ||
| Catalyst dosage (mg mL−1) | H2O2 concentration (mM) | Rate constant k1 × 102 (min−1) | R2 | Rate constant k2 × 102 (min−1) | R2 |
|---|---|---|---|---|---|
| 1 | 0.5 | 0.947 | 0.957 | 0.253 | 0.978 |
| 3 | 0.5 | 1.091 | 0.932 | 0.369 | 0.991 |
| 5 | 0.5 | 1.100 | 0.876 | 0.133 | 0.906 |
| 7 | 0.5 | 1.330 | 0.973 | 0.128 | 0.973 |
| 3 | 0 | 1.196 | 0.910 | 0.339 | 0.887 |
| 3 | 0.5 | 1.261 | 0.959 | 0.325 | 0.978 |
| 3 | 1 | 1.456 | 0.894 | 0.152 | 0.986 |
Typically, k1 obtained for 90 min of the reaction provides more information about the initial reaction rate, while k2 obtained for the last time interval of the reaction provides information about the equilibrium between the reactants and products.40 From the apparent rate constants, it can be seen that the ARG removal rate constants, i.e., k1 and k2 first increased and then decreased with an increase in the catalyst dosage from 1 to 7 mg mL−1, whether in the first 90 min or the remaining catalytic reactions. However, when the catalyst concentration in the system exceeded 5 mg mL−1, the degradation of ARG begun slower than at 3 mg mL−1 concentration due to the presence of enough Co(II) metal species in the solution at the beginning of the reaction. At the end of the reaction, when the catalyst concentration was 5 mg mL−1, the removal rate of ARG was similar to the rate obtained when the catalyst concentration was 7 mg mL−1, which indicated that the consumption rates of the Co(II) active species and OH− ions were the same. This may be due to the fact that the catalyst that did not appear in the equilibrium global chemical equation could also affect the reaction rate by reducing the activation energy, which led to the increase in k. The effect of hydrogen peroxide on the apparent reaction rate constant k1 was uniform and proportional to the concentration of hydrogen peroxide. When the concentration of hydrogen peroxide increased from 0 to 1 mM, the initial degradation rate increased from 0.097 to 0.121 min−1. For the remaining time interval of ARG degradation, the k2 value decreased with an increase in the concentration of H2O2. At the catalyst dosage of 3 mg mL−1, the dosage of 0.5 mM H2O2 had a positive effect on the degradation efficiency and rate of ARG, which was mainly due to the coordination of the proportion of catalyst, oxidant, and the target compound.
3.4. Degradation mechanism of dyes
According to the above results, a proposal of the catalytic mechanism was established, as shown in Fig. 5. The ARG molecules migrated from the bulk of the solution to the surface of the catalyst via H bond and π–π interactions between ARG and catalyst. Further, the heterogeneous Fenton-like reaction (eqn (1) and (2)) occurred through the RGO-CoTAPc/SF activated H2O2 to generate the HO˙ radical. According to H. GarcÍa, RGO exhibited high activity as Fenton catalyst generates the HO˙ radical due to the involvement of hydroquinone/quinone (–OH/O) subunits for H2O2 activation (eqn (3) and (4)).41 From the point of Ma, the electron transport pattern includes the transfer of electrons from the graphitic domain to the adsorbed/intercalated CoPc, and feedback from the Co ions through the ligand-like attacking of oxygen functional groups of GO to the central cobalt ions.42 Thus, the dual reaction centers were responsible for the conversion of H2O2 on the RGO-CoTAPc/SF surface, which would improve the ORR catalytic activity. Therefore, the degradation behavior of ARG could be catalyzed by the HO˙ radical, as illustrated by eqn (5)–(7). Besides these, the larger surface area and a variety of amino acid residues of the regenerated silk fibroin gel could benefit in trapping more ARG and active radicals. Therefore, the results indicate that each component of RGO-CoTAPc/SF plays an important role in the substantial enhancement of degradation efficiency that is the synergetic catalytic effect.
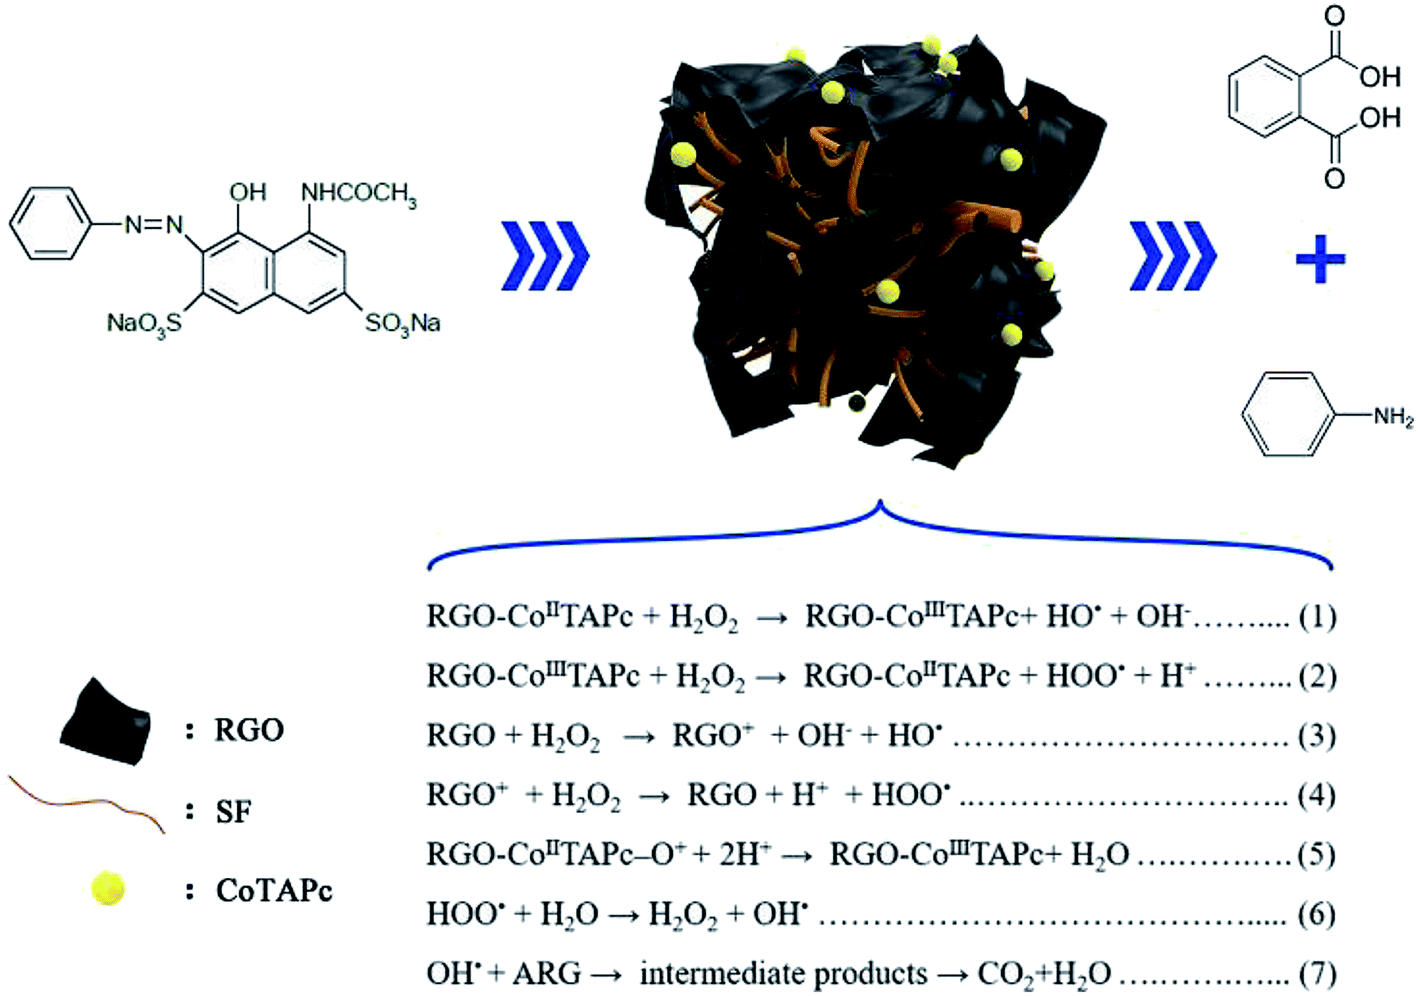 | ||
| Fig. 5 The proposed mechanism of the H2O2 activation by RGO-CoTAPc/SF for the ARG degradation. | ||
Furthermore, the GO–CoTAPc/SF sample was collected after 720 min to ascertain the degraded products of ARG by GO-TACoPc/SF. The samples were centrifuged and the precipitant was collected and dried to be analyzed via the FTIR spectroscopy. As shown in Fig. 6A, the signature peaks of ARG at 1600–1480 cm−1 were the skeleton structure of the benzene ring. The weak peak at 1450 cm−1 was associated with the stretching vibrations of NN group. Moreover, the strong peak at 1034 cm−1 was related to the –SO3− stretching mode.43 Compared with RGO-TACoPc/SF before usage for the ARG degradation, new peaks appeared at 1180 and 1100 cm−1 for GO-TACoPc/SF after usage, which was related to the asymmetric and symmetric stretchings of the SO42− bonds. The sharp and characteristic peaks of ARG disappeared/weakened, thereby affirming the degradation of ARG.
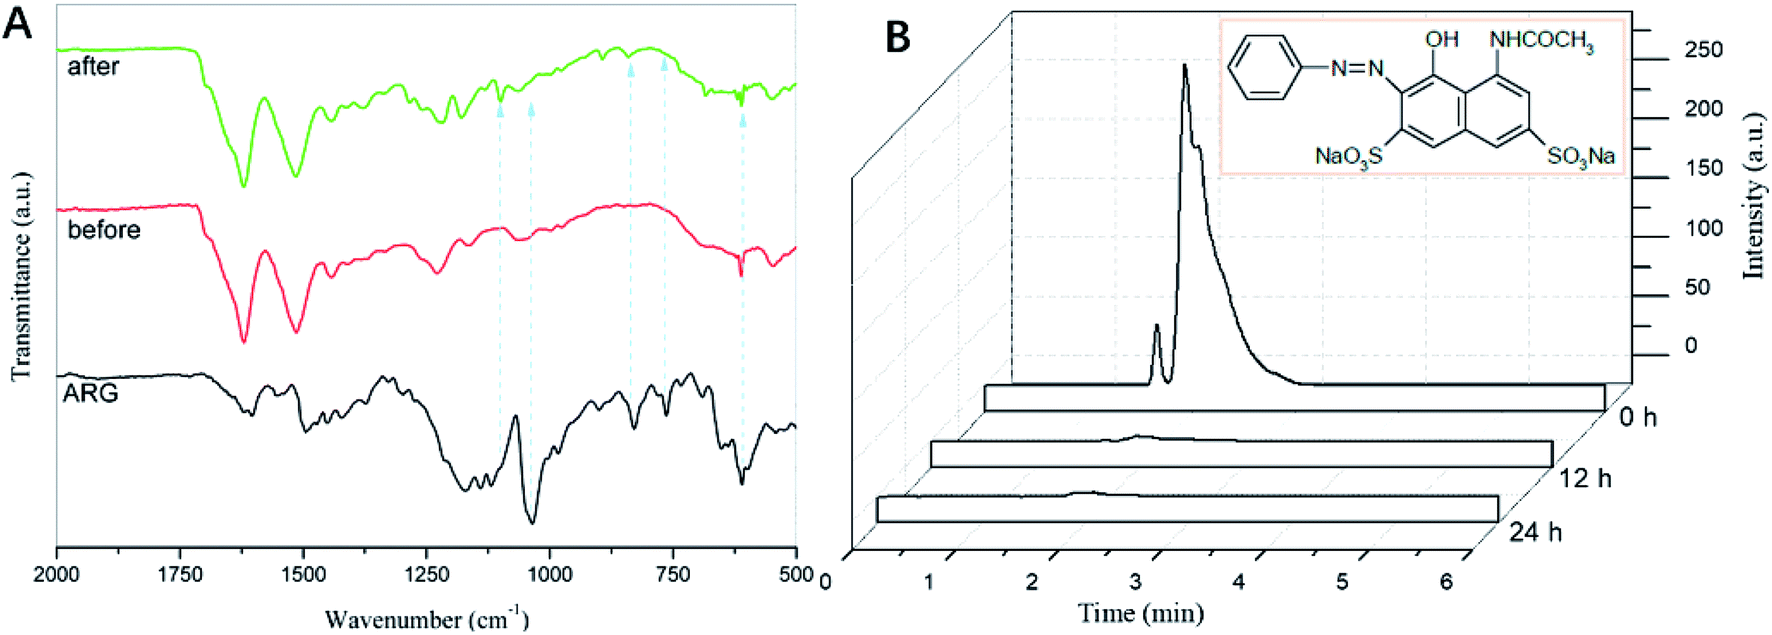 | ||
| Fig. 6 (A) FTIR spectra of ARG, RGO-TACoPc/SF (before used) and RGO-TACoPc/SF (after used); (B) comparative HPLC chromatogram of ARG, degraded products of ARG after 12 h and 24 h. | ||
High-performance liquid chromatography (HPLC) was also used to further identify the possible products, i.e., the oxidative intermediates of ARG in this catalytic system. The comparative HPLC chromatograms of ARG and ARG-GO–CoTAPc/SF (12 h and 24 h samples) are shown in Fig. 6B. The chromatogram of ARG shows a sharp peak at the retention time of 1.93 min. After 12 h of the ARG degradation by GO–CoTAPc/SF, it showed a decrease of up to ∼98% in the intensity of the main peak of the ARG molecules. In addition to the reduction in the peak intensity of ARG, two newer peaks were seen at the retention time of 2.41 min and 2.88 min, attributing to the initial degradation of the ARG. After 24 h of the analysis, we did not notice any peak related to the ARG, suggesting the complete degradation of the organic aromatic skeleton of ARG.
The oxidation products of ARG were also confirmed by mass spectrometry (MS), as shown in Fig. S2.† According to the relative molecular weight of the ARG dye, it can be seen that the high molecular weight of the original ARG dye in the solution was 512, as presented in Fig. S2A.† After 12 h of the reaction time, as shown in Fig. S2B,† the peak of 512 decreased and the peak of 96 increased. From the molecular structure of the ARG, we speculated that the degradation of the dye molecules can produce phenyl-ammonia, whose molecular weight was approximately 96. It is noteworthy to point out that the peak of 512 almost disappeared after 24 h of the reaction time, and the peak of 96 was clearly increased. In addition, a peak at 166 appeared, which is due to the formation of the product of phthalic acid, as shown in Fig. S2C.†44 It proved that several biodegradable low-molecular-weight organic acids were obtained due to the azo bond fracture.
3.5. Reusability study
The stability of the RGO-CoTAPc/SF composite catalyst is meaningful for their reusability in environmental technology. Therefore, repeated experiments were performed under identical conditions for the degradation of dye during a five-cycle. As shown in Fig. 7, the degradation rate of the RGO-CoTAPc/SF composite gel was declined from 97.36% to 90.34% after a five-cycle experiment, without no obvious variations. The result indicated that the RGO-CoTAPc/SF hybrid was a reusable catalyst in environmental technology. The Cornelia Marinescu's results also show that reduced graphene mainly plays a catalytic role in the degradation rather than in adsorption.39 Therefore, RGO-CoTAPc/SF can realize the recyclable catalyst.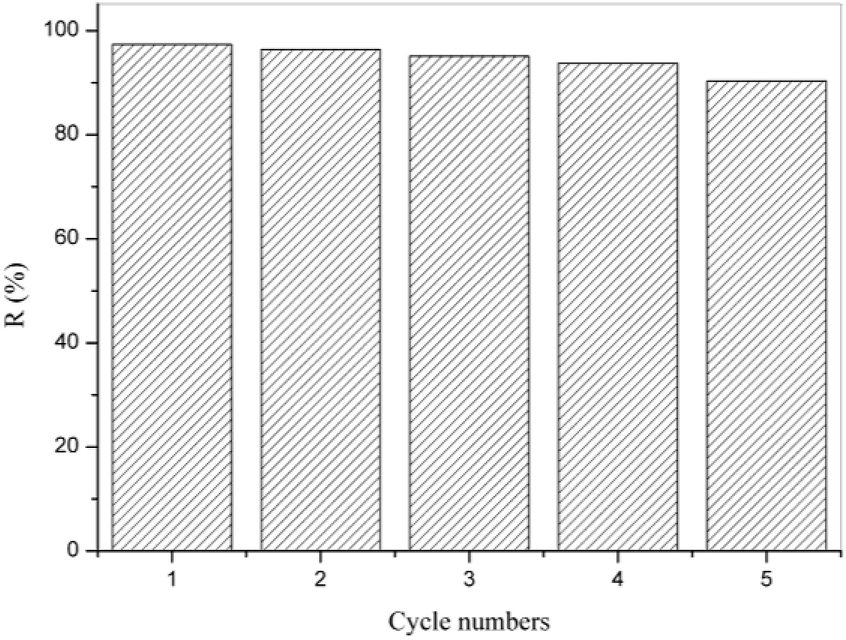 | ||
| Fig. 7 The recycling runs in the degradation removal of ARG. | ||
4. Conclusions
In our study, a new type of RGO-CoTAPc/SF with high catalytic activity was prepared. The results of SEM images show that the hybrid possesses network porous structure with a large specific surface area (63 m2 g−1). With an increase in the dosage of the composite materials, temperature, and the amount of H2O2, the degradation ratio of dyes was almost 100% within the range of pH 2–7 due to the synergetic effect of CoTAPc, RGO, and SF. In addition, the results of FTIR, HPLC, and MS showed that dyes were degraded in the presence of composite materials rather than via adsorption. The composites we have prepared have also been proved to be capable of dyestuff degradation after repeated use. Thus, our results show that a new type of catalyst can be designed by combining graphene, catalyst, and skeletons.Conflicts of interest
There are no conflicts to declare.Acknowledgements
We gratefully acknowledge the financial support from the National Natural Science Foundation of China (51703079 and 61704068).References
- L. Zhang, X. Li, M. R. Wang, Y. He, L. Chai, J. Huang, H. Wang, X. Wu and Y. Lai, ACS Appl. Mater. Interfaces, 2016, 8, 34638–34647 CrossRef CAS PubMed.
- A. I. Río del, C. García, J. Fernandez, J. Molina, J. Bonastre and F. Cases, Ind. Eng. Chem. Res., 2015, 54, 6418–6429 CrossRef.
- S. Navalon, M. Alvaro and H. Garcia, Appl. Catal., B, 2010, 99, 1–26 CrossRef CAS.
- M. A. M. Khraisheh, Y. S. Al-Degs, S. J. Allen and M. N. Ahmad, Ind. Eng. Chem. Res., 2002, 41, 1651–1657 CrossRef CAS.
- L. J. Zhao, J. T. Zhou, Y. H. Jia and J. F. Chen, J. Hazard. Mater., 2010, 181, 602–608 CrossRef CAS PubMed.
- S. K. Bhunia and N. R. Jana, ACS Appl. Mater. Interfaces, 2014, 6, 20085–20092 CrossRef CAS PubMed.
- A. R. Ribeiro, O. C. Nunes, M. F. R. Pereira and A. M. T. Silva, Environ. Int., 2015, 75, 33–51 CrossRef CAS PubMed.
- Y. Al-Degs, M. A. M. Khraisheh, S. J. Allen and M. N. Ahmad, Water Res., 2000, 34, 927–935 CrossRef CAS.
- A. D. Bokare and W. Choi, J. Hazard. Mater., 2014, 275, 121–135 CrossRef CAS PubMed.
- A. E. Ghaly, R. Ananthashankar and M. V. V. R. Alhattab, J. Chem. Eng. Process Technol., 2014, 5, 1–18 Search PubMed.
- S. K. Ling, S. B. Wang and Y. L. Peng, J. Hazard. Mater., 2010, 178, 385–389 CrossRef CAS PubMed.
- Z. F. Huang, H. W. Bao, Y. Y. Yao, W. Y. Lu and W. X. Chen, Appl. Catal., B, 2014, 154–155, 36–43 CrossRef CAS.
- A. Ebrahimian, M. A. Zanjanchi, H. Noei, M. Arvand and Y. Wang, J. Environ. Chem. Eng., 2014, 2, 484–494 CrossRef CAS.
- T. Mugadza and T. Nyokong, Synth. Met., 2010, 160, 2089–2098 CrossRef CAS.
- W. X. Chen, W. W. Lu, Y. Y. Yao and M. Xu, Environ. Sci. Technol., 2007, 41, 6240–6245 CrossRef CAS PubMed.
- C. Shen, S. Song, L. Zang, X. Kang, Y. Wen, W. Liu and L. Fu, J. Hazard. Mater., 2010, 177, 560–566 CrossRef CAS PubMed.
- P. V. Kamat, J. Phys. Chem. Lett., 2010, 1, 520–527 CrossRef CAS.
- N. M. Julkapli and S. Bagheri, Int. J. Hydrogen Energy, 2015, 40, 948–979 CrossRef CAS.
- J. Yang, D. Mu, Y. Gao, J. Tan, A. Lu and D. Ma, J. Nat. Gas Chem., 2012, 21, 265–269 CrossRef CAS.
- Q. L. Wang, H. Y. Li, J.-H. Yang, Q. Sun, Q. Y. Li and J. J. Yang, Appl. Catal., B, 2016, 192, 182–192 CrossRef CAS.
- Y. Liu, Y.-Y. Wu, G.-J. Lv, T. Pu, X.-Q. He and L.-L. Cui, Electrochim. Acta, 2013, 112, 269–278 CrossRef CAS.
- M. Mukherjee, U. K. Ghorai, M. Samanta, A. Santra, G. P. Das and K. K. Chattopadhyay, Appl. Surf. Sci., 2017, 418, 156–162 CrossRef CAS.
- Z. Zhang, J. Hao, W. Yang, B. Lu, X. Ke, B. Zhang and J. Tang, ACS Appl. Mater. Interfaces, 2013, 5, 3809–3815 CrossRef CAS PubMed.
- C. Cheng, Y. Yang, X. Chen and Z. Shao, Chem. Commun., 2008, 21, 5511–5513 RSC.
- W. S. Hummers and R. E. Offman, J. Am. Chem. Soc., 1958, 80, 1339 CrossRef CAS.
- S. Pei and H. Cheng, Carbon, 2012, 5, 3210–3228 CrossRef.
- M. Kimura, K. Wada, K. Ohta, K. Hanabusa, H. Shirai and N. Kobayashi, J. Am. Chem. Soc., 2001, 123, 2438–2439 CrossRef CAS PubMed.
- Z. Y. Sui, X. T. Zhang, Y. Lei and Y. J. Luo, Carbon, 2011, 49, 4314–4321 CrossRef CAS.
- B. Kadem, M. Göksel, A. Senocak, E. Demirbas, D. Atilla, M. Durmus, T. Basova, K. Shanmugasundaram and A. Hassan, Polyhedron, 2016, 110, 37–45 CrossRef CAS.
- Y. F. Xu, Z. B. Liu, X. L. Zhang, Y. Wang, J. G. Tian, Y. Huang, Y. Ma, X. Zhang and Y. Chen, Adv. Mater., 2009, 21, 1275–1279 CrossRef CAS.
- Z. Wang, X. Shen, M. A. Garakani, X. Lin, Y. Wu, X. Liu, X. Sun and J.-K. Kim, ACS Appl. Mater. Interfaces, 2015, 7, 5538–5549 CrossRef CAS PubMed.
- F. Razmjooei, K. P. Singh, M. Y. Song and J. Yu, Carbon, 2014, 78, 257–267 CrossRef CAS.
- R. Li, Z. Wei, X. Gou and W. Xu, RSC Adv., 2013, 3, 9978–9984 RSC.
- C. Wang, P. Shi, X. Cai, Q. Xu, X. Zhou, X. Zhou, D. Yang, J. Fan, Y. Min, H. Ge and W. Yao, J. Phys. Chem. C, 2016, 120, 336–344 CrossRef CAS.
- L. Jin, Q. Sun, Q. Xu and Y. Xu, Bioresour. Technol., 2015, 197, 348–355 CrossRef CAS PubMed.
- E. Neyens and J. Baeyens, J. Hazard. Mater., 2003, 98, 33–50 CrossRef CAS PubMed.
- X. Hou, X. Huang, F. Jia, Z. Ai, J. Zhao and L. Zhang, Environ. Sci. Technol., 2017, 51, 5118–5126 CrossRef CAS PubMed.
- M. Dogan, H. Abak and M. Alkan, J. Hazard. Mater., 2009, 164, 172–181 CrossRef CAS PubMed.
- C. Marinescu, M. B. Ali, A. Hamdi, Y. Cherifi, A. Barras, Y. Coffinier, S. Somacescu, V. Raditoiu, A. Szunerits and R. Boukherroub, Chem. Eng. J., 2018, 336, 465–475 CrossRef CAS.
- L. Lyu, G. Yu, L. Zhang, C. Hu and Y. Sun, Environ. Sci. Technol., 2018, 52, 747–756 CrossRef CAS PubMed.
- J. C. Espinosa, S. Navalûn, A. Primo, M. Moral, J. F. Sanz, M. Ýlvaro and H. GarcÍa, Chem.–Eur. J., 2015, 21, 11966–11971 CrossRef CAS PubMed.
- J.-H. Yang, Y. Gao, W. Zhang, P. Tang, J. Tan, A.-H. Lu and D. Ma, J. Phys. Chem. C, 2013, 117, 3785–3788 CrossRef CAS.
- H.-T. Tang, Spectrometric Identification of Organic Compound. Beijing University Press, Beijing, 1992, p. 87 Search PubMed.
- N. Li, W. Lu, K. Pei, Y. Yao and W. Chen, Appl. Catal., B, 2015, 163, 105–112 CrossRef CAS.
Footnote |
| † Electronic supplementary information (ESI) available. See DOI: 10.1039/c9ra03162f |
| This journal is © The Royal Society of Chemistry 2019 |