 Open Access Article
Oxidation-assisted alkaline precipitation: the effect of H2O2 on the size of CuO and FeOOH nanoparticles†
Sam G. F. Eggermont *ab,
Ana Rua-Ibarz
 c,
Kristof Tirezc,
Xochitl Dominguez-Benetton
 bc and
Jan Fransaer*a
aKU Leuven, Kasteelpark Arenberg 44 bus 2450, BE-3000 Leuven, Belgium. E-mail: sam.eggermont@kuleuven.be; jan.fransaer@kuleuven.be
bSIM vzw, Technologiepark 935, BE-9052 Zwijnaarde, Belgium
cFlemish Institute for Technological Research (VITO), Boeretang 200, BE-2400 Mol, Belgium
First published on 20th September 2019
Abstract
H2O2 was demonstrated to narrow the size distribution and decrease the size of CuO and hydrous FeOOH (2-line ferrihydrite) nanoparticles under conditions of high supersaturation. We introduce oxidation-assisted alkaline precipitation (Ox-AP) and compare it to traditional alkaline precipitation (AP). While for AP, a metal salt solution (e.g., CuCl2) is mixed with an alkali (e.g., NaOH), for Ox-AP, the more reduced form of that metal salt solution (e.g., CuCl) is simultaneously mixed with that alkali and an oxidant (e.g., H2O2). The resulting precipitates were characterized with SEM, XRD, DLS and single particle ICP-MS and shown to be nanoparticles (NPs). Ox-AP CuO NPs were up to 3 times smaller than AP NPs. Ox-AP FeOOH NPs were up to 22.5% smaller than AP NPs. We discuss and propose a possible mechanism of Ox-AP through careful consideration of the known reaction chemistry of iron and copper. We propose that an increased monomer formation rate enhances the nucleation rate, which ultimately results in smaller particles with a more narrow distribution. The more distinct effect of Ox-AP on copper, was attributed to the fast formation of the stable CuO monomer, compared to AP, where the Cu(OH)2 and/or Cu2(OH)3Cl monomers are more likely formed. Although, the exact mechanism of Ox-AP needs experimental confirmation, our results nicely demonstrate the potential of using Ox-AP to produce smaller NPs with a more narrow distribution in comparison to using AP.
Introduction
We introduce oxidation-assisted alkaline precipitation (Ox-AP) as an alternative method to traditional alkaline precipitation (AP). With AP, a metal salt (e.g., CuCl2) is mixed only with an alkali (e.g., NaOH) to achieve the supersaturation and precipitation of a sparingly soluble metal (oxy)(hydr)oxide (e.g., CuO). With Ox-AP the metal salt of the more reduced metal ion (e.g., CuCl) is mixed with both that alkali and an oxidant (e.g., H2O2). A careful comparison is only possible if the metal ion has at least two relatively stable oxidation states in solution. For this reason, we chose aqueous copper- and iron chloride solutions. The comparison of Ox-AP to AP is relevant given that AP is frequently cited for the production of CuO and FeOOH nanoparticles.1,2 Our original hypothesis was that, for the same supersaturation values, AP and Ox-AP would yield nanoparticles with the same characteristics (i.e., composition, size, morphology, etc.).According to classical nucleation theory (CNT),3–8 the particle formation process via hydrolysis proceeds in four steps: (1) formation of zero-charge monomers in the form of [M(OH)z(H2O)N−z]0, with metal ion charge z and coordination N, (2) creation of nuclei via the olation and/or oxolation of zero-charge precursors, (3) growth of the nuclei via addition of matter via olation and/or oxolation and (4) aging of the primary particles via Ostwald ripening and/or aggregation.9 Recently, steps (3) and (4) have been scrutinized for several systems, where meta-stable primary particles (i.e., pre-nucleation clusters, primary nanoparticles, etc.), can also serve as building blocks for growth of nanoparticles, a mechanism not included in CNT. These mechanisms are coined nonclassical and most of the recent findings are summarized in the review of De Yoreo and coworkers.10
CuO and FeOOH particles are easily produced via AP. For example, mixing a CuCl2 or FeCl3 solution with a highly alkaline solution (e.g., with NaOH) yields Cu(OH)2 or Fe(OH)3, respectively, which gradually (either fast or slow) form CuO or FeOOH via oxolation. The overall reaction scheme simplifies to:
| Cu2+ + 2OH− → Cu(OH)2 → CuO + H2O | (1) |
| Fe3+ + 3OH− → Fe(OH)3 → FeOOH + H2O | (2) |
| QCu(OH)2 = aCu2+aOH−2 = γCu2+γOH−2[Cu2+][OH−]2 | (3) |
| QFe(OH)3 = aFe3+aOH−3 = γFe3+γOH−3[Fe3+][OH−]3 | (4) |
CNT couples the chemical reactions of the monomer formation to the physical process of phase separation (i.e., from liquid to liquid + solid) via the concept of supersaturation. For reaction precipitation, the supersaturation S [—] is defined as the ratio between the reaction quotient Q and solubility product Ksp, as exemplified for Cu(OH)2:
 | (5) |
| Ksp,Cu(OH)2 = aCu2+,eqaOH−,eq2 | (6) |
If S > 1, the amount of reactants is in excess for equilibrium and precipitation can occur. Often S needs to be many times higher than 1 before precipitation occurs, depending on other limiting factors (e.g., surface energy of the precipitate, temperature, etc.). If S < 1, the amount of reactants is limiting for precipitation and hence the reactants stay in solution. According to CNT, a higher supersaturation level increases the nucleation rate which results in smaller particles.4,6–8
The (homogeneous) nucleation rate J [s−1] depends on supersaturation via a power law, which in the simplest form is written as:
 | (7) |
 | (8) |
A more elaborate approach, including for example heterogeneous nucleation and other important phenomena during precipitation, is found in scientific CNT literature.4,6–8,11 Although CNT demonstrated its usefulness in the past, recent studies increasingly demonstrate the limitations of CNT. These studies discovered different nonclassical crystallization routes and the importance of chemical kinetics.10,12
In this study we refute our original hypothesis, by demonstrating for two cases that Ox-AP yielded smaller nanoparticles with a more narrow size distribution than AP. Ox-AP achieves these feats with as little as possible alteration of the supersaturation. Contrary to recent discoveries of nonclassical crystallization routes, which are related to steps (3) and (4) of the precipitation process, we believe that the effect of Ox-AP is related to steps (1) and (2) of the precipitation process. We discuss the possible nature of Ox-AP of CuO and FeOOH through careful consideration of the known reaction chemistry of iron and copper.
Experimental
Complete experimental details are described in the ESI.†Preparation of the reagent solutions
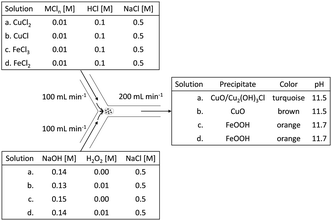
A 10 mM metal chloride solution, supplemented with 0.5 M of NaCl, was prepared for each of the metal ions discussed above (i.e., CuCl2, CuCl, FeCl3, and FeCl2, respectively). The NaCl was a necessity in the case of CuCl, to keep Cu+ in solution (for complexing between Cl− and Cu+).13 In the other cases, NaCl was added to keep composition consistency between all cases. To further isolate the effect of H2O2, we tweaked the individual NaOH solutions, with or without 10 mM H2O2 (100% excess), in function of their matching metal chloride solution, to always have the same theoretical leftover end-concentration of OH− (0.01 M, i.e., pH 12). This was deemed important, because Jolivet and coworkers demonstrated the importance of pH on the size of metal oxide nanoparticles.14Preparation of the nanoparticles
To have a consistent reaction front and consistent mixing, the solutions were mixed in a Y-junction by pumping them separately at high equal volumetric rates, after which the mixture was collected in a glass beaker. A summary of the electrolytes and a schematic drawing of the Y-junction tubular mixing-reactor are shown in Fig. 1.Material characterization techniques
The steady state pH after mixing was measured with a pH probe. Scanning electron microscopy (SEM) was used for the determination of size and morphology of the nanoparticles. X-ray powder diffraction (XRD) was used for the determination of the composition of the nanoparticles. Single particle inductively coupled plasma mass spectrometry (sp ICP-MS) and dynamic light scattering (DLS) were used for the determination of the size of the nanoparticles.Preparation of the samples for material characterization
Every effluent was divided into three samples. Two samples for wet analysis (i.e., sp ICP-MS and DLS). The other samples for dry analysis (i.e., XRD and SEM). All samples were treated according to a washing procedure. The samples for wet analysis required dilution steps specific to each of the applied techniques. The dry analysis samples required a drying step.Results
Visual observations of the nanoparticle suspension
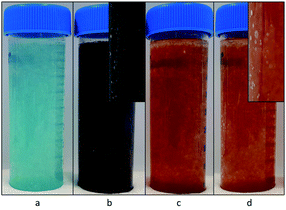
Fig. 2 demonstrates the dispersed precipitates just after mixing, stored in plastic storage tubes. When H2O2 was used, some gas evolution was observed, in the form of bubbles, suggesting the decomposition of excess H2O2 to oxygen gas and water (see insets of Fig. 2b and d). Table 1 shows the pH measured after mixing, which was lower than the expected value of 12. This is most likely due to the sodium error at 0.5 M NaCl. The pH difference between the copper case and the iron case was approximately 1 mM OH−, and thus considered insignificant for this study, because it is less than 1% of the amount of the total OH− added.| Solution | pH measured after mixing |
|---|---|
| CuCl2 | 11.67 ± 0.02 |
| CuCl + H2O2 | 11.72 ± 0.04 |
| FeCl3 | 11.49 ± 0.05 |
| FeCl2 + H2O2 | 11.54 ± 0.06 |
The copper samples had a distinct color difference (Fig. 2). Initially, the Cu2+ sample was distinctly blue, but developed into a dark brown color by the end of the washing process. The Cu+ (with H2O2) sample was dark greenish brown for a very short instance, but even before the washing step started its color changed to dark brown. Both the Fe3+ and the Fe2+ (with H2O2) sample were bright orange, with little observable change over time.
Size of the nanoparticles
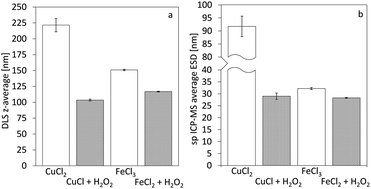
Single particle ICP-MS and DLS were used to determine the size of the nanoparticles.15 In all cases, spherical shape was assumed, and thus, the particle spherical equivalent diameter is reported. For rod-shaped particles of similar length over width ratio, comparison of particles with different sizes remains valid.16 Fig. 3 demonstrates the particle size distributions calculated from the sp ICP-MS measurements for the different cases. In the case of copper, the size of the particles shows a remarkable difference, contradicting our initial hypothesis of size consistency between AP and Ox-AP for the same supersaturation value. In the case of iron, the size difference follows a similar trend, although much less pronounced. Fig. 4a and b respectively compare the DLS and sp ICP-MS size measurements. Both measurements clearly demonstrate that the Ox-AP yields smaller particles than the traditional AP. In the case of copper, the average size of the oxidation-induced precipitates is 3 times smaller (i.e., 30 nm instead of 90 nm) according to sp ICP-MS, and over 2 times smaller (i.e., 100 nm instead of 250 nm) according to DLS. In the case of iron the results are less pronounced, yet inconsistent with our original hypothesis: the average size of the oxidation-induced precipitates is 12.5% smaller (i.e., 28 nm instead of 32 nm) than with the traditional AP-obtained precipitates according to sp ICP-MS, and 22.5% smaller (i.e., 117 nm instead of 151 nm) according to DLS. The difference in the sizes obtained by both techniques, sp ICP-MS and DLS, can mainly be attributed to two factors. Firstly, there exists a chance that agglomerates remain in our washed, but unstabilized, sample, resulting in increased apparent particle diameters.17,18 Secondly, because of anisotropy, the particles size (z-average) of DLS measurements can be strongly distorted.18 Table 2 shows the polydispersity index (PDI) for both single-particle ICP-MS and DLS, respectively. A lower PDI value corresponds to a more narrow distribution. Either technique demonstrates a more narrow distribution for Ox-AP than for traditional AP and this for both the copper case and the iron case.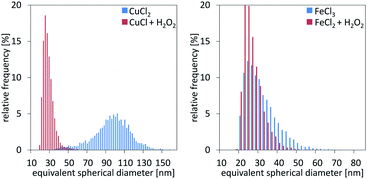 | ||
| Fig. 3 Particle size measurement distributions from single particle ICP-MS characterization for the cases of copper (left) and iron (right), respectively. | ||
| CuCl2 | CuCl + H2O2 | FeCl3 | FeCl2 + H2O2 | |
|---|---|---|---|---|
| sp ICP-MS | 0.32 | 0.08 | 0.12 | 0.07 |
| DLS | 0.38 | 0.28 | 0.23 | 0.20 |
Composition of the nanoparticles
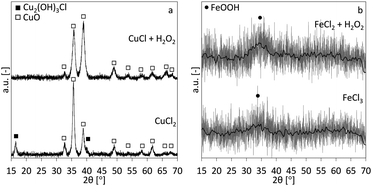
The XRD-patterns for the copper and iron cases are shown in Fig. 5a and b, respectively. CuO is the main phase for the copper case. The CuCl2 case shows two additional peaks, indicating an additional Cu2(OH)3Cl phase. This indicates that at least part of the precipitated phase is the Cu2(OH)3Cl instead of the Cu(OH)2 and besides the reactions described in eqn (1), following overall reactions are likely:| 2Cu2+ + 3OH− + Cl− → Cu2(OH)3Cl | (9) |
| Cu2(OH)3Cl + OH− → 2CuO + 2H2O + Cl− | (10) |
The mechanism in eqn (10) would be similar to the conversion mechanism of Cu(OH)2 to CuO at higher pH.19,20 Both iron cases show highly amorphous XRD patterns of 2-line ferrihydrite (hydrous FeOOH), although only the main (110) peak (one of two peaks in 2-line ferrihydrite) is visible.21,22 It is known that, with time ferrihydrite can convert into more crystalline products such as goethite and hematite.23
Morphology of the nanoparticles
Fig. 6 shows the SEM images for the different precipitates. For the copper case, separate particles are easily distinguished for AP and Ox-AP. Ellipsoidal needle-shaped NPs are observable in either case, but the Ox-AP NPs are clearly smaller than the AP NPs. For the AP case, the existence of a second, less abundant, phase (i.e., Cu2(OH)3Cl) is also clear. For the iron case, even at higher magnification than for the copper case, separate particles are hardly distinguishable for AP and Ox-AP (Fig. 6c and d). The nanoparticles form large aggregates of smaller nanoparticles. With digital magnification, it was possible to identify a few separate nanoparticles (Fig. 1 ESI†). However, these do not provide conclusive evidence on the size differences between AP and Ox-AP for the iron case.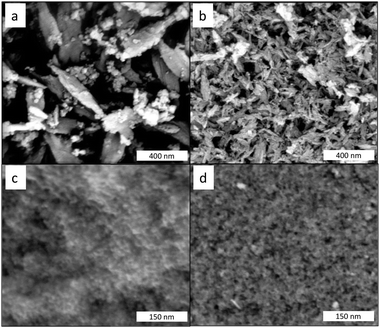 | ||
| Fig. 6 SEM images of the dried precipitates. CuCl2 without H2O2 (a) and CuCl with H2O2 (b) and FeCl3 without H2O2 (c) and FeCl2 with H2O2 (d). | ||
Discussion
The observations can be summarized as follows: (1) the experiments with iron result in smaller nanoparticles with more narrow size distributions than the experiments with copper, both for Ox-AP and AP; (2) Ox-AP results in smaller nanoparticles with more narrow size distributions than AP, both for the copper and the iron cases; (3) the effect of Ox-AP is much more pronounced in the case of copper than in the case of iron.The observations can be discussed in the light of the particle formation process. As discussed above, the particle formation process via hydrolysis proceeds in four steps: (1) formation of zero-charge precursors, (2) creation of nuclei via the olation and/or oxolation of zero-charge precursors, (3) growth of the nuclei via addition of matter via olation and/or oxolation and (4) aging of the primary particles via Ostwald ripening and/or aggregation.9 Step (1) depends on the solubility of the species and the concentration of the reagents and the available ligands (i.e., especially on the pH). Moreover, it is also limited by the lability of the water ligand in the first coordination shell of the metal ion. Step (2) depends on the concentration of the zero-charge species and the water lability as well, because the lability codictates the rates at which olation and oxolation can occur. Step (3) and step (4) are still intensively debated in current literature and strongly depend on step (1) and step (2), and any of the other process parameters.10
In the AP process, OH− ions compete with H2O and Cl− ions to enter the first hydration sphere of the metal aquo complex. The strong nucleophilic character of OH− allows it to form more stable complexes with the metal ion, and at the right OH− concentration the most stable form is a sparingly soluble zero-charge monomer. This monomer can form polymers via olation and oxolation until a critical size is reached and they are stable in solution. The critical size strongly depends on the inherent chemical nature of the monomer (i.e., the metal ion, the ligands, etc.), the olation and oxolation kinetics to which it is subjected, and also on the level of supersaturation (i.e., the concentration of the precursor ions).
Supersaturation S is much higher for the iron case than for the copper case (Table 3, more detailed calculations are given in the ESI†), and in accordance to CNT, the NPs in the iron case should be smaller than in the copper case.
Since the end pH, background electrolyte concentration, metal ion concentration and process operating conditions were the same for the copper and iron cases, the inherent differences between aqueous behaviour of Cu2+ and Fe3+ (i.e., the case-specific values of Jmax and A from eqn (7)) likely cause the observed size difference between the CuO and hydrous FeOOH nanoparticles. The values of Jmax and A depend on the chemical nature of the monomers and the olation and oxolation kinetics of those monomers. This is inherently different for copper and iron. Discussion of these differences would lead us to far afield.
More interesting is to compare the Ox-AP cases of copper and iron with the AP cases of copper and iron, respectively. Our original hypothesis was that, for the same supersaturation values, AP and Ox-AP would yield nanoparticles with the same characteristics (i.e., composition, size, morphology, etc.). Imagine infinitely fast oxidation of the metal ions in the Ox-AP case. This would cause complete oxidation prior to any other reaction (i.e., any of the four steps in the particle formation process), OH− would be formed according to following equations:
| 2Cu+ + H2O2 + 2OH− →2Cu2+ + 2OHCu2+− + 2OH− → 2CuO + 2H2O | (11) |
| 2Fe2+ + H2O2 + 4OH− → 2Fe3+ + 2OHFe3+− + 4OH− → 2FeOOH + 2H2O | (12) |
Because Ox-AP results in smaller particles with more narrow size-distributions, it is unlikely that in our process H2O2 would interfere significantly in the ageing process (i.e., step (4)), because although ageing tends to narrow the distribution size, it generally increases the average particle size. This is not in agreement with our observations. Therefore, prior to ageing, the particles should already have a smaller sizes and more narrow distributions.
The later stages of growth and ageing are often suppressed using large molecules that block the surface to avoid coalescence or by using certain ligands that suppress the redissolution of smaller particles in favour of the larger particles (i.e., Ostwald ripening). It is also unlikely that hydrogen peroxide would interfere in these stages, especially because most of the hydrogen peroxide reacts away in an oxidation reaction with the metal, and the excess quickly decomposes (i.e., bubbles are visible in the final solution). Therefore the interference of H2O2 is most likely occurring during step (1) and/or step (2) of the precipitation process. The olation and oxolation reactions in step (2) depend strongly on the characteristics of the zero-charge monomers formed in step 1. Therefore, we argue that H2O2 takes an important role in the formation of the monomers and the subsequent olation and/or oxolation reactions.
In Ox-AP, both OH− and HO2− (i.e., the deprotonated form of H2O2 at high pH values26) act as strong nucleophiles (i.e., HO2− even more so than OH−![[thin space (1/6-em)]](https://www.rsc.org/images/entities/char_2009.gif) 27) and compete with water and Cl− to enter the first hydration sphere of the metal ion. There are many possible reaction pathways for HO2− (i.e., H2O2) with the metal ion, known in scientific literature as Fenton(-like) reactions.28,29 The exact pathways are still subject of much research and heavily system dependent. Here, we propose, both for copper and iron, only one of the possible pathways. For clarity, we do not take into account the many possible side-reactions and intermediaries.
27) and compete with water and Cl− to enter the first hydration sphere of the metal ion. There are many possible reaction pathways for HO2− (i.e., H2O2) with the metal ion, known in scientific literature as Fenton(-like) reactions.28,29 The exact pathways are still subject of much research and heavily system dependent. Here, we propose, both for copper and iron, only one of the possible pathways. For clarity, we do not take into account the many possible side-reactions and intermediaries.
Without hydrogen peroxide, the expected zero-charge monomer of Cu+ is CuOH at elevated pH, with a subsequent oxolation reaction to Cu2O:
| 2Cu+ + 2OH− → 2CuOH → Cu2O + H2O | (13) |
| Cu+ + HO2− → CuOOH | (14) |
Subsequently, the oxidative nature of the HO2− ligand could result in a Fenton reaction:29
| CuOOH → CuO + OH˙ | (15) |
The proposed reactions require little ligand exchanges and result directly in the CuO monomer, rather than the Cu(OH)2 monomer or the Cu2(OH)3Cl dimer. The OH˙ radical is a non-selective oxidant which can oxidise neighbouring species, for example the Cu+ ion or the CuOH monomer, at high rates:30
| Cu+ + OH˙ → CuO + H+ | (16) |
| CuOH + OH˙ → CuO + H2O | (17) |
In any of the proposed reactions, the CuO is the end product. This might explain why, the conversion to the brown CuO precipitate is much faster for Ox-AP than for AP. The rapid formation of the stable CuO monomer, is a likely explanation of the smaller nanoparticles. The rapid depletion of monomers during the nucleation phase would then explain the more narrow size distribution. The lack of available monomers also slows down the subsequent growth. Although no evidence is currently available, we hope that the exact mechanism can be determined experimentally in the near future.
In the case of iron, the effect of Ox-AP is less obvious. A possible reason follows from our proposed reaction mechanism. Without hydrogen peroxide, the expected zero-charge monomer is Fe(H2O)3(OH)3. The complexed water results from the fact that Fe2+ and Fe3+ easily form hexaaqua complexes.31 The Fe(H2O)3(OH)3 monomer, subsequently transforms into FeOOH(H2O)x and with time (i.e., with ageing) crystallizes into FeOOH, with different possible crystal structures depending on the solution and process characteristics. Ageing was not allowed in our experiments, which limited crystallization. With hydrogen peroxide, we can draft a reaction similar to eqn (14), taking into account that Fe2+ easily forms the hexaaqua complex:
| [Fe(H2O)6]2+ + HO2− → [Fe(H2O)5OOH]+ + H2O | (18) |
| [Fe(H2O)5OOH]+ → [Fe(H2O)4(OH)2]+ + OH˙ + H2O | (19) |
Unlike with copper, with iron the reaction does not directly result in a zero-charge monomer. Moreover, the product itself (i.e., [Fe(H2O)4(OH)2]+) is an intermediary for ferrihydrite precipitation in AP.32,33 The ferrihydrite results from a second step with OH−:
| [Fe(H2O)4(OH)2]+ + OH− → Fe(OH)3(H2O)3 + H2O | (20) |
Remark that the sequence of these reactions is not fixed. The hydrolysis reaction with OH− might also occur first in the sequence, after which HO2− reacts with the [Fe(H2O)5OH]+ complex to form the zero-charge [Fe(H2O)4(OH)OOH] monomer. This monomer would then further oxidise to form the Fe(OH)3(H2O)3 monomer.
In the above reaction mechanisms, the reason might be found for the lesser effect of Ox-AP in the case of iron. The reaction with HO2− does not immediately give rise to a zero-charge monomer, requiring an extra step. Additionally, the resulting monomer is the same as the one expected for AP of iron, rather than directly resulting in a more stable form, as with copper. This is in line with the visibly observed alikeness of the precipitates (i.e., no transformation is obvious like with copper). One possible reason that an effect is still observable, could be that with Fe2+, the zero-charge monomer forms with only two ligand substitutions rather than three in the AP case of Fe3+. Additionally, the water exchange kinetics of Fe2+ are much faster than those of Fe3+ (4 orders of magnitude34), which might cause faster nucleation rates and the related observed, but small, effects.
Conclusion
We demonstrated that Ox-AP yields smaller nanoparticles with a more narrow size distribution than traditional AP for iron- and copper-chloride solutions in conditions of high supersaturation. For CuO, the differences between traditional AP and Ox-AP are very clear. For FeOOH, the differences are observable to a lesser extent. The proposed mechanisms of Ox-AP are the improved condensation kinetics and the faster formation of a stable zero-charge CuO monomer. For iron, we believe that the condensation kinetics improve less than for copper. We propose that the lack of a more stable monomer, in contrast to the copper case, causes this lesser effect. Although Ox-AP of iron lacks the more stable monomer, two other factors were proposed as possible causes for the observed effects. The first factor is the lower amount of necessary ligand exchanges to form a zero-charge monomer for Fe2+ compared to Fe3+. The second factor is the higher water exchange kinetics for Fe2+ than for Fe3+. Both factors possibly result in higher condensation kinetics for Ox-AP. In light of our observations, other systems can be prospected for the production of small nanoparticles with a narrow size distribution. Herein, a sufficiently stable precursor metal ion that can be oxidised is detrimental. Our theory is insightful for further investigations of other systems, but we hope that the exact mechanism can be confirmed experimentally in the near future to allow for better synthesis-by-design.Conflicts of interest
There are no conflicts to declare.Acknowledgements
This research was funded by the Strategic Initiative Materials (SIM) in Flanders, within the recyclable materials MaRes program, under grant agreement no. 150626 (Get-A-Met project). JF and XD acknowledge funding from the European Union's Horizon 2020 research and innovation programme under grant agreement no. 654100 (CHPM2030 project).Notes and references
- Q. Zhang, K. Zhang, D. Xu, G. Yang, H. Huang, F. Nie, C. Liu and S. Yang, Prog. Mater. Sci., 2014, 60, 208–337 CrossRef CAS.
- M. Mohapatra and S. Anand, Int. J. Eng. Sci. Technol., 2010, 2(8), 127–146 Search PubMed.
- V. K. LaMer and R. H. Dinegar, J. Am. Chem. Soc., 1950, 72, 4847–4854 CrossRef CAS.
- A. E. Nielsen, Kinetics of precipitation, Pergamon, 1964, vol. 18 Search PubMed.
- T. Sugimoto, Adv. Colloid Interface Sci., 1987, 28, 65–108 CrossRef CAS.
- J. Dirksen and T. Ring, Chem. Eng. Sci., 1991, 46, 2389–2427 CrossRef CAS.
- J. Klein and R. David, Crystallization technology handbook, 1995, p. 359 Search PubMed.
- G. Demopoulos, Hydrometallurgy, 2009, 96, 199–214 CrossRef CAS.
- J.-P. Jolivet, M. Henry and J. Livage, Metal oxide chemistry and synthesis: from solution to solid state, Wiley-Blackwell, 2000 Search PubMed.
- J. J. De Yoreo, P. U. Gilbert, N. A. Sommerdijk, R. L. Penn, S. Whitelam, D. Joester, H. Zhang, J. D. Rimer, A. Navrotsky and J. F. Banfield, et al., Science, 2015, 349, aaa6760 CrossRef.
- N. T. Thanh, N. Maclean and S. Mahiddine, Chem. Rev., 2014, 114, 7610–7630 CrossRef CAS PubMed.
- R. Xie, Z. Li and X. Peng, J. Am. Chem. Soc., 2009, 131, 15457–15466 CrossRef CAS PubMed.
- J. Fritz, J. Phys. Chem., 1981, 85, 890–894 CrossRef CAS.
- J.-P. Jolivet, S. Cassaignon, C. Chanéac, D. Chiche and E. Tronc, J. Sol-Gel Sci. Technol., 2008, 46, 299–305 CrossRef CAS.
- M. D. Montaño, J. W. Olesik, A. G. Barber, K. Challis and J. F. Ranville, Anal. Bioanal. Chem., 2016, 408, 5053–5074 CrossRef PubMed.
- A. Ortega and J. Garcıa de la Torre, J. Chem. Phys., 2003, 119, 9914–9919 CrossRef CAS.
- R. C. Murdock, L. Braydich-Stolle, A. M. Schrand, J. J. Schlager and S. M. Hussain, Toxicol. Sci., 2008, 101, 239–253 CrossRef CAS PubMed.
- P. A. Hassan, S. Rana and G. Verma, Langmuir, 2014, 31, 3–12 CrossRef.
- H. B. Weiser, W. Milligan and E. Cook, J. Am. Chem. Soc., 1942, 64, 503–508 CrossRef CAS.
- Y. Cudennec and A. Lecerf, Solid State Sci., 2003, 5, 1471–1474 CrossRef CAS.
- H. Liu, P. Li, B. Lu, Y. Wei and Y. Sun, J. Solid State Chem., 2009, 182, 1767–1771 CrossRef CAS.
- B.-S. Zhu, Y. Jia, Z. Jin, B. Sun, T. Luo, L.-T. Kong and J.-H. Liu, RSC Adv., 2015, 5, 84389–84397 RSC.
- S. Das, M. J. Hendry and J. Essilfie-Dughan, Environ. Sci. Technol., 2010, 45, 268–275 CrossRef.
- P. Patnaik, Handbook of inorganic chemicals, McGraw-Hill, New York, 2003, vol. 529 Search PubMed.
- J. W. Ball, D. K. Nordstrom, et al., WATEQ4F – User's manual with revised thermodynamic data base and test cases for calculating speciation of major, trace and redox elements in natural waters, Open-File Report, 90–129, 1991, p. 185, DOI:10.3133/ofr90129.
- M. Pourbaix, Atlas of Electrochemical Equilibrium in Aqueous Solutions, NACE, 1974, p. 307 Search PubMed.
- J. O. Edwards and R. G. Pearson, J. Am. Chem. Soc., 1962, 84, 16–24 CrossRef CAS.
- E. Neyens and J. Baeyens, J. Hazard. Mater., 2003, 98, 33–50 CrossRef CAS.
- A. D. Bokare and W. Choi, J. Hazard. Mater., 2014, 275, 121–135 CrossRef CAS PubMed.
- H. L. Wiegand, C. T. Orths, K. Kerpen, H. V. Lutze and T. C. Schmidt, Environ. Sci. Technol., 2017, 51, 14321–14329 CrossRef CAS PubMed.
- G. Wilkinson, R. D. Gillard and J. A. McCleverty, Comprehensive coordination chemistry, The synthesis, reactions, properties and applications of coordination compounds, Main group and early transition elements, vol. 3, 1987 Search PubMed.
- R. M. Cornell, R. Giovanoli and W. Schneider, J. Chem. Technol. Biotechnol., 1989, 46, 115–134 CrossRef CAS.
- A. Stefánsson, Environ. Sci. Technol., 2007, 41, 6117–6123 CrossRef PubMed.
- D. T. Richens, Chem. Rev., 2005, 105, 1961–2002 CrossRef CAS PubMed.
Footnote |
| † Electronic supplementary information (ESI) available. See DOI: 10.1039/c9ra03086g |
| This journal is © The Royal Society of Chemistry 2019 |

