 Open Access Article
Creative Commons Attribution 3.0 Unported Licence
In situ fast analysis of cadmium in rice by diluted acid extraction-anodic stripping voltammetry
Jie-qiong Zhang†
,
Ming-hui Zhou†,
Wei Tian,
Yan-xiang Wu,
Xi Chen and
Song-xue Wang *
*
Cereals and Oils Quality and Safety Research Institution, Academy of National Food and Strategic Reserves Administration (Former Name: Academy of State Administration of Grain), No. 23 Yongwang Str, DaXing District, Beijing 102600, China. E-mail: wsx@chinagrain.org
First published on 26th June 2019
Abstract
In China, the production has not realized intensive cultivation and the problem of cadmium (Cd)-contaminated rice is salient, so it is important to classify rice with different degrees of Cd pollution by rapid detection method in situ. This paper established a method with a combination of dilute acid extraction pretreatment and electrochemical devices. Cd was extracted from rice using 3% HCl for 5 min. A standard curve was obtained based on a certified reference material in the rice matrix with different concentrations of Cd, which was fitted with the Cd concentration (μg kg−1) against the stripping peak current value (μA), and the linear correlation coefficient was 0.9997. To analyze the applicability of the method, three factors including substrate diluents, particle diameter of the sample, and stability towards the method were evaluated. The limit of detection (LOD) was 2.02 μg kg−1, and the repeatability and accuracy were satisfactory. Cd was determined in 142 samples collected from three major grain-producing provinces of China, and the results have good consistence with the microwave digestion-ICP-MS method. The developed method combined dilute acid extraction with a matrix matching standard curve in ASV for the first time, and it was significantly satisfactory for the detection requirements in China.
Introduction
Cadmium (Cd) is a toxic heavy metal that can be accumulated in the body through food, water, and air, and is also associated with the induction of cancer.1,2 In recent years, with intensified industrialization and urbanization, agricultural soils polluted with Cd were about 2.786 × 10⁹ m2 in China,3 and Cd in soil can readily translocate into crops and accumulate in edible grains.4 Rice, as the most important staple, supports approximately 65% of China’s population,5 so Cd-contaminated rice severely increases the human health risk, and it is extremely urgent to monitor and manage cadmium fluxes of rice in agricultural systems. The most common methods for Cd detection in rice are atomic absorption spectroscopy (AAS), inductively coupled plasma mass spectrometry (ICP-MS), inductively coupled plasma optical emission spectrometry (ICP-OES), and so on.6–9 These methods have achieved quick and exact detection, but they are also time-consuming, require sophisticated equipment and are very demanding for the operator, generally in a laboratory setting. Unlike other countries, China’s agricultural production is dominated by scattered smallholders, which also increased a security supervision of difficulty.10 The conflicts between small-scale production and large regulation demands are very obvious, so a real-time detection method is necessary when the grain department purchases rice from fields or from grain depots, while the above-mentioned methods are unsuitable for field measurement.Electroanalytical methods have been extensively employed in recent years, as they are low cost, highly sensitive, easy to operate and portable.11–13 In particular, anodic stripping voltammetry (ASV) has been proved to be a high-potential and predominant analytical technique,14–16 which is widely applied in the detection of Cd within different complex media, such as tea,17 edible oil,18 fish tissue,19 and soil.20 There are numerous reports on Cd detection in rice by ASV, which mainly focused on the choice of metal chelating agent and modification of the electrodes. For example, luminol has been used to chelate Cd and Cu ions in rice samples,21 and a crown ether/Nafion-modified screen-printed carbon electrode coated with a bismuth film was prepared to determinate Cd and Pb ions in rice products.22 However, the samples which are used for electrochemical detection must be digested completely, so that Cd is released into its ionic form. Conventional digestion methods, such as wet digestion, microwave digestion and dry ashing, need a lot of nitric acid (grade pure), a strong oxidizer, high temperature or pressure, and a long pretreatment time (at least 3 hours).23 Therefore, the reported methods were suitable for Cd determination in a lab, but could not be applied to detection in the fields. To resolve the conflicts between the complicated digestion methods and the need for field-portable detection equipment, we established a rapid pretreatment method for Cd in rice using diluted acid without microwave24 or ultrasound25 assistance, and it could extract Cd from rice at room temperature within 5 min.26,27 Sequential extraction has been used to identify the chemical forms of Cd in roots, leaf sheaths, and leaves of both types of rice plants, and 0.6 M of HCl has been used to extract cadmium oxalatefrom frozen shoot and root tissues.28–30 However, no studies have been reported on the morphology of Cd in rice grain extracted with diluted acids and its suitability for the detection of electrochemical methods.
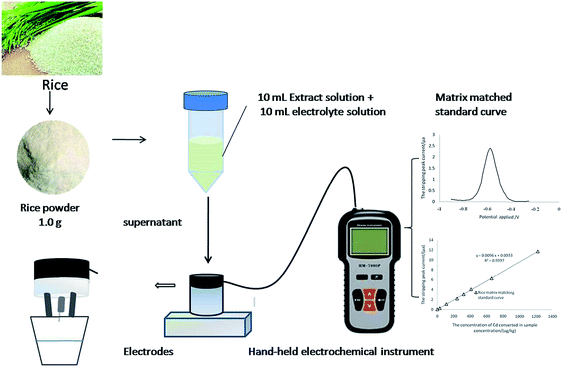
The aim of the present work is to develop the in situ fast analysis of cadmium in rice. Dilute acid extraction–ASV was developed based on analyzing the form of Cd in the extract of rice and optimizing the conditions of matrix disturbance, dilute acid type, concentration, sample particle size, and detection stability. The schematic diagram of the working principle of this method is shown in Fig. 1. The method was almost “ready-to-use” and can easily be adapted in field testing, and it will provide an alternative way to monitor Cd-contaminated rice in China.
Experimental
Testing samples
All certified reference materials (CRM), namely GBW(E)100377, GBW(E)080684a, GBW(E)100350, GBW(E)100348, GBW(E)100349, GBW100361, and GBW(E)100359, were purchased from the National Institute of Metrology, China. IRMM-804 was prepared by the Institute for Reference Materials and Measurements of the European Commission. Reference materials METAL-DJTZK-006 and METAL-DJTZK-007, and other samples containing Cd, were prepared by the Academy of National Food and Strategic Reserves Administration, China.Chemicals and apparatus
All reagents were guaranteed grade. Nitric acid, perchloric acid and hydrochloric acid were purchased from Beijing Chemical Reagent Research Institute. Sodium acetate and potassium chloride were supplied by Tianjin Guangfu Science and Technology Development Co., Ltd. All solutions were prepared with double-distilled water. Cd standard solution (1,000 μg mL−1, GBW08612) was supplied by the National Institute of Metrology, China. Argon (99.99%) was provided by Beijing North Temperature Gas Factory. A dialysis bag with a molecular weight cutoff of 3500 was purchased from Viskase, USA.Cd in the extracts was quantified by ICP-MS (7500CX, Agilent, USA) and AAS (ZEEnit 700 P, Analytik Jena, Germany). All voltammetric measurements were conducted by differential pulse anodic stripping voltammetry (HM-5000P, Jiangsu Tianrui, China). The electrode stand consisted of a 3 mm diameter glassy carbon electrode as the working electrode, double-junction Ag/AgCl (3 M KCl, saturated AgCl, and 3 M KCl in the bridge) as the reference electrode, and platinum wire as the auxiliary electrode. A microwave (MARS X, CEM, USA) accelerated reaction system was used for comparison with the sample treatment. A high-speed centrifuge (3-30KS, Sigma Laborzentrifugen GmbH, Germany) was used to separate the extracting solutions.
Sample preparation
Voltammetric procedure
The same volume of electrolyte solution (59 g of sodium acetate dissolved in 500 mL distilled water) was added into the centrifuge tube containing the mixed solution of dilute acid extraction, and then blended well. To better separate the phases, the mixed solution was centrifuged for 5 min at 10![[thin space (1/6-em)]](https://www.rsc.org/images/entities/char_2009.gif) 000 rpm.
000 rpm.
The electrode maintenance and analysis parameters were set according to the instructions provided in the electrochemical instrument. The preparation of the glassy carbon surface was carried out as follows: the glassy carbon surface was first polished with polishing paper (Jiangsu Tianrui, China), and the final polishing was carried out using aluminium oxide powder (0.3 μm). The electrode should be rinsed with deionized water between sample measurements.
The instrumental parameters used for ASV were: A constant potential (−1.40 V) was applied for 300 s to form the mercury film. The deposition potential and deposition time were −1.00 V and 110 s respectively. The pre-electrolysis step was followed by stripping from −0.90 V to −0.25 V, which gave a specific stripping current peak in the end.
Development of the method
Evaluation of the detection
| LOD = 2 × 1.645Sb/a = 3.29Sb/a | (1) |
The equation is appropriate for the situation when acquiring voltammetric scans of the analyte-free support electrolyte solution or when using instrumentations which automatically subtract the background from the response of any test sample.
Results and discussion
Feasibility of the method
In accordance with the principles of electrochemical measurement, ASV can only be used for testing ions in samples. Whether the speciation of Cd in diluted acid extraction solution could satisfy the requirements of the electrochemical method has become an important basis for the accuracy and stability of the method.The speciation of heavy metals in the environment (water and soil) and the relationship between bioavailability and toxicity have drawn significant attention in recent years.32–34 However, the speciation of heavy metals in food clearly varies from that in the environment, and heavy metals in food exist mainly in the form of macromolecular complexes.35,36 Cd in rice is mainly combined with protein to form Cd-binding protein rich charged amino acids or hydrophobic amino acids. The varying chemical forms of Cd in rice grains were also extracted by sequential extraction, and the extraction solution is made up of the following: (i) deionized water, (ii) 5% NaCl, (iii) 70% ethanol, and (iv) 0.2% NaOH.37,38 M. H. Zhou et al.26 previously proposed that an acid reagent at a certain concentration can be used to extract Cd in rice efficiently. They also verified the credibility of Cd extraction using diluted acid by graphite furnace atomic absorption spectrometry (GFAAS).27 The dissociation of extracted Cd into the ion form under acidic conditions has yet to be confirmed.
The particle radius of Cd2+ is 0.095 nm, however, the molecular mass of the composition formed from Cd with organics is more than 5.5KD.37–40 According to this difference, a dialysis bag with an intercept molecular weight of 3500 (the pore size is about 1.5 nm) was used to explore the speciation of Cd in rice. The diluted acid extraction solutions of three certified reference materials pre- and post-dialysis were all digested via the microwave digestion protocol then analyzed by ICP-MS. The results are shown in Table 1, and after full dialysis, more than 91% of the Cd could pass through the pores of the dialysis bag. The Cd in rice extracted by diluted HCl mostly was in Cd2+ form, which could be detected by electrochemistry.
| Sample number | Reference values (μg kg−1) | Solid![[thin space (1/6-em)]](https://www.rsc.org/images/entities/char_2009.gif) : :![[thin space (1/6-em)]](https://www.rsc.org/images/entities/char_2009.gif) liquid ratio liquid ratio |
Cd concentration (ng mL−1) | Ratio of dialysis (%) | |
|---|---|---|---|---|---|
| Before dialysis | After dialysis | ||||
| GBW(E)100377 | 261 ± 20 | 1![[thin space (1/6-em)]](https://www.rsc.org/images/entities/char_2009.gif) : :![[thin space (1/6-em)]](https://www.rsc.org/images/entities/char_2009.gif) 10 10 |
26.3 ± 2.1 | 2.2 ± 0.1 | 91.6 |
| GBW(E)100348 | 240 ± 10 | 24.4 ± 0.4 | 0.4 ± 0.1 | 98.4 | |
| IRMM-804 | 1610 ± 70 | 164.0 ± 4.0 | 13.6 ± 0.1 | 91.7 | |
Optimization and development of the method
| Acid type | 1% HCl | 1% HNO3 | 1% HClO4 |
|---|---|---|---|
| Deposition potential/mv | −592 | −574 | −578 |
| Stripping peak current/μA | 2.37 ± 0.02 | 1.78 ± 0.04 | 1.56 ± 0.04 |
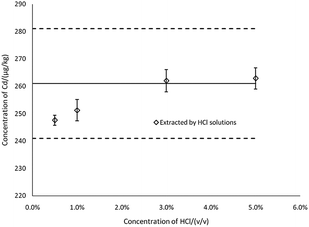
To evaluate the extraction efficiency at varying concentrations of HCl, the results for Cd in CRM were determined by ICP-MS (Fig. 2). The results showed that the concentrations of Cd in the extract were gradually increased in 0.5–5% HCl (v/v), and when the concentration of HCl was 3% and above, concentrations of Cd in the extract were the most consistent with the certified reference value, Xref. Thus, 3% HCl was selected as the extraction solution concentration. Note that in Fig. 2 and 3, the thick black lines correspond to Xref for Cd of GBW(E)100377, and the dashed lines mark the expanded standard uncertainties of the characterization, Xref ± 2uref = 261 ± 20 μg kg−1.
Development of the calibration curve
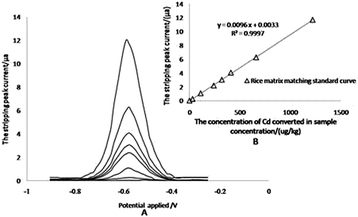
To calculate the content of Cd in samples, the standard curves were constructed with the standard solution of Cd and extracted solutions of reference materials containing different levels of Cd (rice matrix). The abscissa of the curve represented the concentration of Cd (μg kg−1), whereas the ordinate represented the stripping peak current (μA). The linear equations of two curves were y = 0.0312x − 0.4561 and y = 0.0096x + 0.0033 for matrix matched standard curve and aqueous standard solutions, respectively, and there was a significant difference between the slopes, indicating that the matrix of rice extract exerted a significant effect on signals.Establishing a correct calibration was essential in any analytical methodology to prevent the occurrence of systematic errors and matrix effects in the procedure. A CRM (GBW10045) was used to investigate the applicability of calibration. Satisfactory results were obtained by using a rice matrix matching the standard, rather than the solution standard (Table 3), which suggested that the matrix matching standard curve could reduce the influence of the rice substrate on the signals.
| Stripping peak current (μA) | Matrix matching standard curve (μg kg−1) | Solution standard curve (μg kg−1) | Reference values (μg kg−1) |
|---|---|---|---|
| 1.84 ± 0.04 | 194.0 ± 3.50 | 74.7 ± 1.60 | 190.0 ± 20.0 |
The anodic stripping voltammetry for the matrix matching calibration curve was measured by adsorbing Cd2+ at specified concentrations for 110 s at −1.0 V, at first, then stripping from −0.90 V to −0.25 V with a linear sweep rate of 0.4 V s−1, which gave a special stripping peak at −0.590 V in the end (Fig. 4A). For the matrix matching standard curve, it is difficult to find reference materials with higher concentrations of Cd. The linearity of the calibration plots is verified up to 1220 μg kg−1 total concentration for Cd in rice samples (122 μg L−1 in extract solution), and the correlation coefficients (r2) was 0.9997 (Fig. 4B).
Matrix interferences
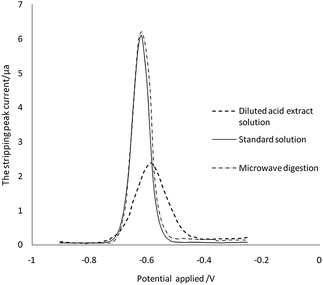
Other metal ions and organic compounds present in the sample solution might co-deposit with the target metal ions, and might result in poor peak resolution. To study interferences, earlier studies have investigated the influence by adding interfering ions, surface-active compounds and EDTA.41 However, the compounds from the diluted acid extraction solution cannot be simply simulated by adding the chemicals mentioned above. We therefore directly analyse the ASV results of the sample treated by microwave digestion and diluted acid extraction. As can be seen in Fig. 5, there was no significant difference between the current signals for Cd in the aqueous standard and in the sample digestion solution at the same concentration. The stripping peak of Cd in the sample diluted acid extraction solution was broadened, the stripping current decreased by 65% (from 6.1 μA to 2.1 μA), and the peak potential was shifted from −0.62 V to −0.59 V. These changes indicated that the organic compound in the sample diluted acid extraction solution may be adsorbed on the surface of the working electrode, which reduces the efficiency of the electrode to the target analyte. However, there was no interference to ASV detection when the matrix matched calibration was developed.Selection of sample diluents
The matrix interferences were verified to be significant, so the effect of different diluents on the determination of Cd content in rice samples should be evaluated. The diluents were prepared in rice extraction without Cd and aqueous solvent diluents (1![[thin space (1/6-em)]](https://www.rsc.org/images/entities/char_2009.gif) :
:![[thin space (1/6-em)]](https://www.rsc.org/images/entities/char_2009.gif) 1, v/v; extraction solution: electrolyte solution). The influence of two kinds of diluents on the measurement was investigated, and the obtained results are presented in Table 4. The use of aqueous solvent diluents was eliminated as it resulted in noticeably larger values than the reference value, but the blank rice sample was extracted for its satisfactory use for high Cd content samples. This result confirms that the matrix exerts significant effects on this method.
1, v/v; extraction solution: electrolyte solution). The influence of two kinds of diluents on the measurement was investigated, and the obtained results are presented in Table 4. The use of aqueous solvent diluents was eliminated as it resulted in noticeably larger values than the reference value, but the blank rice sample was extracted for its satisfactory use for high Cd content samples. This result confirms that the matrix exerts significant effects on this method.
| Dilution ratio | Determination of Cd by ASV (mg kg−1) | |
|---|---|---|
| Rice matrix diluent | Aqueous solvent diluent | |
1![[thin space (1/6-em)]](https://www.rsc.org/images/entities/char_2009.gif) : :![[thin space (1/6-em)]](https://www.rsc.org/images/entities/char_2009.gif) 2 2 |
1.52 ± 0.08 | 2.08 ± 0.04 |
1![[thin space (1/6-em)]](https://www.rsc.org/images/entities/char_2009.gif) : :![[thin space (1/6-em)]](https://www.rsc.org/images/entities/char_2009.gif) 5 5 |
1.61 ± 0.05 | 2.11 ± 0.05 |
1![[thin space (1/6-em)]](https://www.rsc.org/images/entities/char_2009.gif) : :![[thin space (1/6-em)]](https://www.rsc.org/images/entities/char_2009.gif) 10 10 |
1.59 ± 0.04 | 2.09 ± 0.06 |
1![[thin space (1/6-em)]](https://www.rsc.org/images/entities/char_2009.gif) : :![[thin space (1/6-em)]](https://www.rsc.org/images/entities/char_2009.gif) 20 20 |
1.55 ± 0.07 | 2.14 ± 0.04 |
| Reference value of IRRM-804 | 1.61 ± 0.07 | |
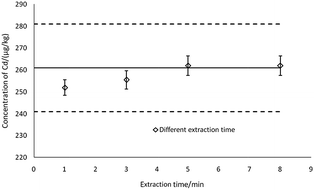
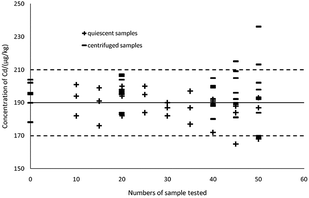
As can be seen in Fig. 7, the thick black lines correspond to Xref for Cd in GBW10045, and the dashed lines mark the expanded standard uncertainties of the characterization, Xref ± 2uref = 190 ± 20 μg kg−1. Sedimentation patterns (centrifugation at 10![[thin space (1/6-em)]](https://www.rsc.org/images/entities/char_2009.gif) 000 rpm for 5 min and remaining static for 15 min) showed no difference in detections as the most visible particles in the extractions can sink to the bottom by settling. When using a complete and uniform mercury film, the method can ensure the accuracy of the 40 samples, therefore ASV based on thin-layer mercury electrodes maintains an excellent stability and is highly applied in the present study.41,46
000 rpm for 5 min and remaining static for 15 min) showed no difference in detections as the most visible particles in the extractions can sink to the bottom by settling. When using a complete and uniform mercury film, the method can ensure the accuracy of the 40 samples, therefore ASV based on thin-layer mercury electrodes maintains an excellent stability and is highly applied in the present study.41,46
Evaluation of the strategy
| Methods | LOD (μg L−1) | LOQ (μg L−1) |
|---|---|---|
| ASV | 0.20 | 0.62 |
| ICP-MS | 0.05 | 0.17 |
| AAS | 0.025 | 0.085 |
| CRM no. | Matrix | Results ± SD (mg kg−1) | Reference values (mg kg−1) |
|---|---|---|---|
| GBW(E)100378 | Brown rice | 0.164 ± 0.01 | 0.169 ± 0.015 |
| GBW10045 | Rice | 0.199 ± 0.01 | 0.190 ± 0.02 |
| IRMM-804 | Rice | 1.63 ± 0.04 | 1.61 ± 0.07 |
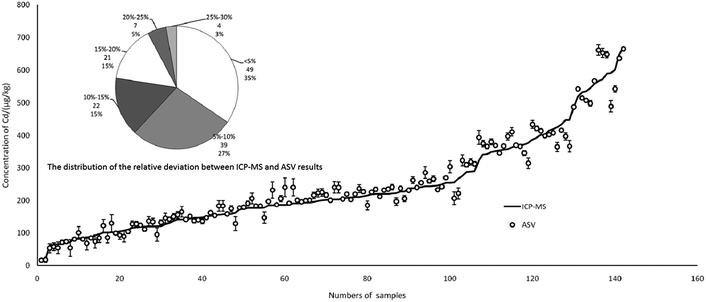
In total, 142 rice and brown rice samples were collected from three major grain-producing provinces of China, Hunan (n = 70), Guizhou (n = 38) and Jiangxi (n = 34), and the Cd content ranged from 16 to 670 μg kg−1 in the samples. As shown in Fig. 8, there was a good relationship between ICP-MS and ASV, which indicated that the results of ASV were credible in real detection. More specifically, the fan diagram showed the distribution of the relative deviation between the ICP-MS and ASV results. The relative deviation below 5% represented the largest portion of total samples (quantity 49, proportion 35%), followed by 5–10% (39, 27%). The relative deviation ranging from 25% to 30% represented the smallest portion of the total samples (4, 3%). In the final analysis, up to 92% of samples could reach a relative deviation below 20% for two different ways.
Conclusions
We established a rice matrix-matched standard curve coupled with an electrochemical detection method for the determination of Cd in rice and brown rice. Cd was extracted from rice and brown rice using 3% HCl solution. The pretreatment of samples could be completed within 5 min, and then the extracted solution was determined by ASV. The whole procedure was easily accomplished with 15 min. The detection limit of the method was 2.02 μg kg−1. Precision and accuracy tests indicated that the proposed diluted acid extraction–ASV method could be used in the analysis of Cd in rice samples. Moreover, compared to the previous methods for the detection of Cd in rice and brown rice by ASV,21,22 the pretreatment method needs less time, less corrosive acid of high concentration, and no instruments for high temperature and pressure. Meanwhile, the device for detection using ASV is portable, and easy and simple to operate, so that it could meet the urgent needs for the rapid determination of Cd, particularly in the field of grain purchase or supervision in countries with serious Cd contamination.Compliance with ethical standards
Funding
This study was funded by the research project of public welfare grain industry (Grant No. 201513006) and the research project of National Special Project for Key Science and Technology of Food Safety (Grant No. 2017YFC1601300).Ethical approval
This article does not contain any studies with human participants or animals performed by any of the authors.Informed consent
Not applicable.Conflicts of interest
There are no conflicts to declare.Acknowledgements
This work was conducted at Academy of National Food and Strategic Reserves Administration and was supported by the research project of public welfare grain industry (Grant No. 201513006) and the research project of National Special Project for Key Science and Technology of Food Safety (Grant No. 2017YFC1601300).References
- S. Toplan, D. Ozcelik, T. Gulyasar and M. C. Akyocu, J. Trace Elem. Med. Biol., 2004, 18, 179 CrossRef CAS.
- S. XU, G. LI and Z. LI, J. Integr. Agric., 2015, 14, 1889 CrossRef.
- S. B. Chen, M. Wang, S. S. Li, Z. Q. Zhao and E. Wen-di, J. Integr. Agric., 2018, 17, 765 CrossRef.
- H. Liu, Y. Liu, G. Zeng, J. Xie, B. Zheng, X. Tan, D. Wang, Z. Sun, J. Nie, Z. Jiang, C. Gan, W. Liu and S. Wang, RSC Adv., 2015, 5, 45502 RSC.
- H. Li, N. Luo, Y. W. Li, Q. Y. Cai, H. Y. Li, C. H. Mo and M. H. Wong, Environ. Pollut., 2017, 224, 622 CrossRef CAS PubMed.
- S. Akamatsu, N. Yoshioka and T. Mitsuhashi, Food Addit. Contam., Part A, 2012, 29, 1696 CrossRef CAS PubMed.
- L. Y. Chen, M. Shen, A. Ma and W. L. Han, Biol. Trace Elem. Res., 2018, 182, 152 CrossRef CAS PubMed.
- R. Dalipi, E. Marguí, L. Borgese and L. E. Depero, Food Chem., 2017, 218, 348 CrossRef CAS PubMed.
- B. P. Jackson and T. Punshon, Curr. Environ. Health Rep., 2015, 2, 15 CrossRef CAS PubMed.
- S. Xu, Proceedings of 2013 World Agricultural Outlook Conference, Construction of China Agriculture Monitoring and Early-Warning System (CAMES), Springer Heidelberg, New York, 2014, vol. 3, ch. 1 Search PubMed.
- D. Silva, M. Junior, L. Silva, L. Portugal, G. D. Matos and S. Ferreira, Anal. Methods, 2011, 3, 2495 RSC.
- R. Brown and M. Milton, TrAC, Trends Anal. Chem., 2005, 24, 266 CrossRef CAS.
- W. Gao, X. Wang, P. Li, Q. Wu, F. Qi, S. Wu, Y. Yu and K. Ding, RSC Adv., 2016, 6, 113570 RSC.
- A. Sinha, Dhanjai, R. Jain, H. M. Zhao, P. Karolia and N. Jadon, Microchim. Acta, 2018, 185, 89 CrossRef PubMed.
- S. Sobhanardakani, S. V. Hosseini, H. K. Miandare, R. Faizbakhsh, M. Harsij and J. M. Regenstein, Iran. J. Sci. Technol., 2017, 41, 139 CrossRef.
- Y. Y. Lu, X. Q. Liang, C. Niyungeko, J. J. Zhou, J. M. Xu and G. M. Tian, Talanta, 2018, 178, 324 CrossRef CAS PubMed.
- L. Qi, H. M. Lin, Y. H. Zhang, M. C. Rong, H. X. Ke, X. H. Tang and X. Chen, Sci. China: Chem., 2013, 12, 1749 Search PubMed.
- S. Kucukkolbasi, O. Temur, H. Kara and A. R. Khaskheli, Food Analytical Methods, 2014, 7, 872 CrossRef.
- S. Sobhanardakani, L. Tayebi, A. Farmany and M. Cheraghi, Environ. Monit. Assess., 2012, 184, 6607 CrossRef CAS PubMed.
- G. Zhao, Y. Yin, H. Wang, G. Liu and Z. Q. Wang, Electrochim. Acta, 2016, 220, 267 CrossRef CAS.
- S. Abbasi, A. Bahiraei and F. Abbasai, Food Chem., 2011, 129, 1274 CrossRef CAS PubMed.
- K. Keawkim, S. Chuanuwatanakul, O. Chailapakul and S. Motomizu, Food Control, 2013, 31, 14 CAS.
- Z. Hu and L. Qi, Sample digestion methods. in Treatise on geochemistry, ed. H. Holland and K. Turekian, 2nd edn, Elsevier Ltd, 2014, p. 87 Search PubMed.
- E. F. Batista, A. dos, S. Augusto and E. R. Pereira-Filho, Anal. Methods, 2015, 7, 329 RSC.
- J. S. de Gois, L. O. Lucena, P. S. de O. Cezario, A. P. da Silva, lgor C. A. Lima and A. S. Luna, Anal. Methods, 2018, 10, 1656 RSC.
- M. H. Zhou, S. X. Wang and Y. X. Wu, J. Chin. Cereals Oils Assoc., 2015, 30, 97 CAS.
- M. H. Zhou, Y. X. Wu, J. Q. Zhang, Y. Zhang, X. Chen, J. Ye and S. X. Wang, Anal. Sci., 2019, 35, 283 CrossRef CAS.
- J. Y. He, C. Zhu, Y. F. Ren, Y. P. Yan, C. Cheng, D. A. Jiang and Z. X. Sun, Pedosphere, 2008, 18, 371 CrossRef CAS.
- J. L. Xin and B. F. Huang, J. Agric. Food Chem., 2014, 62, 508 CrossRef CAS PubMed.
- J. Xin, X. H. Zhao, Q. L. Tan, X. C. Sun and C. X. Hu, Ecotoxicol. Environ. Saf., 2017, 145, 258 CrossRef CAS PubMed.
- E. Desimoni and B. Brunetti, Electroanalysis, 2013, 25, 1645 CrossRef CAS.
- T. R. Sabdrin and R. M. Maier, Environ. Toxicol. Chem., 2002, 21, 2075 CrossRef.
- M. Huang, Z. W. Li, B. Huang, N. L. Luo, Q. Zhang, X. Q. Zhai and G. M. Zeng, J. Hazard. Mater., 2018, 344, 539 CrossRef CAS PubMed.
- M. Mori, K. Kotaki, F. Gunji, N. Kubo, S. Kobayashi, T. Ito and H. Itabashi, Chemosphere, 2016, 148, 487 CrossRef CAS PubMed.
- G. J. Wagner, Adv. Agron., 1993, 51, 173 CAS.
- L. Sanità di Toppi and R. Gabrielli, Environ. Exp. Bot., 1999, 41, 105 CrossRef.
- J. R. Yang, Y. Zha, H. Liu and P. Zhang, China Environ.Sci., 2000, 20, 404 CAS.
- Y. Zha, J. R. Yang, H. Liu, M. C. He and P. Zhang, J. Beijing Norm. Univ., Nat. Sci., 2000, 36, 268 CAS.
- X. Yu, S. Wei, Y. Yang, Z. Ding, Q. Wang, J. Zhao, X. Liu, X. Chu, J. Tian, N. Wu and Y. Fan, Int. J. Biol. Macromol., 2018, 119, 597 CrossRef CAS PubMed.
- N. L. Smirnova, Crystallogr. Rep., 2004, 49, 705 CrossRef CAS.
- R. Piech, J. Appl. Electrochem., 2011, 41, 207 CrossRef CAS.
- H. J. Diederich, S. Meyer and F. S. Fresenius, J. Anal. Chem., 1994, 349, 670 CAS.
- M. F. Oliveira, A. A. Saczk, L. L. Okumura, A. P. Fernandes, M. Moraes and N. R. Stradiotto, Anal. Bioanal. Chem., 2004, 380, 135 CrossRef CAS PubMed.
- A. Economou and P. R. Fielden, TrAC, Trends Anal. Chem., 1997, 16, 286 CrossRef CAS.
- A. Economou and P. R. Fielden, Analyst, 2003, 128, 205 CAS.
- J. Smajdor, R. Piech and B. Paczosa-Bator, Steroids, 2018, 4, 404 Search PubMed.
Footnote |
| † Jie-qiong Zhang and Ming-hui Zhou contributed equally to this work. |
| This journal is © The Royal Society of Chemistry 2019 |

