 Open Access Article
Microfabricated needle for hydrogen peroxide detection
Shilun Feng *ab,
Sandhya Clement
 bc,
Yonggang Zhu
 de,
Ewa M. Goldys
 bc and
David W. Inglis*ab
aSchool of Engineering, Macquarie University, Sydney, NSW 2109, Australia. E-mail: shilun.feng@gmail.com
bARC Centre of Excellence for Nanoscale BioPhotonics (CNBP), Macquarie University, Sydney, NSW 2109, Australia
cGraduate School of Biomedical Engineering, University of New South Wales, Sydney, NSW 2052, Australia
dSchool of Science, RMIT University, Melbourne, VIC 3001, Australia
eSchool of Mechanical Engineering and Automation, Harbin Institute of Technology (Shenzhen), Shenzhen 518055, China
First published on 10th June 2019
Abstract
A microfabricated needle-like probe has been designed and applied for hydrogen peroxide (H2O2) sampling and detection using a commercial, single-step fluorescent H2O2 assay. In this work, droplets of the assay reagent are generated and sent to the needle tip using a mineral-oil carrier fluid. At the needle tip, the sample is drawn into the device through 100 μm long hydrophilic capillaries by negative pressure. The sampled fluid is immediately merged with the assay droplet and carried away to mix and react, producing a sequence of droplets representing the H2O2 concentration as a function of time. We have characterized the assay fluorescence for small variations in the sample volume. With the calibration, we can calculate the concentration of H2O2 in the sampled liquid from the size and intensity of each merged droplet. This is a microfluidic data-logger system for on-site continuous sampling, controlled reaction, signal storage and on-line quantitative detection. It is a useful tool for monitoring dynamic chemical reactions in analytical chemistry and biological applications.
Introduction
Droplets can be used as independent micro-reactors for many chemical and biological applications,1 e.g. chemical synthesis,2 enzyme kinetics studies,3 bio-medical diagnostics4 and biological agent detection.5 The advantages of microfluidic droplet platforms for chemical reactions include smaller quantities of costly reagents, better biochemical reaction efficiency6 and high throughput in terms of the number of reactions. Droplets can also be used to transport biochemical signals over long distance/time with minimal dispersion.7 This feature is useful for detecting rapid chemical changes in dynamic systems.Slaney et al.8 used the two parallel 10 cm long, 20 μm ID capillaries to inject artificial cerebrospinal fluid into an injection site, while extracting fluid at the same rate. This fluid was then segmented into droplets immediately outside the brain for transport to a laser induced fluorescence measurement. This system achieved a temporal resolution of 7 s. They also showed that a smaller system using 10 mm long capillaries with an inner diameter of 10 μm could achieve a response time of 200 ms. However, this probe was only used in vitro.
The same group also demonstrated a similar system that used a micro-dialysis membrane at the probe tip.7,8 The response time is longer, but the membrane contains the probe making a more practical system. In both cases, the sample is segmented after flowing through a channel for some millimeters,9,10 allowing for Taylor dispersion of the chemical signal. In principle, a shorter response time can be achieved by segmenting immediately after sampling.
Chen et al.11 did adjust this with a droplet–droplet extraction system for sampling biochemical signals from a cell culture. In their chemistrode, analytes produced in a cell culture were captured in passing droplets that were transported downstream for various analyses. Their work demonstrates an on-chip assay, where a reagent is merged/mixed with a passing sample droplet. However, their PDMS device had to be attached onto the cell culture dish to prevent the oil (continuous phase) from leaking out of the microfluidic system.
To address the problem of the oil-phase leaking out of the probe at the sampling site, Feng et al. demonstrated the polymer7 and silicon12 devices that use Laplace pressure to allow aqueous fluids to enter and exit a microchannel, but not the oil phase. Laplace, or bubble pressure is also used as a gating mechanism to control the movement of liquid in centrifugal Lab-on-a-disc platforms.13 Using our approach, sample is drawn into a hydrophobic microchannel through hydrophilic channels or a hydrophilic membrane. The sample is immediately segmented by the oil phase in the hydrophobic channel. In the work presented here, we apply the silicon device which has hydrophilic capillaries at its tip (100 μm long, 2 μm ID), to an on-chip fluorescence assay.
To conduct an on-chip assay, a droplet containing a sample must be mixed with a fluid containing the assay reagent. Merging of the droplets occurs when they touch each other and overcome the stabilizing forces caused by lubrication and surface tension.14 Several designs have been used to bring droplets together including active merging and passive merging.15 For droplets that are stabilized by surfactants, active merging is required. For example, the thermocapillary effect16 or electrocoalescence17 can be used. Without surfactants, the stability of the droplets is reduced, but it is possible to induce passive merging.
Following a merging event in a straight channel, the two substances form one droplet where each hemisphere is mixed. Mixing between the two halves occurs only by diffusion across this axis of symmetry.18,19 Mixing can be accelerated by generating advection in different directions inside the droplets. Flavie Sarrazin et al. used simple bends in the microchannel, which rotated the hemispheres.20 At each bend, the internal loops are sheared and reoriented so that the internal fluids mix.
To demonstrate the on-chip assay with the low sample volume of the droplets, we have used a commercial H2O2 assay. H2O2 is a reactive oxygen species (ROS) molecules, which can damage DNA, inhibit bacterial oxidative phosphorylation.21 In cell cultures, concentrations of between 20 to 50 μM have been shown to have limited cytotoxicity.22 The urinary H2O2 have been used as a biomarker for oxidative stress,23,24and the concentration ranges from the freshly voided urine from 55 healthy is ranging from 0.84 to 5.7 μM.25 The low sample volume of the droplets can not only largely reduce the cost of the reagents but also be easily feasible for the on-site detections for the practical applications above.
This is achieved by entraining droplets containing H2O2 assay reagent upstream of the sampling site. At the sampling site, the assay droplets merge with the sampled droplets with varying concentrations of H2O2, then flow downstream. Immediately following the merging event, a bend in the channel causes enhanced advection in the merged droplets. The droplets can be kept inside the enclosed channel, avoiding contact with the air or oxidation. The merged signals can be stored and/or transported for analysis, enabling preserving digital chemicals information in the train of merged droplets.
Materials and methods
The experimental setup for the microfluidic chip includes a Maesflow 4C (Fluigent) system for positive pressure control and a purpose-built system to apply and measure negative pressure. Biosensor assays were examined and calibrated by Cary Eclipse Spectrophotometer. We recorded images and movies for fluorescence intensity and length information of the droplets running on the chip using an epi-fluorescence microscope with a monochrome camera (NIKON DS-Qi1Mc), a CoolLED pE300 light source, and appropriate filter cubes directly on the chip. Images and movies were analyzed and prepared using ImageJ. Fig. 2 uses a custom grey-to-green look-up table. Fluorescence measurements of bulk solutions were carried out using a Cary Eclipse fluorescence spectrophotometer with a 5 nm spectral resolution for both excitation and emission.The microfluidic device used is identical to those used in Feng et al. 2017,12 and is shown in Fig. 1a. The channels were photo-lithographically patterned and etched on the silicon chip. Sigma-Coat (Sigma Aldrich) was used to coat the channels in silane, creating a hydrophobic surface. The capillary channels at the needle tip were rendered hydrophilic by drawing 2-propanol containing 1% KOH into the device through the capillaries, while flowing pure 2-propanol through the main channel. A region around the capillary channels, but inside the main channel is also made hydrophilic. This feature is critical, as it anchors the sample droplet, enabling the merging of sample and assay.
The amount of H2O2 generated throughout our experiment is measured using an FBBBE probe (Product no. 14606, Cayman Chemicals, and USA). The FBBBE is a probe which is specifically designed for measuring intracellular H2O2 as it is capable of penetrating the cell wall.26 The fluorescence of the FBBBE molecule (with Ex/Em 480/512) increases with the amount of H2O2 (from 0 to 150 μM). For calibration, 30% hydrogen peroxide (H2O2) was used to make different concentrations of H2O2 samples; 50 mM HEPES buffer (pH = 7.2) was used to dilute the H2O2 and the biosensor.
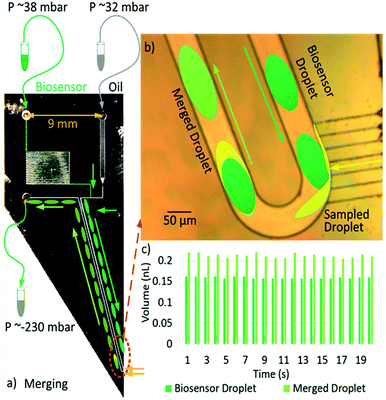
Fig. 1a shows the layout and typical settings of the device. We set the oil (32 m bar) and biosensor (38 m bar) inputs using the Maesflow 4c (Fluigent) System. We applied negative pressure (−232 m bar) at the outlet; the needle tip is left in a small pool of solution to be sampled. The ‘Biosensor inlet’ was drawn as green and ‘Oil inlet’ was drawn as grey in Fig. 1a. To make the sample inlet (drawn as yellow in Fig. 1a) clear, Fig. 1b was drawn to show the capillary inlet. A poly(methyl methacrylate) chuck was used to hold the chip and apply fluids and pressures. Fig. 1b depicts the process of sampling a yellow liquid and merging it with a dark-green droplet representing the biosensor. Fig. 1c shows the measured droplet volumes for 20 continuous merging events. The volumes of the biosensor droplets (VI) are consistent with an average volume of 0.1600 ± 0.0025 nL.
The volumes of the merged droplets (Vm) are recorded to have an average of 0.213 ± 0.005 nL. The VI or Vm values are calculated by multiplication of the measured biosensor or merged droplets' lengths and the cross-section area of the microchannel (50 μm × 50 μm, 2.5 × 10⁻⁹ m2) respectively. We can calculate the sampled volume by subtracting the VI from Vm.
The sampled volume (0.0530 ± 0.0075 nL) may change due to pressure variations outside the device, while the volume of the biosensor droplet (VI) is much more stable and does not need to be continuously monitored. The temporal resolution of the samples is around 1 s, as shown in Fig. 1c.
Results
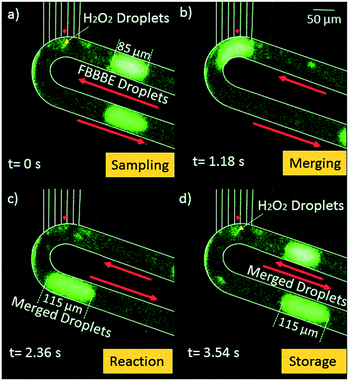
Our first result is to show that the HEPES buffer solution can be sampled by the chip and immediately mixed with biosensor droplets. Fig. 2 shows a 90 μm long segment of 40 μM FBBBE biosensor mixing with a small amount of sampled 50 mM HEPES buffer (pH = 7.2). 20 mbar was provided at the oil inlet, 48 mbar was provided at the biosensor inlet, both of which were provided by a Maesflow 4C (Fluigent) system. The negative pressure (−70 mbar) was provided at the outlet; 50 mM HEBES buffer was place at the needle tip for sampling. The microscope objective was a 10 × 0.3 APO, while the exposure time for the camera is 400 ms.Fig. 2a shows the sampling process of HEPES by the devices; Fig. 2b shows the merging process of the 85 μm of 40 μM FBBBE biosensor solution with the sampled HEPES droplets; Fig. 2c shows the merged droplet which has a length of 115 μm and a volume of 0.288 nL. Using this change in length we can calculate that approximately 0.075 nL of HEPES buffer was sampled; Fig. 2d shows the merged, and rapidly mixed in the droplets is being transported away. Along with subsequent droplets, it is preserved on board while being transported downstream. The fluorescence of each merged droplet is used to measure the H2O2 concentration in the HEPES buffer after 15 minutes. In Fig. 2, merged droplets are produced approximately once every 3.5 seconds. This digital sampling rate can be increased by increasing the pressure drop from the inlets to the outlet.
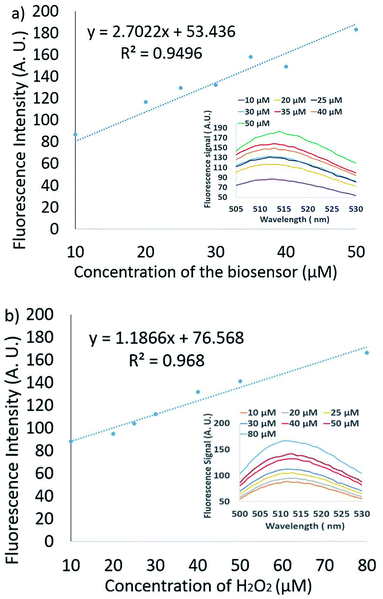
The volume of sample that is added to the biosensor droplet is variable. If the pressure outside the device increases/decreases, more/less sample will be added. The concentration of the sensor and the analyte may, therefore, change from drop to drop. We investigated how these two parameters affect the fluorescence intensity of the assay over a reasonable range using a conventional spectrofluorometer. Fig. 3a shows the reactions of the 10–50 μM FBBBE sensor probe with 30 μM H2O2. The fluorescence spectra (ex: 480 nm) were monitored after the merged solution had been left for 15 minutes. We observe a closely linear increase in the fluorescence signal with increasing FBBBE biosensor concentration.
Fig. 3b shows the reactions of 10–80 μM H2O2 with 30 μM FBBBE sensor. The results also show a linear increase in the reading fluorescence signal intensity with the increase of H2O2 biosensor concentration. Therefore, we expect the fluorescence signal intensity to be approximately linear for changes to both H2O2 and FBBBE sensors concentrations in the examined ranges.
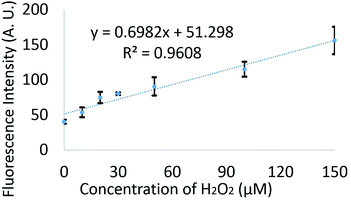
Different concentrations of H2O2 (0–150 μM) were mixed with 20 μM FBBBE biosensor off-chip. Then each merged solution was left in the dark at room temperature for 15 minutes before sampling by the microdevice. Here, both inlets are filled with oil and a negative pressure (−230 mbar) was provided at the outlet. The droplets with different fluorescence intensity and lengths were recorded as video by epi-fluorescence microscopy to validate the microfluidic system which was performed on the chip. The fluorescence intensities of the droplets were continuously analysed using ImageJ. Fig. 4 shows the analysis data for the fluorescent intensity of 600 droplets for different concentrations of H2O2. There is a linear increase in fluorescence with increasing concentration, demonstrating that this device can be used to measure different H2O2 concentrations.
We used the device to sample the HEPES buffer containing various concentrations of H2O2. As shown in Fig. 1, the FBBBE biosensor droplets are generated on board, and the peroxide-containing buffer is sampled through the capillaries. In this experiment, 17 mbar was provided at the oil inlet, 25 mbar was provided at the dye biosensor inlet; −330 m bar was provided at the outlet. Merged samples were obtained for 20 seconds then the flow was stopped. The samples were stored in the device for 15 minutes to allow the bioassay time to generate a satisfactory fluorescence signal. The fluorescence intensities and lengths of each stored droplet are then recorded.
For this particular experiment, we used biosensor droplets containing 40 μM FBBBE while 100 μM and 200 μM H2O2 in HEPES were sampled. The biosensor droplet volume is consistent and observed to be 0.191 ± 0.005 nL, while the merged droplet volume is variable at 0.249 ± 0.052 nL.
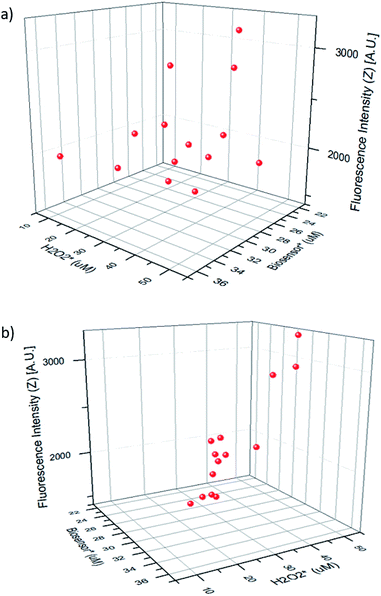
Fig. 5 shows the fluorescence intensity of the merged droplets after 15 minutes versus the peroxide concentration in the merged droplet  and the biosensor concentration in the merged droplet
  . These concentrations are calculated using the change in droplet volume. The data readily fit a 2-dimensional first-order linear function (R2 = 0.813).
The linear fitting equation can be re-arranged to determine the hydrogen peroxide concentration in the droplet as a function of the fluorescence intensity (Z) and the biosensor concentration in the droplet:
 | (1) |
The  and
and  can be derived from the initial biosensor concentration (Csensor), initial concentration of hydrogen peroxide outside the device (CH2O2) and their mixing volumes ratio, where
 | (2) |
 | (3) |
Since the initial droplet size VI and Csensor prior to sampling are consistent, we can rewrite an equation for CH2O2 in terms of known quantities and the directly measured variables:
 | (4) |
Using the above equation, it is possible to calculate the concentration of H2O2 in the solution of interest.
Discussion
Our system can extract sub nL samples from surrounding fluid and merge the sampled liquid with the detecting biosensor directly. These merged droplets can be stored and detected directly in the channel, enabling fluorescence detection of samples with volume nL taken at 1 second intervals. Using conventional methods, such as a spectrophotometer, it is not practical to characterise samples at such a rapid rate. For the sensor we use in this article, 15 minutes is the optimal reaction time, so we can detect fluorescence of the merged samples sharply at 15 minutes without any handling time. Also, it is possible to perform more rapid detection with this chip using a sensor which has a shorter reaction time. The device is silicon-glass based, it can be reusable.The size and rate of assay droplets are controlled by the inlet and outlet pressures. For each experimental run, the different hydrophobic status of the microchannel wall and the droplets remaining in the microchannel can create different resistances existed in the microchannel, so different inlets and outlets pressure were needed to be adjusted to make the series of consistent assay droplets with constant size and rate. As long as the pressures needed were set to make the continuous, consistent assay droplets, they will be stable and unchanged for the experimental run and signals recording. The sampling rate (volume flow) is mainly controlled by the difference between the external pressure of the capillaries and the negative pressure at the outlet. If this difference is too large, sample droplets may be released into the channel before an assay droplet arrives. Under normal operating conditions we did not observe this. For each experiment run measurement, the inlets and outlet pressures will be stable and unchanged. The assay droplets volume VI will be constant, the sampling Vm will be variable, by calculating each merging event and measuring its merging reaction fluorescent signal, we can get the valuable dynamic merging and reaction information.
It is interesting to consider what fluid systems and surface treatments would result in stable droplets while giving a high breakthrough pressure. In such a system, the main micro-channel must be highly lipophilic, and hydrophobic, while the capillaries must be highly hydrophilic and lipophobic. We have not used any surfactants during the experiments as we expect this will render the capillaries lipophilic, destroying the Laplace pressure barrier that prevents the oil from escaping.27 We have not experimented with other oil systems.
The length of the channel from the needle tip to the outlet is 28.4 mm. This channel length is sufficient to store 50 droplets at the flow rates used. In subsequent versions of the device, we will use a much longer channel or connect the outlet to a long tube to ensure continuous coupled measurements. Finally, with an improved chip-to-tube connection, sampled droplets could be stored and sent to a wide range of analytical tools.
The present system executes sampling, merging and reaction, which may also allow us to investigate the kinetics of assay reactions. As well as performing this long-reaction-time H2O2 assay (>15 minutes), our system is also the right tool for studying more rapid (∼1 s) chemical changes in dynamic systems, and possibly high throughput characterisation of assays. For example, small amounts of reagent can be merged with many different analytes of different concentrations in a single run of the chip, giving hundreds of individual reactions information. This can be used to reduce the cost and time effectively of developing new assays compared to the conventional methods.
Conclusions
We have demonstrated the use of an on-chip assay for varying hydrogen peroxide detections using droplet by the existing silicon data-logger system. Unlike prior work, the present approach segments the sample immediately upon entering the device to merge and react with the assay. The droplet approach facilitates thousands of detections in a single run and may be used to quantify the kinetic reactions in a low-cost and rapid way. This system is suitable for the studying of rapid (∼1 s) chemical changes in dynamic biological systems.Conflicts of interest
The authors declare no conflicts of interest.Acknowledgements
The authors thank Dr Simon Doe, Dr Donghoon Chang, and Dr Jing-Hong Pai at the ANFF South Australia for input and guidance in fabricating the device. This work was performed in part at the South Australian node of the Australian National Fabrication Facility under the National Collaborative Research Infrastructure Strategy. This work was financially supported by Macquarie University Wireless Medical Devices Research Centre and the ARC Centre of Excellence for Nanoscale BioPhotonics CE140100003. We thank our colleague Dr Wei Deng from Macquarie University for the useful discussions.References
- T. Ishida, D. McLaughlin, Y. Tanaka and T. Omata, First-come-first-store microfluidic device of droplets using hydrophobic passive microvalves, Sens. Actuators, B, 2018, 254, 1005–1010 CrossRef CAS.
- X. Gu, Y. Ning, Y. Yang and C. Wang, One-step synthesis of porous graphene-based hydrogels containing oil droplets for drug delivery, RSC Adv., 2014, 4(7), 3211–3218 RSC.
- F. Gielen, T. Buryska, L. Van Vliet, M. Butz, J. Damborsky, Z. Prokop and F. Hollfelder, Interfacing Microwells with Nanoliter Compartments: A Sampler Generating High-Resolution Concentration Gradients for Quantitative Biochemical Analyses in Droplets, Anal. Chem., 2015, 87(1), 624–632 CrossRef CAS PubMed.
- J. L. Garcia-Cordero and Z. H. Fan, Sessile droplets for chemical and biological assays, Lab Chip, 2017, 17(13), 2150–2166 RSC.
- P. Quaresma, I. Osório, G. Dória, P. A. Carvalho, A. Pereira, J. Langer, J. P. Araújo, I. Pastoriza-Santos, L. M. Liz-Marzán and R. Franco, Star-shaped magnetite@ gold nanoparticles for protein magnetic separation and SERS detection, RSC Adv., 2014, 4(8), 3659–3667 RSC.
- S.-Y. Teh, R. Lin, L.-H. Hung and A. P. Lee, Droplet microfluidics, Lab Chip, 2008, 8(2), 198–220 RSC.
- S. L. Feng, M. N. Nguyen and D. W. Inglis, Microfluidic Droplet Extraction by Hydrophilic Membrane, Micromachines, 2017, 8(11), 331 CrossRef PubMed.
- T. R. Slaney, J. Nie, N. D. Hershey, P. K. Thwar, J. Linderman, M. A. Burns and R. T. Kennedy, Push–pull perfusion sampling with segmented flow for high temporal and spatial resolution in vivo chemical monitoring, Anal. Chem., 2011, 83(13), 5207–5213 CrossRef CAS PubMed.
- M. Wang, G. T. Roman, K. Schultz, C. Jennings and R. T. Kennedy, Improved temporal resolution for in vivo microdialysis by using segmented flow, Anal. Chem., 2008, 80(14), 5607–5615 CrossRef CAS PubMed.
- M. Wang, G. T. Roman, M. L. Perry and R. T. Kennedy, Microfluidic chip for high efficiency electrophoretic analysis of segmented flow from a microdialysis probe and in vivo chemical monitoring, Anal. Chem., 2009, 81(21), 9072–9078 CrossRef CAS PubMed.
- D. Chen, W. Du, Y. Liu, W. Liu, A. Kuznetsov, F. E. Mendez, L. H. Philipson and R. F. Ismagilov, The chemistrode: a droplet-based microfluidic device for stimulation and recording with high temporal, spatial, and chemical resolution, Proc. Natl. Acad. Sci. U. S. A., 2008, 105(44), 16843–16848 CrossRef CAS PubMed.
- S. L. Feng, G. Z. Liu, L. M. Jiang, Y. G. Zhu, E. M. Goldys and D. W. Inglis, A microfluidic needle for sampling and delivery of chemical signals by segmented flows, Appl. Phys. Lett., 2017, 111(18), 183702 CrossRef.
- A. Kazemzadeh, P. Ganesan, F. Ibrahim, M. M. Aeinehvand, L. Kulinsky and M. J. Madou, Gating valve on spinning microfluidic platforms: A flow switch/control concept, Sens. Actuators, B, 2014, 204, 149–158 CrossRef CAS.
- H. Gu, M. H. G. Duits and F. Mugele, Droplets Formation and Merging in Two-Phase Flow Microfluidics, Int. J. Mol. Sci., 2011, 12(4), 2572–2597 CrossRef CAS PubMed.
- H. Gu, M. H. Duits and F. Mugele, Droplets formation and merging in two-phase flow microfluidics, Int. J. Mol. Sci., 2011, 12(4), 2572–2597 CrossRef CAS PubMed.
- C. N. Baroud, J.-P. Delville, F. Gallaire and R. Wunenburger, Thermocapillary valve for droplet production and sorting, Phys. Rev. E, 2007, 75(4), 046302 CrossRef PubMed.
- M. Zagnoni and J. M. Cooper, On-chip electrocoalescence of microdroplets as a function of voltage, frequency and droplet size, Lab Chip, 2009, 9(18), 2652–2658 RSC.
- C. N. Baroud, F. Gallaire and R. Dangla, Dynamics of microfluidic droplets, Lab Chip, 2010, 10(16), 2032–2045 RSC.
- A. E. Kamholz and P. Yager, Molecular diffusive scaling laws in pressure-driven microfluidic channels: deviation from one-dimensional Einstein approximations, Sens. Actuators, B, 2002, 82(1), 117–121 CrossRef CAS.
- F. Sarrazin, L. Prat, N. Di Miceli, G. Cristobal, D. Link and D. Weitz, Mixing characterization inside microdroplets engineered on a microcoalescer, Chem. Eng. Sci., 2007, 62(4), 1042–1048 CrossRef CAS.
- Y. Luo, H. Liu, Q. Rui and Y. Tian, Detection of extracellular H2O2 released from human liver cancer cells based on TiO2 nanoneedles with enhanced electron transfer of cytochrome c, Anal. Chem., 2009, 81(8), 3035–3041 CrossRef CAS PubMed.
- B. Halliwell, M. V. Clement and L. H. Long, Hydrogen peroxide in the human body, FEBS Lett., 2000, 486(1), 10–13 CrossRef CAS PubMed.
- B. Halliwell, L. H. Long, T. P. Yee, S. Lim and R. Kelly, Establishing biomarkers of oxidative stress: the measurement of hydrogen peroxide in human urine, Curr. Med. Chem., 2004, 11(9), 1085–1092 CrossRef CAS PubMed.
- D.-H. Wang, K. Ogino, Y. Sato, N. Sakano, M. Kubo, K. Takemoto and C. Masatomi, Urinary Hydrogen Peroxide as Biomarker, General Methods in Biomarker Research and their Applications, 2015, pp. 313–331 Search PubMed.
- J. Yuen and I. Benzie, Hydrogen peroxide in urine as a potential biomarker of whole body oxidative stress, Free Radical Res., 2003, 37(11), 1209–1213 CrossRef CAS PubMed.
- K. B. Daniel, A. Agrawal, M. Manchester and S. M. Cohen, Readily accessible fluorescent probes for sensitive biological imaging of hydrogen peroxide, ChemBioChem, 2013, 14(5), 593–598 CrossRef CAS PubMed.
- M. J. Rosen and J. T. Kunjappu, Surfactants and interfacial phenomena, John Wiley & Sons, 2012 Search PubMed.
| This journal is © The Royal Society of Chemistry 2019 |

