 Open Access Article
Construction of LiMn2O4 microcubes and spheres via the control of the (104) crystal planes of MnCO3 for high rate Li-ions batteries
Yanshen Gao,
Xinlu Wang ,
Wensheng Yu,
Guixia Liu
 ,
Xiangting Dong
 and
Jinxian Wang
 *
*
School of Chemistry and Environmental Engineering, Changchun University of Science and Technology, Changchun 130022, P. R. China. E-mail: wjx87@sina.com; Fax: +86-0431-85383815; Tel: +86-18686684860
First published on 4th July 2019
Abstract
We have studied a synthetic route to control the morphology of MnCO3 precursors. Taking the (104) crystal planes in the structure of MnCO3 as the research point, the hydrothermal method was used to synthesize MnCO3 cubes with highly exposed (104) crystal planes and densely crystallized MnCO3 spheres by changing the water–ethanol reaction system. The MnCO3 cubes and spheres were used as self templates to prepare spinel LiMn2O4 by thermal decomposition and topological crystallization. The formation mechanism of MnCO3 and LiMn2O4 was analyzed using characterization methods such as X-ray diffraction, scanning electron microscopy and high-resolution transmission electron microscopy. Electrochemical tests evidenced that the electrochemical performance of the as-made cubic and spherical LiMn2O4 significantly improved compared with that of pristine LiMn2O4. The results manifested that the LiMn2O4 cubes and spheres have superior discharge capacity, delivering first discharge capacities of 130 and 115.1 mA h g−1 at 0.5C, and 96.4 and 88.3 mA h g−1 even at a high rate of 20C, respectively. After calculating the Li+ diffusion coefficients of the samples, the results elicited that the diffusion ability of the Li+ in the cubic and spherical LiMn2O4 was significantly improved.
1. Introduction
As a variety of lithium ion battery cathode material, spinel LiMn2O4 is one of the most promising candidates because of its low cost, low toxicity, and environmental friendliness.1–5 However, its low charge transfer rate and slow Li+ diffusion ability result in poor rate performance,6–8 which seriously restricts the application of this material in hybrid electric vehicles. To the best of our knowledge, the rate performance is closely related to the charge transfer rate, and the charge transfer rate is limited by the diffusion of Li+ in the material.9 The characteristic diffusion time of Li+ is known from the equation τ = l2/D,9,10 which is proportional to the diffusion distance (l) and inversely proportional to the Li+ diffusion coefficient (D). To reduce the diffusion time, either a shortened diffusion distance or increased diffusion coefficient is needed. The preparation of LiMn2O4 as a nano-material with a certain morphology is a method that can effectively shorten the diffusion distance between lithium ions.11 For example, it has been prepared as nanoparticles,12 nanowires,7 nanotubes,13 nanorods,14 nanospheres,15 and so on. However, some nanomaterial shapes are complicated to prepare and may encounter some undesirable side reactions due to the high specific surface area in the operating environment of the batteries.15,16 Therefore, preparation of a porous micro-sized cathode material with a certain morphology is still one of the strategies for effectively improving the electrochemical performance.Among the synthetic methods used to obtain a certain morphology, the hard template method and the self-template method have been most commonly used. The hard template method is costly to use and usually requires attention to the additional reaction against LiMn2O4.17 For the self-template method, precursors with a certain morphology can be retained before and after the reaction. Among these synthesis strategies of LiMn2O4, MnCO3 is a relatively common reaction precursor. That is to say, LiMn2O4 produced using the self-template method commonly possesses a similar morphology to its corresponding precursor MnCO3 during the thermal decomposition and lithiation processes, which is reasonable and beneficial for controlling the structures of the final products.
To fabricate MnCO3 precursors, at present the hydrothermal/solvothermal method and facile room temperature precipitation method are generally employed.18–24 Rapid precipitation and aggregation usually leads to spherical shaped MnCO3. Besides this, Huang et al.21 explored the pH value of the precipitation system and prepared cubic and spherical MnCO3 precursors. Wu et al.22 fabricated LiMn2O4 from cubic MnCO3 and spherical MnCO3 precursors by adding cetyl trimethylammonium bromide (CTAB) and adjusting the pH value of the precipitation system. However, in order to ensure uniform precipitation of the precursor, the precipitation temperature and the pH value must be strictly controlled, and the pH value boundary between the two morphologies is narrow.
MnCO3 is similar in structure to CaCO3, one of the most widely studied biominerals, as they belong to the same MCO3 (M = Ca, Mn, Ba, etc.) crystalline type. Generally, polycrystalline biominerals exhibit various morphologies, with small crystal building blocks that can be used to compose complex structures.25,26 Herein, the most common CaCO3 crystal morphology is calcite-type rhombohedra,27 with the characteristic (104) crystal planes of the morphology having the lowest surface energy.28 Additives can be adsorbed onto the specific crystal planes of nanocrystals, thus changing the subsequent aggregation process.29 In particular, some organic substances (for example, ethanol) have strong interactions between the (104) crystal planes.27,30–34 Based on the relative theories above, we prepared a MnCO3 cube precursor with highly exposed (104) crystal planes using a hydrothermal method without strict control of the pH and the addition of a structure directing agent, and changed the crystal stacking mode by simply adding ethanol solvent into the spherical material without changing the other conditions. The corresponding microporous cubic and spherical LiMn2O4 materials were then obtained by self-templated thermal decomposition and lithiation reactions and used as cathode materials for lithium ion batteries, wherein the cubic and spherical LiMn2O4 exhibited good cycling performance and rate performance, and the lithium ion diffusion ability was significantly improved. We have also discussed in detail the formation mechanism of the morphological diversity of MnCO3 and LiMn2O4.
2. Experimental
2.1. Synthesis of MnCO3 cubes and spheres
The cubic and spherical MnCO3 precursors were prepared using a hydrothermal method. Firstly, 1 mmol of MnSO4·H2O and 0.1 mol of urea were dissolved in 120 mL of deionized water, and then 80 mL of the solution mixture was transferred into a 100 mL Teflon-lined stainless-steel autoclave. The sealed reactor was maintained at 150 °C for 10 h and then cooled down to ambient temperature. After filtration, the precipitate was washed four times with deionized water and ethanol, then dried at 120 °C over 12 h to obtain the MnCO3 cubes. The preparation of the MnCO3 spheres was similar to that of the MnCO3 cubes, using the same amounts of MnSO4 and urea, reaction temperature and time as those of the MnCO3 cubes. The only difference was the use of mixed solvents (72 mL of distilled water and 48 mL of ethanol to dissolve MnSO4 and urea). After the solvothermal reaction, the precipitated product was also washed and dried using the same conditions as those used to obtain MnCO3 spheres.2.2. Preparation of cubic and spherical LiMn2O4
The two different morphologies of MnCO3 were pre-sintered at 550 °C for 3 h for conversion into Mn2O3. Thereafter, the oxide powders were mixed with Li2CO3 (Li2CO3![[thin space (1/6-em)]](https://www.rsc.org/images/entities/char_2009.gif) :
:![[thin space (1/6-em)]](https://www.rsc.org/images/entities/char_2009.gif) Mn2O3 = 0.54
Mn2O3 = 0.54![[thin space (1/6-em)]](https://www.rsc.org/images/entities/char_2009.gif) :
:![[thin space (1/6-em)]](https://www.rsc.org/images/entities/char_2009.gif) 1, molar ratio) and then at 750 °C for 12 h in the air to obtain the final cubic and spherical LiMn2O4 products, respectively.
1, molar ratio) and then at 750 °C for 12 h in the air to obtain the final cubic and spherical LiMn2O4 products, respectively.
2.3. High temperature solid state preparation of pristine LiMn2O4
MnO2 and Li2CO3 were weighed according to the stoichiometric ratio, carefully ground and uniformly mixed, and then placed in a high-temperature tube furnace and calcined at a temperature of 750 °C for 12 h to obtain pristine LiMn2O4.2.4. Characterization
The structures of the prepared materials were characterized by X-ray diffractometer (TD-3000, Dandong Tongda Co, LTD, China) equipped with a Cu Kα radiation source with continuous scanning in the 2θ range of 10–90°, at a scan rate of 0.02° per minute. Morphological characterization of the hydrothermal precursors and final calcined products was achieved by scanning electron microscopy (SEM, JMS-7610F, JEOL), and high-resolution transmission electron microscopy (HRTEM: JEM-2100, 180 kV). The final products were assembled into CR2032 coin-cell type batteries and their electrochemical performances were tested. The cathode material slurry was composed of 70 wt% active materials, 20 wt% acetylene black and 10 wt% polyvinylidene fluoride in N-methyl-2-pyrrolidone, carefully mixed and uniformly coated onto aluminum foil and then vacuum dried at 120 °C for 12 h. Lithium metal foil was used as the battery anode material and LiPF6 as the electrolyte, and the assembly was carried out in an argon filled glove box, keeping the oxygen and moisture content under 0.01 ppm. The electrochemical performances of the test cells were measured using a battery testing system (BTS-5 V/10 mA, Neware Technology Limited Corporation, China) over a cycling voltage range of 3.0–4.5 V and rate voltage range of 3.0–4.3 V. (1C = 148 mA h g−1). Electrochemical impedance measurements were conducted using an electrochemical workstation (CHI-760D, Shanghai Chenhua Instrument Limited Corporation, China) over a frequency range of 0.01 Hz to 100 kHz. The impedance fitting was accomplished utilizing Zview software, limiting the systematic error of the calculations to under 10%.3. Results and discussion
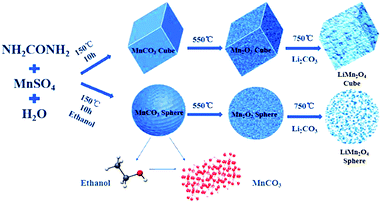
Cubic and spherical LiMn2O4 were prepared using a hydrothermal and temperature solid phase method. A schematic diagram of the preparation method is shown in Fig. 1.The following chemical reactions mainly occur in the hydrothermal process:35
| NH2CONH2 + H2O → 2NH3 + CO2 | (1) |
| NH3 + H2O → NH4+ + OH− | (2) |
| CO2 + 2OH− → CO32− + H2O | (3) |
| CO32− + Mn3+ → MnCO3 | (4) |
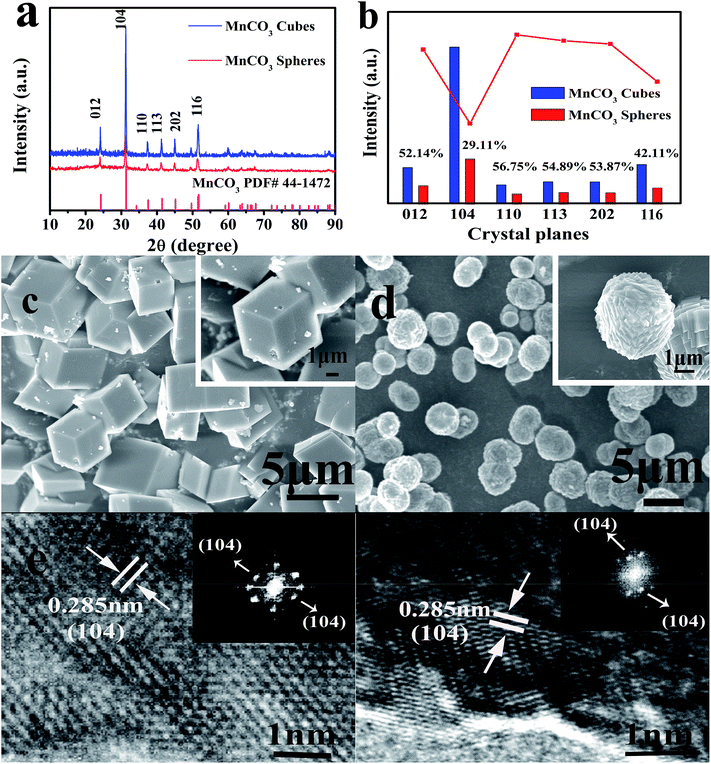
In the first hydrothermal step shown in Fig. 1, MnSO4 provides Mn2+ ions for the reaction, and urea acts as a precipitant. When the solvent is pure water, the macroscopic morphology of the MnCO3 precipitate was cubic after the reaction. In contrast, after adding ethanol into the pure water reaction system, a series of reactions occurred that led to a final product of MnCO3 spheres. The XRD characterization of the hydrothermal products derived from different solvent systems is shown in Fig. 2a.
The typical characteristic peaks of MnCO3 are shown in Fig. 2a. The prepared MnCO3 cubes and spheres are in the R![[3 with combining macron]](https://www.rsc.org/images/entities/char_0033_0304.gif) m space group, and can be well indexed to PDF#44-1472. The average crystallite sizes of the MnCO3 cubes and spheres were calculated by the Debye–Scherrer equation from the full width half maximum (FWHM) of the XRD diffraction peaks and were found to be 42.8 and 34.6 nm for the cubes and spheres, respectively. Due to the heteromorphism of carbonate minerals, vaterite usually exhibits a spherical morphology,26 but in this experiment, the addition of ethanol did not affect the overall crystal structure. In the meantime, as shown in the histogram of Fig. 2b, combining the results of ISpheres/ICubes in the inset, the intensity of the XRD characteristic peaks of the MnCO3 spheres after ethanol participation was remarkably lowered, especially for the (104) crystal planes. For the MnCO3 crystal, its structure and crystal growth pattern are similar to those of CaCO3. Among the numerous crystal planes of MnCO3, the (104) crystal planes are the characteristic crystal planes,36 composed of Mn2+ and CO32−, densely distributed, and have the lowest surface energy. According to the Bravais law,37 the crystal growth rate is inversely proportional to the density of the surface network. During the growth of the MnCO3 cubes, the growth direction is mainly in the direction of the vertical (104) crystal planes. After the crystal growth is completed, the crystal planes are completely retained, and the morphology of the final product is a thermodynamically stable calcite rhombohedral crystal, as shown in Fig. 2c. In this formation process, the least dense phase is formed first and transforms to the next stage phase, and finally, the most dense phase, which is the most stable phase. This kinetic transformation process is strictly in order of increasing thermodynamic stability.29 The energy changes during the formation follow Wolfgang Ostwald's “steps rule”.38 The dense surface of the block is smooth and the particle size is 2–5 μm.
m space group, and can be well indexed to PDF#44-1472. The average crystallite sizes of the MnCO3 cubes and spheres were calculated by the Debye–Scherrer equation from the full width half maximum (FWHM) of the XRD diffraction peaks and were found to be 42.8 and 34.6 nm for the cubes and spheres, respectively. Due to the heteromorphism of carbonate minerals, vaterite usually exhibits a spherical morphology,26 but in this experiment, the addition of ethanol did not affect the overall crystal structure. In the meantime, as shown in the histogram of Fig. 2b, combining the results of ISpheres/ICubes in the inset, the intensity of the XRD characteristic peaks of the MnCO3 spheres after ethanol participation was remarkably lowered, especially for the (104) crystal planes. For the MnCO3 crystal, its structure and crystal growth pattern are similar to those of CaCO3. Among the numerous crystal planes of MnCO3, the (104) crystal planes are the characteristic crystal planes,36 composed of Mn2+ and CO32−, densely distributed, and have the lowest surface energy. According to the Bravais law,37 the crystal growth rate is inversely proportional to the density of the surface network. During the growth of the MnCO3 cubes, the growth direction is mainly in the direction of the vertical (104) crystal planes. After the crystal growth is completed, the crystal planes are completely retained, and the morphology of the final product is a thermodynamically stable calcite rhombohedral crystal, as shown in Fig. 2c. In this formation process, the least dense phase is formed first and transforms to the next stage phase, and finally, the most dense phase, which is the most stable phase. This kinetic transformation process is strictly in order of increasing thermodynamic stability.29 The energy changes during the formation follow Wolfgang Ostwald's “steps rule”.38 The dense surface of the block is smooth and the particle size is 2–5 μm.
Fig. 2d shows MnCO3 spheres prepared using a mixed solution system of ethanol and water under the same reaction conditions. It can be observed that the spheres mainly feature the stacking of cubic blocks. Herein, we have analyzed the formation process of the MnCO3 spheres. When ethanol is added at the beginning of the hydrothermal reaction, the overall viscosity of the system changes first, which can be described by the exponential expression:39
η = ηIL![[thin space (1/6-em)]](https://www.rsc.org/images/entities/char_2009.gif) exp[−xc/a] exp[−xc/a]
| (5) |
| D = RT/6πηr | (6) |
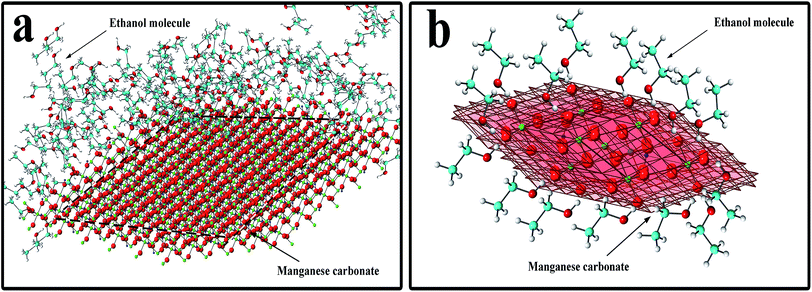
In eqn (5), xc is the mole fraction of water, α is a characteristic constant of the mixture, and ηIL is the viscosity of the pure ionic liquid.39 In eqn (6), D is the diffusion constant, η is the solution viscosity, and r is the particle radius.35 It can be seen from eqn (6) that the diffusion coefficient is proportional to the reciprocal of the liquid viscosity, and ethanol plays a role in the crystallization process. In the hydrothermal reaction, when MnCO3 is precipitated, the ethanol molecules in the solution instantaneously adsorb to the precipitated MnCO3, especially to the (104) crystal planes of MnCO3. The mechanism is shown in Fig. 3. Fig. 3a shows the overall effect of ethanol molecules on the MnCO3 crystals, where the red planes in Fig. 3b are the {104} planes of the MnCO3 crystal. The hydrophilic hydroxyl group of the ethanol molecule strongly interacts with the oxygen on the (104) crystal planes, and at the same time, the hydrophobic group –CH3 is exposed to the outside to form an extremely stable and orderly hydrophobic adsorption layer.27,31,33 The existence of the adsorption layer seriously reduces the growth ability of the (104) crystal planes in the vertical direction,30 changes the surface energy and the MnCO3 particles gradually undergo directional crystallization, and the blocks are densely packed into spheres. Also, the hydroxyl group is present in the pure water reaction system, where the lowest surface energy is stabilized, especially if its adsorption capacity is insufficient to change the equilibrium shape.40 Therefore, the addition of ethanol plays an important role in the morphology control.
The MnCO3 precursor of the obtained sample was further examined by high resolution transmission electron microscopy (HRTEM) and its Fast Fourier transform (FFT) pattern was recorded. From the HRTEM images of the lattice fringes (Fig. 2e and f), a lattice distance of 0.285 nm can be observed, which is in squares showing the d-spacing of the (104) crystal planes of the MnCO3 and the highly crystalline crystals have a relatively regular boundary. From the FFT pattern studies, it is apparent that the crystallinity of the product obtained by adding ethanol is reduced in quality. This result is in agreement with the XRD analysis.
The chemical reaction equation for the calcining of the MnCO3 precursor in an air atmosphere at 550 °C is as follows:15
| 2MnCO3 + O2 → 2MnO2 + 2CO2 | (7) |
| 2MnO2 → Mn2O3 + 0.5O2 | (8) |
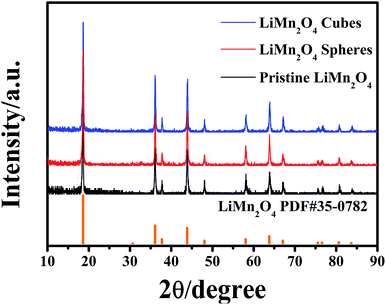
The final product was obtained by calcining the manganese oxide with Li2CO3 at 750 °C in air, and their corresponding XRD patterns are shown in Fig. 4. The diffracted characteristic peaks of the LiMn2O4 cubes, spheres and pristine sample are completely coincident with those of spinel LiMn2O4 (PDF#35-0782), and there is no impurity phase detected, with ideal crystallinity. Fig. 5a and b show the SEM images of the LiMn2O4 cubes and LiMn2O4 spheres, respectively, and it can be seen that the particle size after calcination did not change significantly compared to the size before calcination. The surfaces of the LiMn2O4 cubes and LiMn2O4 spheres are rough and have a porous structure with a particle size of about 3 μm. Since the decomposition of the Li2CO3 during calcination releases CO2, the retention of the morphology of the final product is affected, but the morphology of most of the product is retained. The calcination process can be explained by a template formation mechanism. During the calcination process, Li2CO3 thermally decomposes to form Li2O,41 and Li2O undergoes a topological crystallization reaction with thermodynamically stable Mn2O3,15 thereby largely retaining the morphology consistent with that of the precursor.
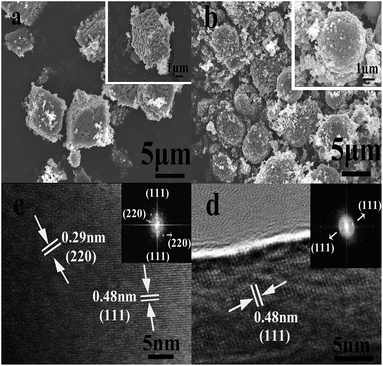 | ||
| Fig. 5 SEM images of the LiMn2O4 cubes and spheres: (a) LiMn2O4 cubes, (b) LiMn2O4 spheres. HRTEM and fast Fourier Transform (FFT) images of the (c) LiMn2O4 cubes and (d) LiMn2O4 spheres. | ||
The HRTEM characterization and FFT patterns of the LiMn2O4 cubes and spheres were carried out and the results are shown in Fig. 5c and d. Lattice fringes with a spacing of 0.48 nm can be observed, perfectly matching the distance between the (111) crystal planes of spinel LiMn2O4. Moreover, in the FFT patterns of the LiMn2O4 cubes and spheres, the LiMn2O4 cubes exhibit better crystallinity on the (111) crystal plane than the LiMn2O4 spheres. For spinel LiMn2O4, the crystal plane (111) facilitates Li+ insertion/deinsertion behaviour, which increases the rate and cycling capabilities of spinel LiMn2O4, and the crystal plane (111) has lesser Mn dissolution and a more stable reconstructed surface structure.42,43 Hence, the LiMn2O4 cubes show better electrochemical activity and stability than the LiMn2O4 spheres.
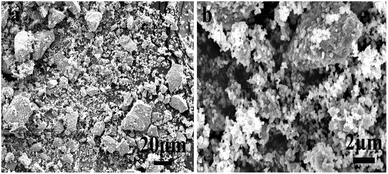
Fig. 6a and b show the morphology of pristine LiMn2O4 synthesized via a one-step high temperature solid state method. It can be observed that a large number of irregular aggregates exist due to the non-uniform crystallization in the sintering reaction.
Fig. 7a shows the cycling capabilities of the LiMn2O4 cubes, spheres, and pristine LiMn2O4 electrodes at a current density of 0.5C in the voltage range of 3.0–4.5 V, where the LiMn2O4 cubes, spheres and pristine samples have first discharge capacities of 130, 115.1 and 106 mA h g−1, respectively. As shown in Fig. 7b, after 100 cycles, the capacity retention rates are 87.9%, 80.49%, and 43.96%, respectively. The first capacity was increased by 22.6% and 8.5%, respectively, compared to that of the pristine LiMn2O4.
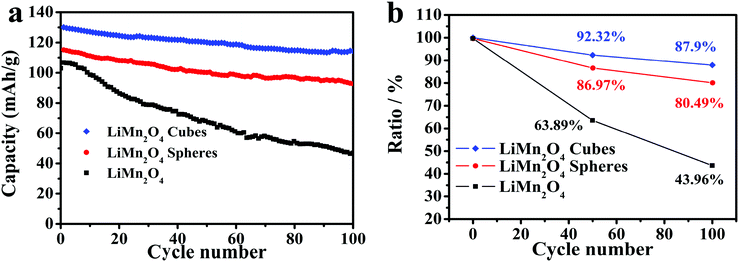 | ||
| Fig. 7 (a) Cycling performance of the LiMn2O4 cubes, spheres, and pristine LiMn2O4 at a current rate of 0.5C. (b) Discharge capacity retention of the LiMn2O4 cubes, spheres, and pristine LiMn2O4. | ||
It is worth mentioning that the discharge capacity of the LiMn2O4 cubes at a current density of 0.5C is very close to the theoretical capacity. Compared to the pristine LiMn2O4, the capacity increase is very obvious.
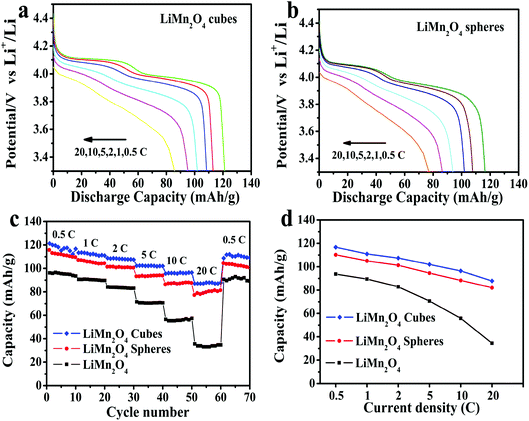
Fig. 8a and b show the first discharge curves for the LiMn2O4 cubes and spheres at different rates of 0.5, 1, 2, 5, 10 and 20C, respectively. As can be seen, both the LiMn2O4 cubes and LiMn2O4 spheres exhibit two voltage plateaus in their discharge curves, characteristic of typical spinel LiMn2O4.44 As the current density increases, the curve gradually becomes smoother, such as at 20C. This is due to an increase in cell polarization under high current charge and discharge.45
The first discharge capacities of the LiMn2O4 cubes are 121.3, 116.7, 110.9, 107.4, 101.9 and 96.4 mA h g−1 at 0.5, 1, 2, 5, 10 and 20C, respectively, while the corresponding values for the LiMn2O4 spheres are 116.4, 107.8, 105, 101.3, 94.6 and 88.3 mA h g−1. Fig. 8c shows the rate capabilities of the LiMn2O4 cubes, spheres, and pristine LiMn2O4. As the current density increases, the capacities of all of the samples decrease. The pristine LiMn2O4 exhibits a first discharge capacity of 95.9 mA h g−1 at 0.5C and a dramatically decreased value of 35.3 mA h g−1 at a high current of 20C. However, the LiMn2O4 cubes and LiMn2O4 spheres maintain a highly discharge capacity and capacity retention rate during the high current charge and discharge tests. Fig. 8d shows a tendency for the discharge capacity to decrease as the current density increases. The downward trend in the volume of the pristine LiMn2O4 is quite obvious, and the LiMn2O4 cubes and spheres show a trend towards lower capacity loss. It is obvious that the LiMn2O4 cubes and LiMn2O4 spheres show better structural stability in the high rate current tests. The ordered morphology and loose porous structure of the samples effectively shortens the diffusion distance of Li+ in the electrochemical reaction, effectively alleviating the volume change caused by charge and discharge. The data in Fig. 9 is compared to the discharge capacities of LiMn2O4 electrodes reported in ref. 46–49, where it can be seen that the LiMn2O4 cube and sphere electrodes exhibited a superior high rate performance at rates of 5–20C.
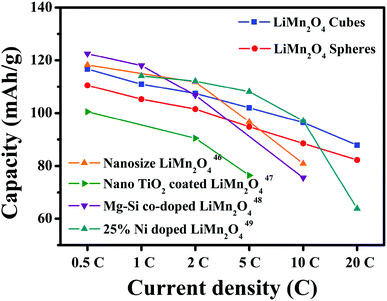 | ||
| Fig. 9 Discharge capacity compared with that of LiMn2O4 electrodes reported in ref. 46–49. | ||
Fig. 10a depicts the electrical impedance spectra (EIS) using the equivalent circuit by the Zview software. The horizontal axis part is the real part impedance Z′ and the vertical axis part is the imaginary part impedance Z′′. The EIS spectrum is mainly composed of a semicircular curve in the high frequency and medium frequency regions and a straight line in the low frequency region. The intercept of the arc curve and the horizontal axis is the ohmic resistance Rs, the semicircular curve of the high frequency and medium frequency regions represents the charge transfer resistance Rct, and the straight line in the low frequency region and the Li+ in the LiMn2O4 electrode material relate to the spread, represented by the Warburg impedance (Zw).15,50,51 The Zview software is used to fit the impedance parameters using the equivalent circuit to obtain the parameters. The Rct values of the LiMn2O4 cubes, spheres, and pristine LiMn2O4 were calculated to be 176.6, 193.2, and 219.7 Ω, respectively, and the Warburg coefficient and diffusion coefficient of lithium ions in the low frequency region were calculated using the following equation:15,50
| |Z| = Rs + Rct + σwω−1/2 | (9) |
| DLi+ = R2T2/2A2n4F4C2σ2 | (10) |
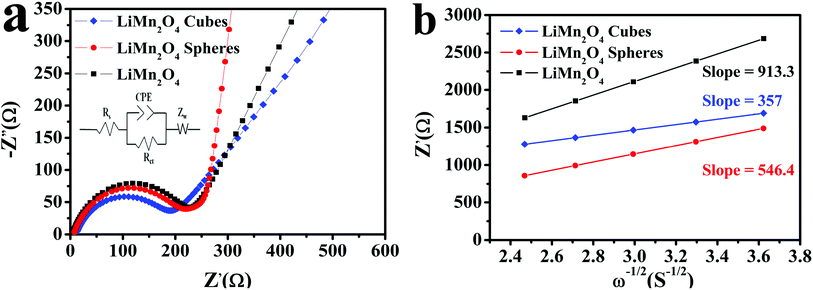 | ||
| Fig. 10 (a) The fitted EIS curves of the LiMn2O4 cubes, spheres, and pristine LiMn2O4 and (b) fitting line function diagram of Z′ and ω−1/2. | ||
Compared with the data obtained for the carbonate precursor or the same morphology synthesized using different methods (as shown in Table 1), it could be seen that the hydrothermal and ethanol assisted hydrothermal routes are the ideal routes to use to synthesize a precursor with a different morphology and final products that have a better electrochemical performance. Using this method, the carbonate precursor can be obtained under mild reaction conditions, and a better discharge capacity of the LiMn2O4 electrode charge/discharge can be achieved at a higher current density.
| Host | Preparation method (precursor) | Capacity (mA h g−1)/rate | Ref. |
|---|---|---|---|
| LiMn2O4 hollow microspheres | Precipitation | 106.7/5C | 8 |
| 88.7/10C | |||
| LiMn2O4 hollow microspheres | Precipitation | 86.3/10C | 54 |
| Yolk-structured LiMn2O4 microspheres | Precipitation | 94.7/10C | 55 |
| LiMn2O4 spheres | Precipitation | 109/5C | 15 |
| 98/10C | |||
| 83/20C | |||
| LiAlxMn2−xO4 microspheres | Co-precipitation | 82.4/10C | 56 |
| Si-modified LiNi0.5Mn1.5O4 microspheres | Co-precipitation | 100/10C | 57 |
| LiNi0.5Mn1.5O4 spheres | Hydrothermal | 58/5C | 58 |
| Porous core–shell LiMn2O4 microellipsoids | Hydrothermal | 70.2/10C | 1 |
| LiMn2O4 microcubes | Hydrothermal | 68/5C | 6 |
| LiNi0.5Mn1.5O4 microcubes | Co-precipitation | 99/5C | 59 |
| LiMn2O4 nanocubes | Solution combustion | 104/200 mA g−1(1.35C) | 60 |
| LiMn2O4 microcubes | Hydrothermal | 101.9/10C, 96.4/20C | This work |
| LiMn2O4 microspheres | Ethanol assisted hydrothermal | 94.6/10C, 88.3/20C |
4. Conclusions
We have adopted a synthetic strategy for preparing MnCO3 precursors with different morphologies. MnCO3 cubes and spheres were prepared using the crystal planes (104) in the structure of MnCO3 as the synthetic entry point. After thermal decomposition and lithiation, a LiMn2O4 cathode material was obtained. Even if the lithium source was Li2CO3, the morphology was still largely retained after high-temperature calcination. The macro-ordered surfaces of the prepared LiMn2O4 cubes and spheres are porous, which provides a space for the diffusion of lithium ions, significantly improving the lithium-ion solid-phase diffusion ability. And, the electrochemical performance was remarkably improved, especially the rate performance, without the need for any coating and doping with other elements. This synthetic strategy can be applied to the synthesis of other oxides and in other fields.Conflicts of interest
There are no conflicts to declare.Acknowledgements
This research has been supported by the Natural Science Foundation of Jilin Province (No. 20170101128JC), the Youth Foundation of Changchun University of Science and Technology (no. XQNJJ-2014-13, XJJLG-2014-10), the Industrial Technology Research and Development Project of Jilin Province Development and Reform Commission (2017C052-4), and the Science and Technology Planning Project of Changchun City (no. 2013064).References
- J. Deng, J. Pan, Q. Yao, Z. Wang, H. Zhou and G. Rao, J. Power Sources, 2015, 278, 370–374 CrossRef CAS.
- F. Marchini, E. J. Calvo and F. J. Williams, Electrochim. Acta, 2018, 269, 706–713 CrossRef CAS.
- J. Wang, Y.-y. Yu, B.-h. Wu, W.-q. Lin, J.-y. Li and J.-b. Zhao, J. Mater. Chem. A, 2015, 3, 2353–2360 RSC.
- Y. Deng, Y. Zhou, Z. Shi, X. Zhou, X. Quan and G. Chen, J. Mater. Chem. A, 2013, 1, 8170–8177 RSC.
- G. Xu, Z. Liu, C. Zhang, G. Cui and L. Chen, J. Mater. Chem. A, 2015, 3, 4092–4123 RSC.
- Y. Wu, Z. Wen, H. Feng and J. Li, Small, 2012, 8, 858–862 CrossRef CAS PubMed.
- W. Sun, H. Liu, Y. Liu, G. Bai, W. Liu, S. Guo and X. Z. Zhao, Nanoscale, 2015, 7, 13173–13180 RSC.
- L. Zhou, X. Zhou, X. Huang, Z. Liu, D. Zhao, X. Yao and C. Yu, J. Mater. Chem. A, 2013, 1, 837–842 RSC.
- S. Chen, Z. Chen and C. Cao, Electrochim. Acta, 2016, 199, 51–58 CrossRef CAS.
- M. D. Levi and D. Aurbach, J. Phys. Chem. B, 1997, 101, 4641–4647 CrossRef CAS.
- S.-T. Myung, K. Amine and Y.-K. Sun, J. Power Sources, 2015, 283, 219–236 CrossRef CAS.
- A. K. Jahja, M. Panitra, W. Honggowiranto, S. Mustofa and Y. Yunasfi, Ionics, 2015, 22, 219–227 CrossRef.
- Y.-L. Ding, J. Xie, G.-S. Cao, T.-J. Zhu, H.-M. Yu and X.-B. Zhao, Adv. Funct. Mater., 2011, 21, 348–355 CrossRef CAS.
- H. Zhao, F. Li, X. Liu, W. Xiong, B. Chen, H. Shao, D. Que, Z. Zhang and Y. Wu, Electrochim. Acta, 2015, 166, 124–133 CrossRef CAS.
- Y. Wang, X. Shao, H. Xu, M. Xie, S. Deng, H. Wang, J. Liu and H. Yan, J. Power Sources, 2013, 226, 140–148 CrossRef CAS.
- X. Zhu, X. Li, Y. Zhu, S. Jin, Y. Wang and Y. Qian, J. Power Sources, 2014, 261, 93–100 CrossRef CAS.
- Z. Zou, Z. Li, H. Zhang, X. Wang and C. Jiang, J. Mater. Sci. Technol., 2017, 33, 781–787 CrossRef.
- R. Xing, R. Li, Y. Xu, B. Li, J. Liu, S. Liu, D. Luo and L. Mao, Ceram. Int., 2017, 43, 14426–14430 CrossRef CAS.
- J. Zhao, Y. Li, Z. Xu, D. Wang, C. Ban and H. Zhang, Electrochim. Acta, 2018, 289, 72–81 CrossRef CAS.
- X. Xiao, J. Lu and Y. Li, Nano Res., 2010, 3, 733–737 CrossRef CAS.
- S. Huang, H. Wu, P. Chen, Y. Guo, B. Nie, B. Chen, H. Liu and Y. Zhang, J. Mater. Chem. A, 2015, 3, 3633–3640 RSC.
- Y. Wu, J. Zhang and C. Cao, Nano Res., 2017, 11, 246–253 CrossRef.
- Y. Tang, Y. Lu and G. Luo, Ind. Eng. Chem. Res., 2017, 56, 10036–10043 CrossRef CAS.
- J. Li, C. Cao, X. Xu, Y. Zhu and R. Yao, J. Mater. Chem. A, 2013, 1, 11848–11852 RSC.
- F. C. Meldrum and H. Colfen, Chem. Rev., 2008, 108, 4332–4432 CrossRef CAS PubMed.
- K. K. Sand, J. D. Rodriguez-Blanco, E. Makovicky, L. G. Benning and S. L. S. Stipp, Cryst. Growth Des., 2011, 12, 842–853 CrossRef.
- K. S. Keller, M. H. Olsson, M. Yang and S. L. Stipp, Langmuir, 2015, 31, 3847–3853 CrossRef CAS PubMed.
- A. M. Bano, P. M. Rodger and D. Quigley, Langmuir, 2014, 30, 7513–7521 CrossRef CAS PubMed.
- K. K. Sand, M. Yang, E. Makovicky, D. J. Cooke, T. Hassenkam, K. Bechgaard and S. L. Stipp, Langmuir, 2010, 26, 15239–15247 CrossRef CAS PubMed.
- D. J. Cooke, R. J. Gray, K. K. Sand, S. L. Stipp and J. A. Elliott, Langmuir, 2010, 26, 14520–14529 CrossRef CAS PubMed.
- S. S. Hakim, M. H. M. Olsson, H. O. Sorensen, N. Bovet, J. Bohr, R. Feidenhans'l and S. L. S. Stipp, Sci. Rep., 2017, 7, 7592 CrossRef CAS PubMed.
- N. Bovet, M. Yang, M. S. Javadi and S. L. Stipp, PCCP Phys. Chem. Chem. Phys., 2015, 17, 3490–3496 RSC.
- K. K. Sand, M. Yang, E. Makovicky, D. J. Cooke, T. Hassenkam, K. Bechgaard and S. L. Stipp, Langmuir, 2010, 26, 15239–15247 CrossRef CAS PubMed.
- H. Imada, K. Kimura and H. Onishi, Langmuir, 2013, 29, 10744–10751 CrossRef CAS PubMed.
- W.-H. Ryu, S.-J. Lim, W.-K. Kim and H. Kwon, J. Power Sources, 2014, 257, 186–191 CrossRef CAS.
- Z. Li, J. Xu, X. Chen, Q. Zhou and T. Shang, Colloid Polym. Sci., 2011, 289, 1643–1651 CrossRef CAS.
- J. D. H. Donnay and D. Harker, Am. Mineral., 1937, 22, 446–467 CAS.
- H. Colfen and S. Mann, Angew. Chem., 2003, 42, 2350–2365 CrossRef PubMed.
- X. Duan, J. Lian, J. Ma, T. Kim and W. Zheng, Cryst. Growth Des., 2010, 10, 4449–4455 CrossRef CAS.
- F. R. Massaro, L. Pastero, M. Rubbo and D. Aquilano, J. Cryst. Growth, 2008, 310, 706–715 CrossRef CAS.
- R. Wang, X. Li, Z. Wang, H. Guo, T. Hou, G. Yan and B. Huang, J. Alloys Compd., 2015, 618, 349–356 CrossRef CAS.
- Y. Wu, C. Cao, J. Zhang, L. Wang, X. Ma and X. Xu, ACS Appl. Mater. Interfaces, 2016, 8, 19567–19572 CrossRef CAS PubMed.
- H. B. Lin, Y. M. Zhang, H. B. Rong, S. W. Mai, J. N. Hu, Y. H. Liao, L. D. Xing, M. Q. Xu, X. P. Li and W. S. Li, J. Mater. Chem. A, 2014, 2, 11987 RSC.
- K.-W. Nam, W.-S. Yoon, H. Shin, K. Y. Chung, S. Choi and X.-Q. Yang, J. Power Sources, 2009, 192, 652–659 CrossRef CAS.
- Y. L. Ding, J. Xie, G. S. Cao, T. J. Zhu, H. M. Yu and X. B. Zhao, J. Phys. Chem. C, 2011, 115, 9821–9825 CrossRef CAS.
- S. Li, D. Lei, Y. Xue, S. Geng and X. Cui, Ionics, 2017, 23, 1979–1984 CrossRef CAS.
- Y. Shang, X. Lin, X. Lu, T. Huang and A. Yu, Electrochim. Acta, 2015, 156, 121–126 CrossRef CAS.
- H. Zhao, F. Li, X. Liu, C. Cheng, Z. Zhang, Y. Wu, W. Xiong and B. Chen, Electrochim. Acta, 2015, 151, 263–269 CrossRef CAS.
- Z. Moorhead-Rosenberg, A. Huq, J. B. Goodenough and A. Manthiram, Chem. Mater., 2015, 27, 6934–6945 CrossRef CAS.
- T. Shi, Y. Dong, C.-M. Wang, F. Tao and L. Chen, J. Power Sources, 2015, 273, 959–965 CrossRef CAS.
- D. Guo, Z. Chang, H. Tang, B. Li, X. Xu, X.-Z. Yuan and H. Wang, Electrochim. Acta, 2014, 123, 254–259 CrossRef CAS.
- L. J. Xi, H.-E. Wang, Z. G. Lu, S. L. Yang, R. G. Ma, J. Q. Deng and C. Y. Chung, J. Power Sources, 2012, 198, 251–257 CrossRef CAS.
- X. Wang, H. Hao, J. Liu, T. Huang and A. Yu, Electrochim. Acta, 2011, 56, 4065–4069 CrossRef CAS.
- Y. Mao, S. Xiao and J. Liu, Mater. Res. Bull., 2017, 96, 437–442 CrossRef CAS.
- Y. Qiao, Si. Li, Y. Yu and C. Chen, J. Mater. Chem. A, 2013, 1, 860–867 RSC.
- X. Yi, X. Wang, B. Ju, Q. Wei, X. Yang, G. Zou, H. Shu and L. Hu, J. Alloys Compd., 2014, 604, 50–56 CrossRef CAS.
- S. Nageswarana, M. Keppeler, S. Kim and M. Srinivasan, J. Power Sources, 2017, 346, 89–96 CrossRef.
- J. Cheng, X. Li, Z. Wang and H. Guo, Ceram. Int., 2016, 42, 3715–3719 CrossRef CAS.
- Y. Li, J. Wang, Z. Zhou, Q. Yao, Z. Wang, H. Zhou and J. Deng, Int. J. Electrochem. Sci., 2019, 14, 2822–2832 CrossRef CAS.
- S. A. Akhoon, A. H. Sofi, S. Rubab and M. A. Shan, J. Electron. Mater., 2017, 46, 992–998 CrossRef CAS.
| This journal is © The Royal Society of Chemistry 2019 |

