 Open Access Article
Layered composites composed of multi-walled carbon nanotubes/manganese dioxide/carbon fiber cloth for microwave absorption in the X-band†
Ke Zhaoab,
Shivam Guptab,
Ching Changb,
Jinquan Wei *a and
Nyan-Hwa Tai
 *b
*b
aState Key Lab of New Ceramics and Fine Processing, School of Materials Science and Engineering, Key Lab for Advanced Materials Processing Technology of Education Ministry, Tsinghua University, Beijing, P. R. China. E-mail: jqwei@tsinghua.edu.cn; Tel: +86-10-62781065
bDepartment of Materials Science and Engineering, National Tsing-Hua University, Hsinchu, Taiwan. E-mail: nhtai@mx.nthu.edu.tw; Tel: +886-3-5715131 ext. 42568
First published on 18th June 2019
Abstract
In this paper, multi-layered composites are fabricated for their application in electromagnetic interference (EMI) shielding. Composites of multi-walled carbon nanotubes/manganese dioxide (MnO2)/epoxy are used as a microwave absorption layer, and a commercial carbon fiber cloth is used as a reflection layer. When the electromagnetic (EM) waves impinge on such layered composites, the absorption layer can absorb most of the EM waves, and the transmitted EM waves from the absorption layer will be reflected back by the reflection layer and absorbed by the absorption layer. Based on the rational design, the composites with four absorption layers and one reflection layer (with a total thickness of 2.85 mm) show a high EMI shielding effectiveness of 41.24 dB, while the average reflection loss of 13.62 dB can be attained in the X-band (8.2–12.4 GHz). Moreover, the layered composites can absorb nearly 95% of the EM waves at the operating frequency, and provide an absorption dominant EMI shielding which are favorable for commercial and military applications.
1. Introduction
Nowadays, various electronics such as mobile phones, laptops, and wireless networks make our daily life very convenient. At the same time, they also cause electromagnetic interference (EMI) pollution, which not only disturbs neighbouring electronics and causes operational malfunction, but is also a hazard to human health and can cause damage to national defense security systems.1–3 Hence, high performance EMI shielding materials, especially electromagnetic (EM) wave absorbents, are in urgent demand to solve these problems by isolating the electronics from the surroundings.Previously, metal-based materials are widely used in reflection-mode EMI shielding owing to their high electrical conductivity and high dielectric constant.4–6 However, they are also susceptible to chemical corrosion and heavy weight, which hinder their applications in the miniaturization of electronic devices. Polymers embedded with conductive fillers for EMI shielding have attracted much interest in recent years.7–16 Among the broad variety of polymers suitable for EMI shielding applications, epoxy resin (EP) is a good candidate because of easy processing, oxidation resistance, stability in normal environment, and commercial popularity.12,13 Besides, other polymers like polyvinylidene fluoride (PVDF),7 polycarbonate (PC),14 poly(lactic acid),15 and polypropylene16 have also been studied. Metallic fillers, carbonaceous fillers and conductive conjugated polymers are commonly used to increase conductivity of the polymer matrix. Theoretically, high aspect ratio and uniform distribution of fillers contribute to the rapid establishment of conductive networks in matrix.17 Multi-walled carbon nanotubes (MWCNTs), which are widely used as fillers in composites, have high aspect ratio, low density, high carrier mobility along the axial direction and outstanding mechanical properties.18,19 Owing to their high conductivity, MWCNTs/polymer composites were frequently reported as reflection-dominant shielding materials with shielding effectiveness proportional to the concentration of MWCNTs in matrix.12,20–22
However, microwave reflection is still undesirable because the reflected waves may bring negative effects to the surroundings. High-performance EM wave absorbers have attracted much attention recently.23–26 According to the EM theory, magnetic materials such as Fe, Co, Ni, carbonyl iron and ferrites can consume the EM energy by natural ferromagnetic resonance and magnetic domain wall resonance27 while dielectric absorbers, including transition metal oxides like ZnO, TiO2, and MnO2 can attenuate EM waves by natural resonance and polarization relaxation.28–30 Additionally, carbonaceous materials and conjugated polymers can block EM radiation ascribe to their high conductivity. MnO2 has been regarded as one of the most promising microwave dielectric materials due to its many advantages, such as natural abundance, low cost, environment-friendly nature, thermal stability, broad bandwidth and high dielectric loss in the gigahertz frequency range.30–35
Besides the coupling of magnetic and electric dipoles induced by magnetic and dielectric components, respectively, it was reported that the structural design also plays an important role in EMI shielding performance. Particularly, multi-layered structures have attracted numerous interest.36–38 Biswas et al. designed a multi-layered assembly which was composed of binary blends of PC and PVDF with α-MnO2-doped MWCNTs and ferrite-doped cross-linked graphene oxide (GO) network, resulting in an impressive shielding effectiveness (SE) of 57 dB for a film with thickness of only 0.9 mm.37 Zhao et al. successively deposited polyaniline and magnetic Co/Ni alloy on commercial lyocell fabrics and achieved relatively high EMI SE of 33.95–46.22 dB within the X-band frequency.38
In view of the mentioned considerations, we designed a unique and easily-fabricated multi-layered structure with highly-efficient microwave absorption in X-band. The structure was composed of two layers: the first layer functioned as an absorption layer which was obtained by mixing EP with hybrid nanofillers consisting of MWCNTs and MnO2, and the second layer functioned as a reflection layer using a commercially available carbon fiber (CF) cloth. This design could be directly used in many areas like packaging, electronics and communication, which makes sure that almost no EM waves could penetrate out of the device and reduces the possibility of self-disturbance. Mechanisms of EMI shielding were studied and the microstructure and morphology were characterized using field emission scanning electron microscope (FESEM), X-ray diffraction (XRD) and Raman spectroscopy.
2. Experimental
2.1 Materials
Potassium permanganate (KMnO4) and manganese sulfate mono-hydrate (MnSO4·H2O) with analytical grade were purchased from the Uni-Onward Corporation and used as received. MWCNTs powders with diameter of 20–30 nm and length of 1 μm were obtained from the Golden Innovation Business Corporation. EP was purchased from the Hsin-Han Corporation, and the weight ratio of EP and hardener of 3![[thin space (1/6-em)]](https://www.rsc.org/images/entities/char_2009.gif) :
:![[thin space (1/6-em)]](https://www.rsc.org/images/entities/char_2009.gif) 1 was used. CF cloth was supplied by the Formosa Plastics Corporation and acted as a reflection layer with a thickness of 0.85 mm. Acetone and absolute ethanol were provided by the Echo Chemical Corporation Ltd.
1 was used. CF cloth was supplied by the Formosa Plastics Corporation and acted as a reflection layer with a thickness of 0.85 mm. Acetone and absolute ethanol were provided by the Echo Chemical Corporation Ltd.
2.2 Synthesis of α-MnO2
α-MnO2 nanorods were synthesized by an oil-bathing hydrothermal method31 at low temperature through the following reaction:| 3MnSO4·H2O + 2MnO4− → 3SO42− + 4H+ + 5MnO2↓ + H2O | (1) |
As shown in Fig. 1a, in a typical process for synthesizing α-MnO2, 3.16 g KMnO4 and 5.07 g MnSO4·H2O were dissolved in 160 mL deionized water successively at room temperature. Under vigorous magnetic agitation for 30 min, the homogeneous dark-brown solution was transferred into an oil bath pre-set at 80 °C and maintained for 18 h. Subsequently, the solution was cooled down to room temperature naturally. The precipitates were centrifuged and rinsed with deionized water and absolute ethanol several times until the supernatant was neutral, and then dried at 100 °C for 24 h. The obtained black powder was subjected to grind and was collected for characterization and the composite preparation.
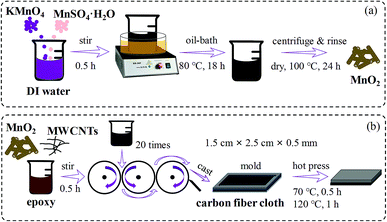 | ||
| Fig. 1 Schematic representation of the fabrication process for (a) MnO2 nanorods, (b) layered composites. | ||
2.3 Preparation of MWCNTs/MnO2/EP composites
MWCNTs/MnO2/EP composites were fabricated via a conventional casting method followed by hot-pressing, as depicted in Fig. 1b. Firstly, different weight ratios of MWCNTs, MnO2 nanorods and epoxy resin were mixed by magnetic stirring for 30 min. In order to obtain a uniform dispersion of nanofillers, we introduced a three-roll mill (TR 35 W, Yeong-Shin, Taiwan) to mix the composites, which could apply a large shear force on the hybrid.39 The gap between two parallel rollers was adjusted to 50 μm. The rotation speed was fixed at 150 rotations per minute. A mixture of MWCNTs, MnO2, and epoxy was fed into the machine for twenty times.At the same time, the CF cloth was cut into rectangular shapes with size of 10 × 9 cm2, and ultrasonic in acetone for 1 h. After the CF cloth was rinsed with deionized water and absolute ethanol several times and dried at 60 °C for 24 h, the clean CF cloth was cut into several pieces with an area of 3 × 2 cm2 each for the subsequent composite preparation.
Then, a mixture of MWCNTs, MnO2 and epoxy was poured into a mold where the CF cloth and a release paper were pre-placed. The sample was cured under a pressure of 2000 kg m−3 at 70 °C for 0.5 h followed by a post curing under 120 °C for 1 h.
The sample indexes are described in Table 1. In the table, X and Y represent weight ratios of MWCNTs and MnO2, respectively, whereas N represent the number of absorption layers. For example, a layered composite named as 1/10 has one layer of MWCNTs/MnO2/EP composite composed of 1 wt% MWCNTs and 10 wt% MnO2 in the epoxy matrix. The sample of 1/10 × 2 + CF means two layers of MWCNTs/MnO2/EP composites with 1 wt% MWCNTs and 10 wt% MnO2 in the epoxy matrix on a CF cloth.
| Sample name | Contents (wt%) | Structure |
|---|---|---|
| X/Y | X% MWCNTs + Y% MnO2 | One layer of composites |
| X/Y × N | X% MWCNTs + Y% MnO2 | N layers of composites |
| X/Y × N + CF | X% MWCNTs + Y% MnO2 | N layers of composites + CF cloth |
2.4 Characterization
The samples were characterized by using a field emission scanning electron microscope (FESEM, Hitachi SU-8010), Raman spectroscopy (Ram HR800, 632.8 nm), X-ray diffraction (XRD, Bruker D2 Phase, Cu-Kα radiation, λ = 1.5406 Å). Sheet resistivity was measured by a four-probe electric measuring instrument (CT5601Y, Chitai Electronic Corporation) connected with a semiconductor characterization system of Keithley 4200-SCS.2.5 EM measurements
The scattering parameters (S11 and S21) of each sample were measured by vector network analyzer (VNA, Alight Technologies, E8364A, PNA series Network Analyzer) using waveguide sample holder in X-band frequency range (8.2–12.4 GHz) at room temperature. The VNA setup was calibrated carefully before each measurement. Layered composite samples were prepared with dimensions of 2.5 × 1.5 cm2, so as to accommodate the X-band waveguide holder. The samples with different weight ratios and thicknesses were placed in the specimen holder. The scattering parameters of each sample were recorded and transferred into SET (total shielding effectiveness) and SER (reflection shielding effectiveness) automatically by the software.3. Results and discussion
3.1 Structure and morphology
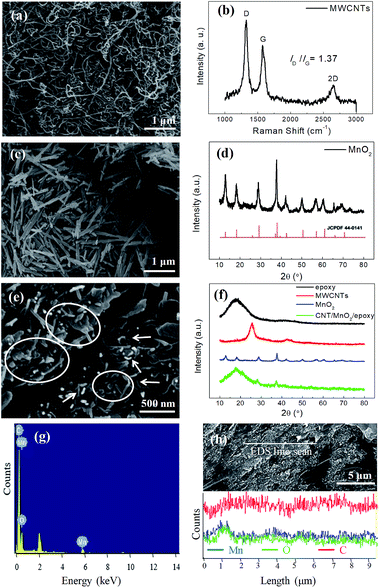
Fig. 2a shows a SEM image of the MWCNTs which are entangled together. The MWCNTs are highly pure as nearly no impurity are observed during SEM examination. Fig. 2b depicts a Raman spectrum of the MWCNTs. The intensity ratio of D-band to G-band (ID/IG) is 1.37, implying lots of defects in the MWCNTs. Straight MnO2 nanorods synthesized from the oil-bathing hydrothermal method have smooth surfaces (see Fig. 2c), which are similar to those in Guan's report.31 Fig. 2d shows a XRD curve of the MnO2 nanorods. The XRD curve is consistent with that of the α-MnO2 (JCPDS 44-0141), which implies that our samples are mainly α-MnO2 nanorods. We believe that the growth of the α-MnO2 nanorods follow the mechanism proposed by Guan et al.31 In brief, the α-MnO2 nanorods grow through a redox reaction between Mn2+ and MnO4− in 1D growth habit.Fig. 2e shows a SEM image of fracture surface of the MWCNTs/MnO2/EP composite. The MnO2 nanorods, marked by ovals, show a relative rigidity; whereas the MWCNTs with curled configuration are indicated by arrows. The fracture surface of the epoxy matrix, having a typical smooth surface, is also detected in the SEM image. By applying high shear stress via a three-roll mill, the entangled MWCNTs and straight MnO2 nanorods disperse uniformly in the epoxy matrix.
Fig. 2f shows XRD curves of the MWCNT/MnO2/EP composites and their constituent phases. There is a broad XRD peak centred at 18° in the XRD curve of the epoxy matrix (black), corresponding to the amorphous state of epoxy.40 The XRD peaks at 25.6° and 42.9° are associated with the graphitic structure of (002) and (100) plane diffraction (JCPDS 01-0646) in the MWCNT sample (red), respectively. All the diffraction peaks in the as-prepared MnO2 can be easily indexed to tetragonal α-MnO2 phase (JCPDS 44-0141), which is generally regarded as the most suitable type among the various crystalline states of MnO2 for EMI shielding.30 In addition, there is no other diffraction peaks from impurity, which suggests the high purity of our samples. Fig. 2f also shows an XRD curve of the MWCNTs/MnO2/EP composites with 1 wt% MWCNTs and 10 wt% MnO2 (green). Besides epoxy, there are only some weak XRD peaks of MnO2 in the XRD curve owing to the low concentration. However, FESEM images and EDS elemental analysis verify the existence of MWCNTs and MnO2 in the composites.
Elemental analysis of MWCNTs/MnO2/EP composites is performed over the sample surface to visualize the atomic elements of C, Mn and O. Three elements in the absorption layer can be detected according to the EDS elemental analysis results (Fig. 2g). It is obvious that carbon (C) comes from epoxy and MWCNTs, manganese (Mn) from MnO2 and oxygen (O) from epoxy and MnO2. Fig. 2h indicates a nearly homogeneous elemental distribution of C and Mn across one randomly selected scanning line on the absorption layer. MWCNTs are uniformly dispersed and embedded among dielectric MnO2 throughout the epoxy matrix. The homogeneous network increases the conductivity of the absorption layer and leads to more conductive loss and inside multi-reflection.
Morphologies of the CF cloth are shown in Fig. S1a and b.† The digital photo shows criss-cross CF bundles shining with metallic luster. It can be seen from the SEM image that the CF bundles have smooth surface and dimeter of ∼7.5 μm. As shown in Fig. S1c,† there are two prominent Raman peaks at 1350 and 1580 cm−1 in the Raman spectrum of CF, corresponding to G-band and D-band of CF, respectively. The intensity ratio of D-band to G-band (ID/IG) is 1.10, showing high crystallinity of the CF.41 Fig. S1d† shows the XRD pattern of the CF cloth. There is a strong XRD peak centred at 24.9°, corresponding to the graphitic structure of (002) plane. A weak peak appears at 43.2°, which relates to the (100) plane of graphite structure.
3.2 Electrical properties
By adding MWNCTs to the composites, the sheet resistivity decreases significantly from 107 to 103 Ω sq−1 (Fig. 3a), which is ascribed to homogeneous dispersion of the high conductive MWCNTs. They establish a conducting network in the MWCNTs/MnO2/EP composites. As shown in Fig. 3b, the sheet resistivity is slightly reduced with the increasing amount of MnO2 in the composites, although MnO2 is an electric insulator. The presence of MnO2 in the composite helps for MWCNT dispersion. As a result, it generates better electric network and improves the electric conductivity.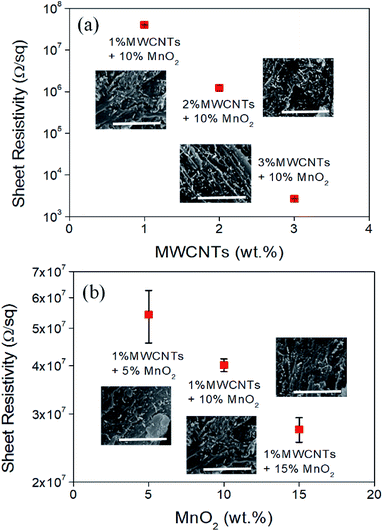 | ||
| Fig. 3 Sheet resistivity of the MWCNTs/MnO2/EP composites with (a) different MWCNTs concentrations and (b) different MnO2 concentrations. All inset scale bars are 2.5 μm. | ||
In addition, the SEM images depicted in Fig. 3a and b indicate uniform dispersion of MWCNTs (white spots) in the composites. Higher MWCNTs concentration with uniform dispersion creates an intensive electric network which effectively reduces the sheet resistivity. Based on the above results, it is concluded that the concentration of MWCNTs in the composites dominates the electrical conductivity of the composites.
3.3 Microwave absorption properties
According to transmission line theory, experimental shielding performance can be estimated as
 | (2) |
 | (3) |
 | (4) |
 | (5) |
 | (6) |
 | (7) |
According to the eqn (3)–(7), it is obvious that electrical conductivity is a critical factor for SER loss. High conductivity always brings low SER loss, that is to say, reflects more EM waves from the surface of the shielding materials because of impedance mismatch which can be quantified by the ratio of free space impedance (Z0, approximately equals to 377 Ω) to input impedance (Zin). The higher the ratio, the more the reflection will be. Higher conductive materials have lower input impedance, which result in higher impedance mismatch and subsequently more reflection of the impinging EM waves. On the contrary, materials with higher input impedance allow more EM waves to penetrate through the surface, which is beneficial to the absorption.45
The absorbed EM waves convert to heat and subsequently dissipate to environment. Apparently, SEA can be influenced by electrical conductivity, magnetic permeability, dielectric permittivity, as well as operating frequency and the thickness of the absorber.46 In order to increase the SER loss and reduce the reflection of the impinging EM wave, it is suggested that using a conductive material with proper conductivity is a good strategy for the objective.
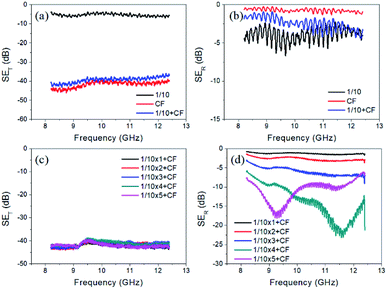
Fig. 4a and b illustrate SET and SER of the single layer composite. It shows that the 1/10 sample (1 wt% MWCNTs) possesses the lowest SET but has the highest SER among three samples of 1/10, 2/10 and 3/10. It implies that EM waves can transmit through the sample with low MWCNT concentration more easily than that with high MWCNT concentration. And, the sample with lower MWCNT concentration can reflect less EM waves. A similar study is performed on the samples containing different contents of MnO2. Surprisingly, the SET and SER of the samples with the MnO2 concentration of 1/5, 1/10, and 1/15 possess nearly similar transmission loss and reflection loss, as shown in Fig. 4c and d.
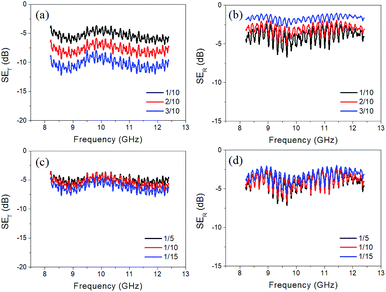 | ||
| Fig. 4 Illustration of (a) SET and (b) SER of the single layer composite with different MWCNT concentrations and (c) SET and (d) SER of the composites with different α-MnO2 concentrations. | ||
Fig. 5a and b separately show SET and SER of the 1/10, CF, and 1/10 + CF samples. As expected, the sample of 1/10 possesses the lowest SET, while the other two samples, CF and 1/10 + CF, have similar high SET (see Fig. 5a). However, as depicted in Fig. 5b, the CF has the lowest SER, and 1/10 + CF sample possesses higher SER than the CF. It is explained that when the EM waves impinge 1/10 absorption layer, some of them transmit through the layer and reflect by the CF, and then absorb again by the absorption layer. The double absorption results in the higher SER of the 1/10 + CF sample than that of the CF. Based on the results of SET and SER for the building blocks of the composites, and to make the utmost use of the advantages of conductive carbonaceous materials and dielectric MnO2, we select CF cloth as the reflection layer and MWCNTs/MnO2/EP composites with 1 wt% MWCNTs and 10 wt% MnO2 in the epoxy matrix as the absorption layer. The plots of SET and SER versus frequency for the multi-layered composites having five different layer numbers and CF reflection layer are shown in Fig. 5c and d.
When we increase the thickness of the layered composites to an extent, as shown in Fig. 5c, the total shielding effectiveness with different layer numbers are similar and with an average value as high as 41 dB. It means that less than 0.01% of incident EM waves can transmit the designed shielding materials. In other words, the multi-layered composites could completely satisfy commercial requirements on EMI shielding. In this work, we find that SER loss is very sensitive to the thickness of the absorbing material. When we use only one absorption layer (0.5 mm) or two absorption layers (1.0 mm), SER is lower than 5 dB, as shown in Fig. 5d. It implies that EM waves can penetrate through the thin absorption layer easily, and subsequently almost all of them will be reflected back by the highly-conductive CF cloth. The higher SER loss, the lower amount of EM waves can be reflected from the surface. When the layer number further increases, one can see that reflection loss becomes higher, which implies more EM waves are absorbed according to the eqn (2). At four layers of absorption composites (2.0 mm), the absorption peak is located at 11.6 GHz with a SER loss of 23.22 dB, and the effective absorption bandwidth (SER loss higher than 10 dB) reaches 2.9 GHz (from 9.5 to 12.4 GHz) at the test frequency range. If the layer number further increases to five (2.5 mm), the sample has a less absorption peak of 18.12 dB at 9.2 GHz, and its effective absorption bandwidth decreases to 1.5 GHz (from 8.6 to 10.1 GHz). Table 2 shows comparison of SE values of the multi-layered composite with the MnO2-based EMI shielding materials in literature. It shows that the present work is clearly comparable in terms of thickness and the SE values. Our layered composites show high SE value with relative low loading of MnO2.
| Materials | MnO2 loading | Frequency (GHz) | Thickness (mm) | SE (dB) | Ref. |
|---|---|---|---|---|---|
| MnO2 nanowires/wax | 25 wt% | 2–12 | 4 | 21.7 | 30 |
| CNTs/MnO2 nanotubes/PVDF | 5 wt% | 8–12 | 1 | 22 | 49 |
| MnO2 nanorods/wax | 25 wt% | 2–18 | 3 | 25 | 31 |
| MnO2/graphene nanoribbons | 86 wt% | 12.4–18 | 3 | 57 | 32 |
| MnO2 nanorods | 100 wt% | 8.2–12.4 | 2.18 | 20+ | 50 |
| MnO2 microspheres/wax | 50 wt% | 8–18 | 4 | 40 | 33 |
| MnO2 nanorods/PANI film | 20 wt% | 8.2–18 | 0.169 | 39 | 34 |
| CS@MnO2/wax | 12.35 wt% | 8–18 | 2 | 23 | 51 |
| MnO2 nanorods/PVB | 5 wt% | 8.2–18 | 2 | 37 | 35 |
| MnO2/epoxy + CB/epoxy | 10 wt% | 8–18 | 4.5 | 29 | 52 |
| MWCNTs/MnO2/epoxy + CF cloth | 10 wt% | 8.2–12.4 | 2.85 | 41 | This work |
The absorption peak (the same position as the reflection peak) shifts to a lower frequency band when the layer number increases from four to five, as shown in Fig. 5d. It could be explained using the quarter wavelength cancellation model. When the thickness of the absorber equals to odd-numbered multiple of the quarter incident wavelength, the reflected and incident waves will interfere each other in composites, and cancel out at the air/composite interface and inside the shielding materials.33,35 This phenomenon results from the resonant absorption in low permittivity materials and is attributed to the decrease of the matching frequency along with the increasing thickness.31
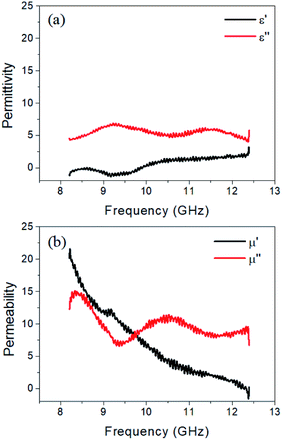
As mentioned above, high electric conductivity plays a negative effect on EM wave absorption because of the impedance mismatch. Dielectric loss originates from electronic polarization, ionic polarization, dipole orientation polarization, interfacial polarization and associated relaxation phenomena. The former two polarizations usually take place in the ultraviolet or infrared frequency range, thus can be negligible in X-band frequency.36,37 Magnetic loss stems from the resonance phenomenon. Apart from conductivity, complex permittivity (ε, ε = ε′ − iε′′) and permeability (μ, μ = μ′ − iμ′′) of the (1/10 × 4 + CF) sample can be calculated using the NRW conversion method.47,48 As shown in Fig. 6, the complex permittivity and permeability are frequency-dependent. The real part ε′ (and μ′) is associated with the ability to store energy in electric (and magnetic) field, while the imaginary part ε′′ and μ′′ corresponds to the loss of energy within the material resulting from conduction, resonance, and relaxation mechanisms.31 It can be seen from Fig. 6a that real part of the permittivity of the (1/10 × 4 + CF) sample has an average value of about 0.6, while its imaginary part has a value of about 5.5 with a small fluctuation in the whole X-band frequency. MnO2 is a dielectric material with very poor conductivity. The low value of the real part of the permittivity implies better impedance matching in the composites. Cyclic polarization and vibration of the electric and magnetic dipoles results in microwave absorption. The MnO2 nanorods has larger specific surface, which contribute to interfacial polarization and scattering of the incident EM waves. In Fig. 6b, a sharp decline for real part of permeability from 21.6 at 8.2 GHz to almost zero in high frequency can be detected. At the same time, severe fluctuations occurs in the imaginary part of permeability. α-MnO2 is an antiferromagnetic material. Therefore, the magnetic response may be ascribed to the ferromagnetic coupling of MnO2 and MWCNTs, which refers to the interactions between electrons and Mn ions in the conductive network. Even so, magnetic loss tangent (tan![[thin space (1/6-em)]](https://www.rsc.org/images/entities/char_2009.gif) δm = μ′′/μ′) of the composites is still very low. In other words, dielectric loss is the main contributing factor of EMI shielding in our designed structure.
δm = μ′′/μ′) of the composites is still very low. In other words, dielectric loss is the main contributing factor of EMI shielding in our designed structure.
In order to investigate the mechanism of multi-layered structure, we calculate the transmission coefficient (T), reflection coefficient (R), and absorption coefficient (A) from SET and SER using the following equations:34
| T + R + A = 1 | (8) |
SET = 10![[thin space (1/6-em)]](https://www.rsc.org/images/entities/char_2009.gif) log log![[thin space (1/6-em)]](https://www.rsc.org/images/entities/char_2009.gif) T = 20 T = 20![[thin space (1/6-em)]](https://www.rsc.org/images/entities/char_2009.gif) log|S21| log|S21|
| (9) |
SER = 10![[thin space (1/6-em)]](https://www.rsc.org/images/entities/char_2009.gif) log(1 − R) = 10 log(1 − R) = 10![[thin space (1/6-em)]](https://www.rsc.org/images/entities/char_2009.gif) log(1 − |S11|2) log(1 − |S11|2)
| (10) |
Fig. 7a–c show the calculation results of transmission, reflection, and absorption coefficients of the composites with different layer numbers. As the number of absorption layer increases from one to four, the reflection coefficient increases from 0.26 to 0.93. On the contrary, the absorption coefficient decreases from 0.74 to 0.07. These results show that the mechanism of our layered composites is changing from reflection-controlled shielding to absorption-dominant attenuation. However, when the layer number increases to five, there is a slight decrease in the reflection coefficient from 0.93 to 0.90 and a small increase in the absorption coefficient from 0.07 to 0.10. Additionally, the peaks also shift to lower frequency. These results are consistent with SER loss in Fig. 5d.
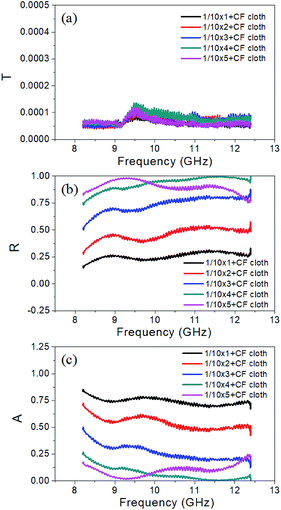 | ||
| Fig. 7 (a) Transmission coefficient, (b) reflection coefficient and (c) absorption coefficient of the multi-layered composites with different absorption layer numbers. | ||
It is well recognized that thicker materials have better shielding effectiveness, but it seems inappropriate for the multi-layered composites. The layered-structure composites show better shielding performance than a single layer. The factors that determine absorption in a single layer are conductivity, complex permittivity and permeability, skin depth of the materials, and operating frequency. Nevertheless, it is necessary to take into account the impedance matching between different layers and geometric design of each layer in the analysis of the absorption mechanism in multi-layered materials. According to the size effect, thinning of materials contributes to the absorption in high frequency range and vice versa. For highly-efficient absorption, the absorbers with maximum bandwidth are needed by employing applicable and suitable thickness. Impedance matching is another important factor that must be taken into consideration and the sequence of multiple layers needs to be arranged properly.
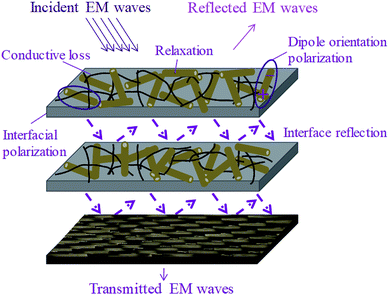
Fig. 8 shows possible EMI shielding mechanism in our multi-layered hybrid structure. Low content of MWCNTs in the epoxy matrix acts as an absorption layer with moderate conductive paths and forms a highly-efficient conductive network for facilitating the dissipation of EM energy. The incorporation of α-MnO2 nanorods not only improves the dispersion of MWCNTs, but also increases the impedance matching so as to reduce the reflection of EM waves. In addition, uniform dispersion of high-aspect-ratio MWCNTs can contribute long pathway for carrier transport to form electric dipole, which consume the energy and subsequently enhance the EM wave absorption. Meanwhile, MnO2 induced dielectric attenuation plays a leading role in the absorption layer. With arranging the conductive CF cloth at the rear of the layered composites, minimum transmission of the EM waves can be attained because of a strong reflection shield. Owing to the integration of chemical composition and unique structure, we make the utmost use of synergistic effect in designing the multi-layered composites and achieve low-cost, easy-fabricated and high-efficiency absorption-dominant EMI shielding materials.
4. Conclusions
In summary, homogeneous distribution of α-MnO2 nanorods and MWCNTs in the epoxy matrix endows the MWCNTs/MnO2/EP composites with optimized conductivity accompanying excellent microwave absorption ability. Multi-layered structure of the EMI shielding materials, using the MWCNTs/MnO2/EP composites as absorption layer and CF cloth as reflection layer, are fabricated. With four absorption layers, a total EMI shielding effectiveness of 41.24 dB with reflection loss of 23.22 dB is achieved at 11.57 GHz, indicating that nearly 99.52% of the EM waves are absorbed by the designed attenuator. The multi-layered composites utilize the synergistic effects of conductive MWCNTs and dielectric MnO2, and create multiple impedance mismatching. Thus, the multi-layered composites make the utmost of multi-reflection between each layer, and are promising microwave absorption materials in X-band.Conflicts of interest
There are no conflicts to declare.Acknowledgements
The authors are thankful for the funding support from the Ministry of Science and Technology, Taiwan under the contract MOST 107-2221-E-007-008-MY3.References
- S. Geetha, K. K. S. Kumar, C. R. K. Rao, M. Vijayan and D. C. Trivedi, J. Appl. Polym. Sci., 2010, 112, 2073 CrossRef.
- D. D. L. Chung, J. Mater. Eng. Perform., 2000, 9, 350 CrossRef CAS.
- D. D. L. Chung, Carbon, 2001, 39, 279 CrossRef CAS.
- Y. Okazaki and K. Ueno, J. Magn. Magn. Mater., 1992, 112, 192 CrossRef CAS.
- C. H. Peng, H. W. Wang, S. W. Kan, M. Z. Shen, Y. M. Wei and S. Y. Chen, J. Magn. Magn. Mater., 2004, 284, 113 CrossRef CAS.
- H. J. Oh, V. D. Dao and H. S. Choi, Appl. Surf. Sci., 2018, 435, 7 CrossRef CAS.
- S. Biswas, G. P. Kar and S. Bose, J. Mater. Chem. A, 2015, 3, 12413 RSC.
- Y. Chen, Y. Li, M. Yip and N. Tai, Compos. Sci. Technol., 2013, 80, 80 CrossRef CAS.
- A. Ameli, P. U. Jung and C. B. Park, Carbon, 2013, 60, 379 CrossRef CAS.
- J. Wu, J. Chen, Y. Zhao, W. Liu and W. Zhang, Composites, Part B, 2016, 105, 167 CrossRef CAS.
- S. Kumar, G. Datt, A. S. Kumar and A. C. Abhyankar, J. Appl. Phys., 2016, 120, 8563 Search PubMed.
- C. H. Phan, M. Mariatti and Y. H. Koh, J. Magn. Magn. Mater., 2016, 401, 472 CrossRef CAS.
- J. Liang, Y. Wang, Y. Huang, Y. F. Ma, Z. F. Liu, J. M. Cai, C. D. Zhang, H. J. Gao and Y. S. Chen, Carbon, 2009, 47, 922 CrossRef CAS.
- C. S. Chen, W. R. Chen, S. C. Chen and R. D. Chien, Int. Commun. Heat Mass Transfer, 2008, 35, 744 CrossRef CAS.
- K. Zhang, H. O. Yu, K. X. Yu, Y. Gao, M. Wang, J. Li and S. Y. Guo, Compos. Sci. Technol., 2018, 156, 136 CrossRef CAS.
- S. T. Tan, M. Q. Zhang, M. Z. Rong and H. M. Zeng, Polym. Compos., 1999, 20, 406 CrossRef CAS.
- J. Li, P. C. Ma, W. S. Chow, C. K. To, B. Z. Tang and J. K. Kim, Adv. Funct. Mater., 2007, 17, 3207 CrossRef CAS.
- J. Hone, M. C. Llaguno, M. J. Biercuk, A. T. Johnson, B. Batlogg, Z. Benes and J. E. Fischer, Appl. Phys. A: Mater. Sci. Process., 2002, 74, 339 CrossRef CAS.
- R. H. Baughman, A. A. Zakhidov and W. A. de Heer, Science, 2002, 297, 787 CrossRef CAS PubMed.
- Y. Li, C. Chen, S. Zhang, Y. Ni and J. Huang, Appl. Surf. Sci., 2008, 254, 5766 CrossRef CAS.
- G. P. Kar, S. Biswas, R. Rohini and S. Bose, J. Mater. Chem. A, 2015, 3, 7974 RSC.
- A. Nazir, H. Yu, L. Wang, M. Haroon, R. S. Ullah, S. Fahad, K. R. Naveed, T. Elshaarani, A. Khan and M. Usman, J. Mater. Sci., 2018, 53, 1 CrossRef.
- B. Wen, M. Cao, M. Lu, W. Q. Cao, H. L. Shi, J. Liu, X. X. Wang, H. B. Jin, X. Y. Fang, W. Z. Wang and J. Yuan, Adv. Mater., 2014, 26, 3484 CrossRef CAS PubMed.
- G. Wang, Z. Gao, S. Tang, C. Q. Chen, F. F. Duan, S. C. Zhao, S. W. Lin, Y. H. Feng, L. Zhou and Y. Qin, ACS Nano, 2012, 6, 11009 CrossRef CAS PubMed.
- R. C. Che, L. Peng, X. F. Duan, Q. Chen and X. L. Liang, Adv. Mater., 2004, 16, 401 CrossRef CAS.
- S. Gupta, C. Chang, C. H. Lai and N. H. Tai, Composites, Part B, 2019, 164, 447 CrossRef CAS.
- M. S. S. Dorraji, M. H. Rasoulifard, M. H. Khodabandeloo, M. Rastgouy-Houjaghan and H. K. Zarajabad, Appl. Surf. Sci., 2016, 366, 210 CrossRef CAS.
- W. Feng, Y. Wang, J. Chen, L. Wang, L. Guo, J. Ouyang, D. C. Jia and Y. Zhou, Carbon, 2016, 108, 52 CrossRef CAS.
- Q. Liu, Q. Cao, H. Bi, C. Liang, K. Yuan, W. She, Y. J. Yang and R. C. Che, Adv. Mater., 2016, 28, 486 CrossRef CAS PubMed.
- H. Guan, C. Gang, S. Zhang and Y. Wang, Mater. Chem. Phys., 2010, 124, 639 CrossRef CAS.
- H. Guan, J. Xie J, G. Chen and Y. Wang, Mater. Chem. Phys., 2014, 143, 1061 CrossRef CAS.
- T. K. Gupta, B. P. Singh, V. N. Singh, S. Teotia, A. P. Singh, I. Elizabeth, S. R. Dhakate, S. K. Dhawanc and R. B. Mathur, J. Mater. Chem. A, 2014, 2, 4256 RSC.
- Y. Wang, B. Han, N. Chen, D. Deng, H. Guan and Y. Wang, J. Alloys Compd., 2016, 676, 224 CrossRef CAS.
- P. J. Bora, K. J. Vinoy, P. C. Ramamurthy and G. Madras, Mater. Res. Express, 2017, 4, 025013 CrossRef.
- P. J. Bora, I. Azeem, K. J. Vinoy, P. C. Ramamurthy and G. Madras, Composites, Part B, 2018, 132, 188 CrossRef CAS.
- M. Y. Li, S. Gupta, C. Chang and N. H. Tai, Composites, Part B, 2019, 161, 617 CrossRef CAS.
- S. Biswas, I. Arief, S. S. Panja and S. Bose, ACS Appl. Mater. Interfaces, 2017, 9, 3030 CrossRef CAS PubMed.
- H. Zhao, L. Hou, S. Bi and Y. Lu, ACS Appl. Mater. Interfaces, 2017, 9, 33059 CrossRef CAS PubMed.
- E. T. Thostenson and T. W. Chou, Carbon, 2006, 44, 3022 CrossRef CAS.
- M. J. Cui, S. M. Ren, G. A. Zhang, S. Liu, H. C. Zhao, L. P. Wang and Q. J. Xue, J. Chin. Soc. Corros. Prot., 2016, 36, 566 Search PubMed.
- J. Q. Wei, B. Jiang, X. Zhang, H. W. Zhu and D. H. Wu, Chem. Phys. Lett., 2003, 376, 753 CrossRef CAS.
- T. Gupta, B. Singh, S. Dhakate, V. Singh and R. Mathur, J. Mater. Chem. A, 2013, 1, 9138 RSC.
- H. W. Ott, Electromagnetic Compatibility Engineering, John Wiley and Sons, 2009 Search PubMed.
- A. M. Nicolson and G. F. Ross, IEEE Trans. Instrum. Meas., 1970, 19, 377 Search PubMed.
- W. L. Song, M. S. Cao, M. M. Lu, S. Bi, C. Y. Wang, J. Liu, J. Yuan and L. Z. Fan, Carbon, 2014, 66, 67 CrossRef CAS.
- M. H. Al-Saleh and U. Sundararaj, Carbon, 2009, 47, 1738 CrossRef CAS.
- D. R. Smith, D. C. Vier, T. Koschny and C. M Soukoulis, Phys. Rev. E: Stat., Nonlinear, Soft Matter Phys., 2005, 71, 036617 CrossRef CAS PubMed.
- A. H. Boughriet, C. Legrand and A. Chapoton, IEEE Trans. Microwave Theory Tech., 1997, 45, 52 CrossRef.
- V. Eswaraiah, V. Sankaranarayanan and S. Ramaprabhu, Nanoscale Res. Lett., 2011, 6, 137 CrossRef PubMed.
- W. L. Song, M. S. Cao, Z. L. Hou, M. M. Lu, C. Y. Wang, J. Yuan and L. Z. Fan, Appl. Phys. A, 2014, 116, 1779 CrossRef CAS.
- H. Wang, Z. Zhang, C. Dong, G. Chen, Y. Wang and H. Guan, Sci. Rep., 2017, 7, 15841 CrossRef PubMed.
- Y. Duan, Y. Yang, M. He, S. Liu, X. D. Cui and H. Chen, J. Phys. D: Appl. Phys., 2008, 41, 125403 CrossRef.
Footnote |
| † Electronic supplementary information (ESI) available. See DOI: 10.1039/c9ra02819f |
| This journal is © The Royal Society of Chemistry 2019 |

