
 Open Access Article
 This Open Access Article is licensed under a Creative Commons Attribution-Non Commercial 3.0 Unported Licence
A label-free immunosensor based on PHEMA/graphene oxide nanocomposite for simultaneous electrochemical determination of alpha fetoprotein†
Ying Liang,
Xiaoqing Zhao,
Na Wang,
Jing Wang,
Hou Chen *,
Liangjiu Bai* and
Wenxiang Wang
*,
Liangjiu Bai* and
Wenxiang Wang
School of Chemistry and Materials Science, Key Laboratory of High Performance and Functional Polymer in the Universities of Shandong Province, Collaborative Innovation Center of Shandong Province for High Performance Fibers and Their Composites, Ludong University, Yantai 264025, China. E-mail: chenhou@ldu.edu.cn; bailiangjiu@ldu.edu.cn; Fax: +86-535-6669070; Fax: +86-535-6697933
First published on 3rd June 2019
Abstract
An electrochemical immunosensor based on poly(2-hydroxyethyl methacrylate) (PHEMA)/graphene oxide (GO) nanocomposite was designed in a simple way for the ultrasensitive detection of tumor makers (alpha-fetoprotein, AFP as a model). PHEMA with excellent biocompatibility, provides a large number of sites for connecting signal molecules. After modification with signal molecules, the functional PHEMA significantly improved the sensitivity of electrochemical detection. In order to immobilize antibodies, GO was introduced and used to construct a nanocomposite as a substrate. The designed AFP immunosensor showed favorable selectivity and excellent stability. Meanwhile, it has a low detection limit of 0.403 pg mL−1. Furthermore, the immunosensor was used to detect target AFP in human serum, demonstrating the feasibility of clinical diagnosis.
Introduction
For cancer diagnosis, highly sensitive and reliable detection of tumor markers is extremely important.1–3 For the early diagnosis of the patients with hepatocellular carcinoma, alpha-fetoprotein (AFP) is a specific tumor marker.4–6 Recently, different methods for AFP detection have been implemented, such as enzyme immunoassay, high-throughput analysis technology and nanobody medicated immunoassay. However, these methods have some obvious disadvantages, including being time-consuming, expensive and relatively complex.5–8 Taking into account its high sensitivity, wide linear range, low cost, rapid detection and excellent selectivity, the electrochemical immunosensor has attracted more and more attention in the field of immunoassays.9–11 Improving the sensitivity of the electrochemical detection is still a great challenge. A series of electrochemical immunosensors, such as nano-PEDOT-GA,12 AuNPs/PB-PEDOT,13 N-GS-AuNPs-Chit,14 Pß-CD,15 AuNPs/GO-MWCNTS16 as signal amplification platforms, were developed for the detection of tumor markers, which showed high sensitivity and low detection limits. It has been reported that the sensitivity of the detection can be improved through increasing the amount of antibody in the early research.17 In recent years, it is attractive to develop nanomaterials as platform for constructing electrochemical immunosensors. Fang et al. developed an electrochemical immunoassay for the detection of procalcitonin (PCT) using functionalized Au/mesoporous silica nanoparticles as signal amplifying probe to localize HRP-anti-PCT, which obtained a wide detection range from 0.01 to 350 ng mL−1.18 Wang et al. designed a gold nanoparticles composite nanoprobe for the facile detection of carcino-embryonic antigen (CEA) with a low detection limit (∼2.4 pg mL−1).19It is worth mentioning that some polymer/nanomaterial composites were also used in electrochemical immunosensors. Cui et al. applied PEG to electrochemical detection of AFP, which greatly improved the sensitivity of detection. They modified PEG on the electrode surface and then introduced gold nanoparticles (AuNPs) to the PEG surface, aims to improve the sensitivity by further immobilizing antibodies.20 Hu et al. designed a polydopamine-functionalized graphene oxide composite (PDA-rGO) for sensitive detection of biomarker. The composite was synthesized by oxidative polymerization of dopamine in the presence of GO.21 In these reports, many biocompatible polymers were chosen and widely used to load antigens and antibodies, due to their excellent biocompatibility and easy for modification. But these methods do not adequately apply polymers to signal amplification. So it is desirable to design a functional polymer, which can effectively amplify the signal and improve the sensitivity of the electrochemical immunosensors.
Poly(2-hydroxyethyl methacrylate) (PHEMA), one of the most exclusively studied polymer in biomedical applications with distinctive biocompatibility and physical properties similar to living tissues.22,23 It is a major component in materials for biotechnological and biomedical applications to immobilize proteins or cells.24–26 And its excellent biocompatibility makes it suitable for the preparation of electrochemical immunosensors. And on the surface of PHEMA, there are plentiful hydroxyl functional groups that can be used to connect with signal molecules. After modified by signal molecules, the functional PHEMA will significantly amplify the signal of electrochemical detection. In order to further immobilize antibodies and improve the sensitivity, the graphene oxide (GO) can be introduced and used to construct the PHEMA/GO nanocomposite due to its large surface area, unique two-dimensional structure, synergic effect among conductivity and biocompatibility.27,28 Li et al. reported an enzyme-linked immunosorbent based on allochroic molecule modified carboxyl graphene oxide, which successfully achieved the simultaneous colorimetric detection of diagnostic biomarkers.29 As typical methods of controlled radical polymerization, versatile RAFT polymerization have advantage of favorable operation,30 functional monomers31 and well-defined controllability.32
In this work, reversible addition-fragmentation chain transfer (RAFT) polymerization was used to prepared PHEMA with controllable molecular weight and carboxyl end groups. And as the signal molecules, the anthraquinone-2-carboxylic acid was used to modify PHEMA through their unique interaction with the wealth of hydroxyl groups. A large amount of anthraquinone-2-carboxylic acid was linked to PHEMA, giving the functional PHEMA a strong electrochemical signal amplification capability. And the carboxyl end groups of functional PHEMA were used to interact with GO, then the nanocomposite with ability of multiple signal amplification was constructed. The nanocomposite was used to form a sandwich-type electrochemical immunosensor, which could be used for the detection of AFP. The immunosensor showed a low detection limit of 0.403 pg mL−1. Moreover, the immunosensor was used to detect target AFP in human serum sample. The study provides a reliable method to ultrasensitive detection of tumor makers.
Experimental section
Materials
2-Hydroxyethyl methacrylate (HEMA, ≥99%, J&K Scientific Ltd.) was passed through a column of Al2O3 to remove the inhibitor and stored at 4 °C. Azobis-isobutyronitrile (AIBN) was recrystallized in ethanol. 4-Cyanopentanoicacid dithiobenzoate (CPADB) was synthesized by the method which was reported in the literature.33 Diethylenetriamine (DETA), dicyclohexylcarbodiimide (DCC), 4-dimethylaminopyridine (DMAP) was purchased from Tianjin Fuyu Fine Chemical Company. Anthraquinone-2-carboxylic acid (≥99.5%) was obtained from Zhengzhou Alfachem. Tetrahydrofuran (THF, ≥99.5%), N,N-dimethylformamide (DMF, ≥99.5%), dimethylsulfoxide (DMSO, ≥99.5%) was brought from Tianjin Chemical Reagents. Bovine serum albumin (BSA) was purchased from Sigma-Aldrich. 1-Ethyl-3-(3-dimethylaminopropyl) carbodiimide hydrochloride and N-hydroxysuccinimide (EDC and NHS, ≥99.5%, Shanghai Yuanye Biological Technology Company, China). AFP, primary antibodies (Ab1) and secondary antibodies (Ab2) were all purchased from Fitzgerald (Acton, MA, USA). The human serum samples were provided from by the Yuhuangding Hospital Affiliated to Qingdao University. EDC/NHS, AFP, primary antibodies (Ab1) and secondary antibodies (Ab2) were all dissolved in phosphate buffered solution (10 mM, pH = 7.4). And the solutions were all prepared by ultra-pure water (18 MΩ cm).Preparation of functional PHEMA
The PHEMA was synthesized by RAFT polymerization. In a 6 mL-ampoule, CPADB (23.0 mg, 0.0825 mmol) as RAFT agent, AIBN (6.77 mg, 0.0413 mmol) as initiator and HEMA (1.5 mL, 22.9 mmol) as monomer were all dissolved with DMF (2 mL, solvent/monomer volume ratio = 1). Then the ampoule was placed into ice-water bath to be purged with dry nitrogen for 10 min for the thorough elimination of oxygen and water. Soon afterwards, the sealing of the ampoule was carried out via flame. The reaction was carried out at 60 °C for 8 h with magnetic stirring. Then the ampoule with the product was cooled to room temperature, thereafter be broken open. The product was purified with the addition of 3 mL of THF![[thin space (1/6-em)]](https://www.rsc.org/images/entities/char_2009.gif) :methanol (1:1) mixture. Then, the solution was poured into 10 mL distilled water and moved into a dialysis tube. The solution was dialyzed for 48 h. And then, the product was obtained by freeze-drying. About 0.1 g of PHEMA powder, 0.01 g of anthraquinone-2-carboxylic acid, 0.075 g of DCC, 0.001 g of DMAP and 4 mL of THF were added to a 5.0 mL ampule. The mixture was reacted at 25 °C for 24 h with magnetic stirring. After the reaction, the mixture was purified by dialysis for 48 h. And finally, the functional PHEMA was obtained by freeze-drying.
:methanol (1:1) mixture. Then, the solution was poured into 10 mL distilled water and moved into a dialysis tube. The solution was dialyzed for 48 h. And then, the product was obtained by freeze-drying. About 0.1 g of PHEMA powder, 0.01 g of anthraquinone-2-carboxylic acid, 0.075 g of DCC, 0.001 g of DMAP and 4 mL of THF were added to a 5.0 mL ampule. The mixture was reacted at 25 °C for 24 h with magnetic stirring. After the reaction, the mixture was purified by dialysis for 48 h. And finally, the functional PHEMA was obtained by freeze-drying.
Preparation of GO nanocomposites
GO was prepared via the Hummer's method.34 And for the GO-DETA, 50 mg of GO was dispersed in 50 mL ethanol. Next the mixture was sonicated for several days to make the GO dispersed fully. Then 0.52 mL DETA was added. The mixture was reacted at 25 °C for 24 h with magnetic stirring. The products were purified by centrifugation and washed several times with ethanol, methanol and acetone. Finally the solid was dried until constant weight under vacuum to get GO-DETA.35 1 mg of GO-DETA was dispersed in 1 mL distilled water, and then 1 mL of activation reagents (0.4 M EDC and 0.1 M NHS) were added to the mixture. The mixture was under shacked for 1 h at ambient temperature. Removed the excess EDC and NHS by centrifugation after the shock. Then 0.1 mL Ab2 (0.01 mg mL−1) was added and the mixture was immediately shook at 37 °C for 2 h. Removed the excess antibody by centrifugation and washed with PBS. 7.5 mg PHEMA was dissolved in 1 mL DMSO, and then 1 mL of activation reagents was added to the solution. The solution was under shocked for 1 h at ambient temperature. Soon 100 μL of the solution was immediately mixed with the GO-DETA and shacked for 2 h at 37 °C. Then after centrifugation and washing with PBS, the nanocomposite was obtained and stored at 4 °C for future use.Fabrication of immunosensor
Before each experiment, the bare glassy carbon electrode (GCE) was successively polished with 0.3 and 0.05 μm alumina slurry, and it was then rinsed with distilled water, and cleaned ultrasonically sequentially in water and 95% ethanol for 5 min. The electrode was modified with reducing graphene oxide (rGO) and gold nanoparticles (AuNPs) after dried in nitrogen atmosphere. 5 mL GO dispersions (1 mg mL−1) and 100 μM HAuCl4 were added to a small beaker and degassed with nitrogen for 15 min. Then, the GCE was immersed in the solution and cyclic voltammetry was used. The potential was set to 0 to −1.5 V vs. Ag/AgCl and the sweep speed was 0.05 V s−1 for 300 s. The GCE was stored in 4 °C for future use.36 To loaded Ab1, the modified GCE was immersed in Ab1 solution (0.1 mg mL−1) for 30 min at 4 °C, and then the GCE was immersed in BSA solution (1%) to block non-specific sites for 30 min at 25 °C. Subsequently, AFP and the nanoprobe were assembled onto the electrodes in turn by incubated at 30 °C for half an hour, respectively. The excess materials were remove by careful washing. Thus, the electrochemical immunosensor with multiple signal amplification was ultimately obtained. In order to explore the selectivity of immunosensors, 1 μg mL−1 prostate-specific antigen (PSA), 1 μg mL−1 carcinoembryonic antigen (CEA) and 25 ng mL−1 AFP were detected by the immunosensors under same conditions, respectively. And their signal value was compared. To evaluate the practicability of the immunosensors, different concentrations of AFP were added to the normal human serum, which was diluted ten times and then immersed for 20 min.Characterization
The number-average molecular weight (Mn) and molecular weight distribution of the synthesized PHEMA were analyzed by Gel Permeation Chromatograph(GPC, Waters 1515) equipped with a refractive-index detector (Waters 2414) using HR column (7.8 × 300 mm). The FT-IR spectra measurements were performed on a Nicolet is 50 (Thermo Fisher Nicolet, United States) Fourier transform infrared spectrometer equipped with Thermo Nicolet corporation OMINIC 32 software. The 1H NMR spectrum of the PHEMA was performed via INOVA 400 MHz nuclear magnetic resonance instrument with DMSO-d6 as solvent and tetramethylsilane (TMS) as internal standard. Thermogravimetric analysis (TGA) was performed on a NETZSCH STA409PC instrument. The morphology of the GO and PHEMA/GO were characterized via a scanning electron microscopy (SEM, BRUKER SU8010) and transmission electron microscopy (TEM, JEOL JEM-1230, Japan). The CHI 660C electrochemical workstation (CH Instruments, Shanghai) with traditional three-electrode system was used to carried out the square wave voltammetry (SWV). While Ag/AgCl and platinum wire were used as reference and counter electrodes, glassy carbon electrode was used as a working electrode.Results and discussion
Preparation and characterization of nanoprobe
The immunosensor fabrication was described in Scheme 1. Scheme 1(a) shows the synthesis of functional PHEMA. The preparation procedure of GO nanocomposite is presented in Scheme 1(b). GO was used to immobilize antibodies and multiple amplify signals. Scheme 1(c) shows the process of immunosensor assembly. PHEMA was synthesized by RAFT polymerization using 4-cyanopentanoicacid dithiobenzoate (CPADB) as RAFT regent. Anthraquinone-2-carboxylic acid was used to modify PHEMA through their unique interaction with the wealth of hydroxyl groups. The polymerization was carried out in DMF, with the following reaction conditions: [HEMA]0:[CPADB]0:[AIBN]0 = 200:1:0.5, VHEMA:VDMF = 1:1. The first-order kinetic plots for the RAFT polymerization of PHEMA were shown in Fig. 1(a) and (b). As shown in the figures, the conversion of the monomer increased significantly with the increase of reaction time. And ln([M]0/[M]) (ln([M]0/[M]) = kappp[R˙]t) showed extremely matched linear relationship with reaction time, which indicated first-order kinetics of the polymerization process. The plots of the number-average molecular weight (Mn) and molecular weight distributions (Mw/Mn), were shown in Fig. 1(b), indicating that the Mn of PHEMA increased linearly with the monomer conversion and kept close with the theoretical molecular weights. And the Mw/Mn values remained quite low.
 | ||
| Scheme 1 (a) Preparation process of Functional PHEMA; (b) assembling process toward the nanoprobe and (c) schematic presentation of the immunosensor fabrication. | ||
 | ||
| Fig. 1 (a) First-order kinetics investigation of PHEMA; (b) number-average molecular weight (Mn) and molecular weight distribution (Mw/Mn) vs. monomer conversion for the RAFT polymerization of PHEMA; (c) 1H NMR spectrum of PHEMA recorded at 25 °C with DMSO-d6 as solvent; (d) FT-IR spectra of PHEMA, anthraquinone-2-carboxylic acid and functional PHEMA; (e) FT-IR spectra of GO and GO-DETA; (f) the TG spectra of GO, PHEMA and nanocomposite. | ||
The 1H NMR spectrum was used to analyze the PHEMA (Fig. 1(c)). The signal at δ = 0.97–1.99 ppm belongs to the shift of methyl (a) and methylene (b). The signal at δ = 3.90 ppm (c) was attributed to the methylene connect to the ester group. The signal at δ = 3.54 ppm (d) was attributed to the methylene which connect to the hydroxyl group. And the signal at δ = 4.80 ppm (e) was attributed to the hydroxyl group. These chemical shifts demonstrated the successful synthesis of PHEMA. In order to investigate whether the anthraquinone-2-carboxylic acid was successfully connected to the PHEMA, the products were characterized by FT-IR. The results were shown in Fig. 1(d). After comparison, it can be seen that a set of weak peaks appeared at 1400–1650 cm−1 in the spectrum of functional PHEMA. Which corresponds to the stretching vibration of the benzene ring, and was consistent with the anthraquinone-2-carboxylic acid. In addition, the other peaks of the PHEMA did not change significantly after the reaction. This proves that PHEMA is successfully combined with anthraquinone-2-carboxylic acid. GO and GO-DETA were also characterized by FT-IR. As shown in Fig. 1(e), the peaks at 1720, 1613, 1206 and 1048 cm−1 were attributed to C![[double bond, length as m-dash]](https://www.rsc.org/images/entities/char_e001.gif) O stretching, CC stretching of the aromatic ring, epoxy C–O stretching, and alkoxy C–O stretching vibration of GO, respectively. A decrease could be found for GO-DETA at the peak of 860 cm−1, which was attributed to the epoxy C–O stretching vibration. In addition, the GO-DETA exhibited new peaks at 1363 and 1120 cm−1, corresponding to O–H bending and C–N stretching vibrations, respectively. These indicated that DETA reacted successfully with the epoxy groups of GO. The broad peak at 3000–3300 cm−1 also showed the generation of amino groups. Thus, GO was successfully modified to GO-DETA. As shown in Fig. 1(e), PHEMA has an about 10% mass loss below 150 °C due to the evaporation of water absorbed. The mass then remained almost constant until the temperature rose to 300 °C. There is a sharp decease between 300 °C and 450 °C, corresponding to the decomposition of low-molecular segments into volatile small molecules. The mass does not reduce after the temperature rose to 450 °C. It can be seen from the TG spectrum that GO has about 43% mass loss between 150 °C and 450 °C. This is a significant difference with the weight loss curve of the nanocomposite. It can be seen from the spectra that the curve of the composite located between the other two curves roughly. The distinction is that it continues losing weight before 450 °C. And its mass is between the other two polymers after constant weight, it has a weight loss of about 90% until constant weight. By calculation as reported ref. 30 and 31, PHEMA weight content relative to the nanocomposite was roughly calculated to be 88.4%. The morphology of the PHEMA/GO and GO were characterized by SEM and TEM. From Fig. S1(a and c),† GO had a layered structure, the surface of GO was relatively smooth and showed no other impurities. After grafting of PHEMA (in Fig. S1(b and d)†), this morphology differs from typical GO, where a pretty rough surface of grafted polymer layer can be observed. In addition, the change of color intensity can be clearly seen in Fig. S1d,† the darker color is the place where the polymer is grafted, and there has a certain thickness layer. The results indirectly indicated that the PHEMA was successfully grafted to the surface of GO.
O stretching, CC stretching of the aromatic ring, epoxy C–O stretching, and alkoxy C–O stretching vibration of GO, respectively. A decrease could be found for GO-DETA at the peak of 860 cm−1, which was attributed to the epoxy C–O stretching vibration. In addition, the GO-DETA exhibited new peaks at 1363 and 1120 cm−1, corresponding to O–H bending and C–N stretching vibrations, respectively. These indicated that DETA reacted successfully with the epoxy groups of GO. The broad peak at 3000–3300 cm−1 also showed the generation of amino groups. Thus, GO was successfully modified to GO-DETA. As shown in Fig. 1(e), PHEMA has an about 10% mass loss below 150 °C due to the evaporation of water absorbed. The mass then remained almost constant until the temperature rose to 300 °C. There is a sharp decease between 300 °C and 450 °C, corresponding to the decomposition of low-molecular segments into volatile small molecules. The mass does not reduce after the temperature rose to 450 °C. It can be seen from the TG spectrum that GO has about 43% mass loss between 150 °C and 450 °C. This is a significant difference with the weight loss curve of the nanocomposite. It can be seen from the spectra that the curve of the composite located between the other two curves roughly. The distinction is that it continues losing weight before 450 °C. And its mass is between the other two polymers after constant weight, it has a weight loss of about 90% until constant weight. By calculation as reported ref. 30 and 31, PHEMA weight content relative to the nanocomposite was roughly calculated to be 88.4%. The morphology of the PHEMA/GO and GO were characterized by SEM and TEM. From Fig. S1(a and c),† GO had a layered structure, the surface of GO was relatively smooth and showed no other impurities. After grafting of PHEMA (in Fig. S1(b and d)†), this morphology differs from typical GO, where a pretty rough surface of grafted polymer layer can be observed. In addition, the change of color intensity can be clearly seen in Fig. S1d,† the darker color is the place where the polymer is grafted, and there has a certain thickness layer. The results indirectly indicated that the PHEMA was successfully grafted to the surface of GO.
Optimization of the immunosensor response
To demonstrate the detection of AFP by the immunosensor, which were constructed by the PHEMA/GO nanocomposite, the electrochemical behavior of the immunosensor was investigated. Fig. 2(a) showed the typical square wave voltammetry curve of the immunosensors with a peak at 0.52 V vs. Ag/AgCl. Comparing to the signal value of the blank, there is a significantly high current value when the concentration of AFP is 2.5 ng mL−1. Besides, in order to make signal amplification of PHEMA/GO more convincing, PHEMA/GO is compared with GO using CV characterization, the result demonstrates that PHEMA/GO has higher electrical signal (in Fig. S2†). The comparison of electrochemical impedance spectroscopy (EIS) was made to confirm the validity of the electrode after every modification step. As shown in Fig. 2(b), the electron transfer resistance (Ret) became smaller after rGO/AuNPs modified, which was consistent with the high conductivity and electron transfer rate of AuNPs. And after immobilization of the Ab1 and BSA, the Ret increased because these macromolecules hinder the conduction of current. After loading AFP and nanoprobe, the value of Ret increased. The results showed that rGO/AuNPs, Ab1, BSA, AFP and nanoprobe were all loaded on the surface of glassy carbon electrode. The content of BSA has a great influence on electrochemical behavior. In order to optimize the content of BSA, a series of BSA solution with the concentration from 0% to 2% were prepared. The immunosensors were measured by SWV. It can be seen in Fig. 2(c) that when the concentration of BSA is less than 1%, the signal value is positively correlated with it. And the signal value decreased when the BSA content exceeds 1%. This is because excessive BSA hindered the transfer of electrons on the surface of the electrode. Thus, 1% is the optimal concentration of BSA. Another influence factor is incubation time. It was investigated in the time range of 10–35 min. Fig. 2(d) shows that the signal value rapidly increased within the first 30 min and then keep level due to the saturation of the antigen–antibody binding. Considering its effect on electrochemical behavior, the proportion of PHEMA in nanocomposite was explored. Keep the amount of GO (m = 1 mg) constant, different composites were constructed by increasing the amount of PHEMA. Fig. 2(e) shows that the current response rapidly increased before the amount of PHEMA increased to 7.5 mg. And then the signal value tended to level due to the saturation of the PHEMA/GO. It can be seen from the thermogravimetric results that the PHEMA in the nanocomposite accounted for a large proportion. As an important parameter of the PHEMA, the molecular weight of PHEMA also has a great impact on the electrochemical behavior. We prepared different composites constructed by a series of PHEMA with different molecular weight. The detection of AFP (2.5 ng mL−1) by these nanocomposites were explored. The results were shown in Fig. 2(f). From these results, it can be seen that with the increase of PHEMA molecular weight, the signal value increased. Comparing to the Mn PHEMA = 7100 g mol−1, when Mn PHEMA = 32000 g mol−1 the signal value increased significantly due to the PHEMA with more signal molecules.
 | ||
| Fig. 2 (a) Square wave voltammetry (SWV) for immunosensor in the absence and presence of AFP (25 pg mL−1); (b) electrochemical impedance spectroscopy (EIS) of different modified electrodes in 0.1 M KCl containing 2.5 mM K3Fe(CN)6 and K4Fe(CN)6; (c) the peak currents against the content of BSA; (d) the plots of the peak currents against incubation time of AFP during sandwich immunoassay; (e) the plots of the peak currents against the graft density of nanocomposites; (f) the peak currents against the molecular weight of PHEMA. | ||
The electrocatalytic detection of AFP
Under the optimal conditions, different concentrations of AFP were detected by the immunosensor, and the results were shown in Fig. 3(a and b). The detection range of the immunosensor is from 2.5 ng mL−1 to 2.5 × 10⁴ pg mL−1 (R2 = 0.997). And it exhibited a low detection limit of 0.403 pg mL−1 (S/N = 3). Table 1 showed the comparison of different electrochemical immunosensors for the detection of AFP. It can be seen that the immunosensor we prepared has a significantly low detection limit and an acceptable detection range. Specificity is an important indicator of electrochemical immunosensor.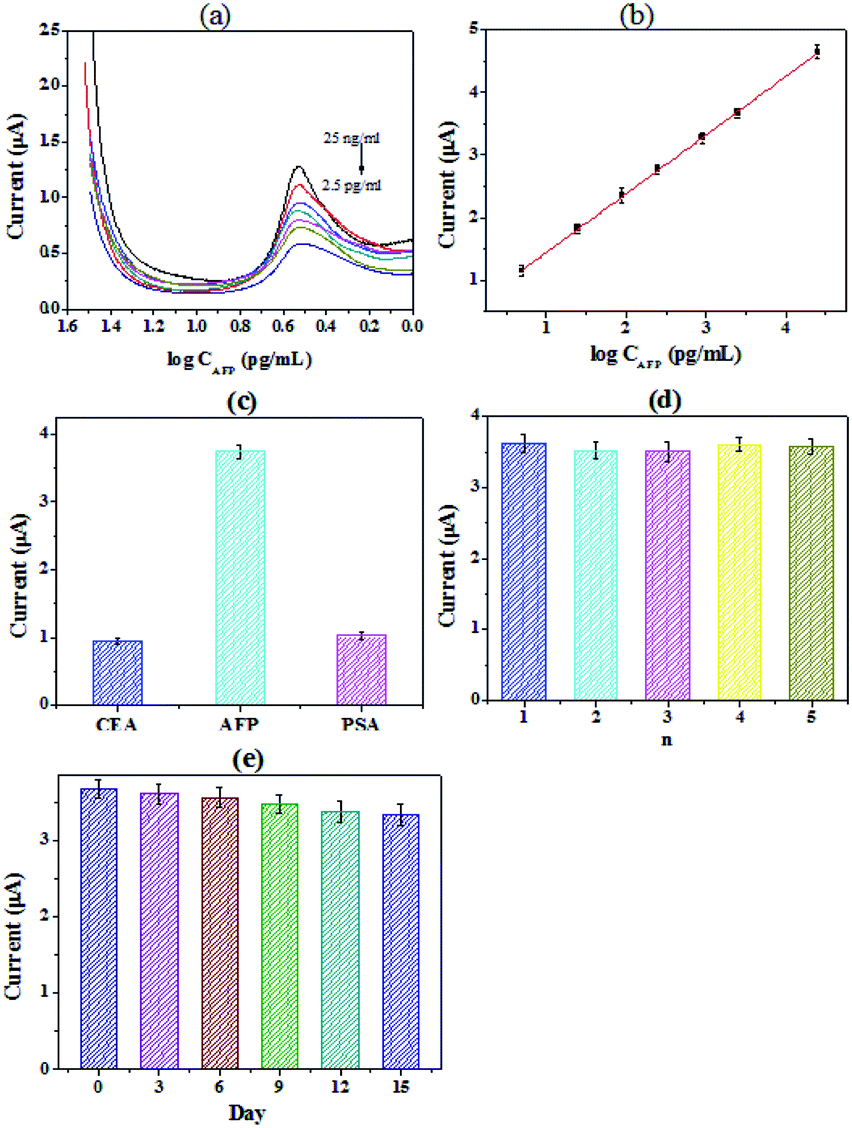 | ||
| Fig. 3 (a) The detection range of the immunosensor is from 2.5 ng mL−1 to 2.5 × 10⁴ pg mL−1. (b) Quantitative measurements of the peak currents as a function of the concentration of AFP. (c) Specificity investigation of the electrochemical immunosensor for AFP (25 ng mL−1), CEA (1 μg mL−1) and PSA (1 μg mL−1); (d) the reproducibility study of the immunosensor; (e) the time stability study of the immunosensor. | ||
| Method | Electrode | Detection range | LODs | Reference |
|---|---|---|---|---|
| Electrochemical immunosensor | ITO glass | 0.01–300 ng mL−1 | 0.85 fg mL−1 | 37 |
| Electrochemical immunosensor | ITO electrode | 0.5–50 ng mL−1 | 0.1 ng mL−1 | 38 |
| Electrochemical immunosensor | GCE electrode | 0.035–35 ng mL−1 | 0.106 pg mL−1 | 39 |
| Electrochemical immunosensor | GCE electrode | 0.1–100 ng mL−1 | 30 pg mL−1 | 40 |
| Electrochemical immunosensor | GCE electrode | 0.1–300 ng mL−1 | 0.03 ng mL−1 | 41 |
| Electrochemical immunosensor | CILE electrode | 1–250 ng mL−1 | 0.1 ng mL−1 | 42 |
| Electrochemical immunosensor | GCE electrode | 0.0025–25 ng mL−1 | 0.403 pg mL−1 | This work |
The prostate specific antigen (PSA), carcinoembryonic antigen (CEA) and AFP were chosen to explored the selectivity of the immunosensor, the results were shown in Fig. 3(c). We can see from the figure that the signal value of PSA and CEA were all obviously lower than that of AFP, while the concentration of PSA and CEA were significantly higher. The results confirmed that the specificity of the proposed immunoassay is acceptable for the determination of AFP43 The reproducibility of the immunosensor was also investigated. A series of freshly prepared electrodes were used for the detection of AFP. The results were shown in Fig. 3(d). For the electrodes, the relative standard deviation (RSD) of the measurements was 3.7%, proving that the reproducibility of the immunosensor is quite good. And the long-term stability of the immunosensor was further studied. The working electrodes were prepared and stored at 4 °C before use. As shown in Fig. 3(e), the current of the immunosensor was dropped by 3.1% after 6 days. The response current still maintained 90.7% after 15 days. The results show that the immunosensor constructed by PHEMA/GO nanocomposite has good stability.
Application of the immunosensor in the analysis of real samples
Moreover, the standard addition method was used to evaluate the accuracy of the immunosensor. By adding different concentrations of AFP to human serum, the different samples were prepared. The analytical results for AFP were listed in Table 2. It can be seen form the result that the recovery and relative standard deviation values are acceptable. This implies the accuracy of the immunosensor is good, it also indicates that the immunosensor can be used for the analytical detection in complex human serum.| Entry | Standard value (ng mL−1) | Average value (ng mL−1) | RSD (%, n = 3) | Recovery (%) |
|---|---|---|---|---|
| 1 | 1.75 | 1.72 | 2.62 | 98.3 |
| 2 | 0.175 | 0.168 | 2.03 | 96 |
| 3 | 0.0175 | 0.0179 | 3.35 | 102.3 |
Conclusions
In this work, PHEMA and GO were used to construct a nanocomposite, which exhibited excellent performance in electrochemical immunosensor. Owing to the excellent biocompatibility of PHEMA, the immobilized AFP antibody could retain high bioactivity. And at the same time, PHEMA provided a large number of contact sites for signaling molecules. It greatly improved the sensitivity of detection. The introduction of GO further immobilized antibodies and achieved multiple amplification of the signal. The immunosensor exhibited favorable selectivity, high sensitivity, and ultralow detection limit. Furthermore the immunosensor could be used to detect target AFP in human serum, demonstrating the feasibility of clinical diagnosis. By changing aptamers of different target molecules, the PHEMA/GO composite can be used to detect various tumor markers, so it may have potential prospect for other studies.Conflicts of interest
There are no conflicts to declare.Acknowledgements
The financial was supported by the National Natural Science Foundation of China (No. 51573075 and 51773086), the Natural Science Foundation of Shandong Province (No. ZR2014BQ016), the Project of Shandong Province Higher Educational Science and Technology Program (No. J16LC20) and the Program for Scientific Research Innovation Team in Colleges and universities of Shandong Province.References
- J. Z. Lv, Y. M. Miao and G. Q. Yan, RSC Adv., 2017, 7, 41063–41069 RSC.
- D. C. Yang, J. Wang, H. Chen, H. Xu, W. X. Wang, H. W. Yang, D. L. Wei and L. J. Bai, Anal. Methods, 2018, 10, 2390–2397 RSC.
- Q. Gao, N. Liu and Z. Ma, Anal. Chim. Acta, 2014, 829, 15–21 CrossRef CAS PubMed.
- X. Lu, H. Bai, P. He, Y. Cha, G. Yang, L. Tan and Y. Yang, Anal. Chim. Acta, 2008, 615, 158–164 CrossRef CAS PubMed.
- K. Liu, J. Zhang, Q. Liu and H. Huang, Electrochim. Acta, 2013, 114, 448–454 CrossRef CAS.
- B. E. Burcu and S. M. Kemal, Talanta, 2015, 132, 162–174 CrossRef PubMed.
- X. Gong, H. Yan, J. Yang, Y. Wu, J. Zhang, Y. Yao, P. Liu, H. Wang, Z. Hu and J. Chang, Anal. Chim. Acta, 2016, 939, 84–92 CrossRef CAS PubMed.
- J. Chen, Q. H. He, Y. Xu, J. H. Fu, Y. P. Li, Z. Tu, D. Wang, M. Shu, Y. L. Qiu and H. W. Yang, Talanta, 2016, 147, 523–530 CrossRef CAS PubMed.
- X. Pei, B. Zhang, J. Tang, B. Liu, W. Lai and D. Tang, Anal. Chim. Acta, 2013, 758, 1–18 CrossRef CAS PubMed.
- Q. Gao, J. Han and Z. Ma, Biosens. Bioelectron., 2013, 49, 323–328 CrossRef CAS PubMed.
- F. Ricci, G. Adornetto and G. Palleschi, Electrochim. Acta, 2012, 84, 74–83 CrossRef CAS.
- H. Jia, J. Xu, L. Lu, Y. Yu, Y. Zuo, Q. Tian and P. Li, Sens. Actuators, B, 2018, 260, 990–997 CrossRef CAS.
- T. Yang, Y. Gao, Z. Liu, J. Xu, L. Lu and Y. Yu, Sens. Actuators, B, 2017, 239, 76–84 CrossRef CAS.
- H. Jia, T. Yang, Y. Zuo, W. Wang, J. Xu, L. Lu and P. Li, Microchim. Acta, 2017, 184, 3747–3753 CrossRef CAS.
- H. Jia, Q. Tian, J. Xu, L. Lu, X. Ma and Y. Yu, Mikrochim. Acta, 2018, 185, 517 CrossRef PubMed.
- Y. Gao, X. Zhu, T. Yang, J. Xu, L. Lu and K. Zhang, Microchim. Acta, 2015, 182, 2027–2035 CrossRef CAS.
- C. Y. Yean, B. Kamarudin, D. A. Ozkan, L. S. Yin, P. Lalitha, A. Ismail, M. Ozsoz and M. Ravichandran, Anal. Chem., 2008, 80, 2774–2779 CrossRef CAS PubMed.
- Y. S. Fang, H. Y. Wang, L. S. Wang and J. F. Wang, Biosens. Bioelectron., 2014, 51, 310–316 CrossRef CAS PubMed.
- Y. Wang, H. Chen, H. Xu, W. Wang and L. Bai, Mater. Chem. Phys., 2016, 183, 534–541 CrossRef CAS.
- M. Cui, Z. Song, Y. Wu, B. Guo, X. Fan and X. Luo, Biosens. Bioelectron., 2016, 79, 736–741 CrossRef CAS PubMed.
- W. Hu, G. He, H. Zhang, X. Wu, J. Li, Z. Zhao, Y. Qiao, Z. Lu, Y. Liu and C. M. Li, Anal. Chem., 2014, 86, 4488–4493 CrossRef CAS PubMed.
- G. B. Long, M. R. Islam, Y. T. Jeong, Y. S. Gal and K. T. Lim, Appl. Surf. Sci., 2012, 258, 2816–2822 CrossRef.
- S. M. Paterson, D. H. Brown, J. A. Shaw, T. V. Chirila and M. V. Baker, Aust. J. Chem., 2012, 65, 931–934 CrossRef CAS.
- Y. Mei, T. Wu, C. Xu, K. J. Langenbach, J. T. Elliott, B. D. Vogt, K. L. Beers, E. J. Amis and N. R. Washburn, Langmuir, 2005, 21, 12309–12314 CrossRef CAS PubMed.
- (a) S. H. Thang, Y. K. Chong, R. T. A. Mayadunne, G. Moad and E. Rizzardo, ChemInform, 1999, 30, 2435–2438 Search PubMed; (b) A. Yang, J. Li, C. Zhang, W. Zhang and N. Ma, Appl. Surf. Sci., 2015, 346, 443–450 CrossRef CAS; (c) Z. Su, H. Wang, K. Tian, F. Xu, W. Huang and X. Tian, Composites, Part A, 2016, 84, 64–75 CrossRef CAS; (d) W. Lu, T. Lin, Y. Wang, X. Cao, J. Ge, J. Dong and W. Qian, Ionics, 2015, 21, 1141–1152 CrossRef CAS; (e) Q. Zhu, Y. Chai, Y. Zhuo and R. Yuan, Biosens. Bioelectron., 2015, 68, 42–48 CrossRef CAS PubMed.
- D. Li, H. Chen, S. Wang, Z. Wu and J. L. Brash, Acta Biomater., 2011, 7, 954–958 CrossRef CAS PubMed.
- L. Yan, Y. B. Zheng, F. Zhao, S. Li, X. Gao, B. Xu, P. S. Weiss and Y. Zhao, Chem. Soc. Rev., 2012, 43, 97–114 RSC.
- X. Chen, X. Jia, J. Han, J. Ma and Z. Ma, Biosens. Bioelectron., 2013, 50, 356–361 CrossRef CAS PubMed.
- C. Li, Y. Yang, D. Wu, T. Li, Y. Yin and G. Li, Chem. Sci., 2016, 7, 3011–3016 RSC.
- D. J. Keddie, Chem. Soc. Rev., 2014, 43, 496–505 RSC.
- Y. Kwak, R. Nicolay and K. Matyjaszewski, ChemInform, 2010, 41, 1384–1401 Search PubMed.
- H. S. Wang, M. Song and T. J. Hang, ACS Appl. Mater. Interfaces, 2016, 8, 2881–2898 CrossRef CAS PubMed.
- G. L. Li, D. Wan, K. G. Neoh and E. T. Kang, Macromolecules, 2010, 43, 10275–10282 CrossRef CAS.
- Q. Li, L. Zhang, Z. Zhang, N. Zhou, Z. Cheng and X. Zhu, J. Polym. Sci., Part A: Polym. Chem., 2010, 48, 2006–2015 CrossRef CAS.
- A. Mostafa, R. Mahdi, N. Navid and A. Khadijeh, Biosens. Bioelectron., 2016, 77, 99–106 CrossRef PubMed.
- Y. Wei, Y. Li, N. Li, Y. Zhang, T. Yan, H. Ma and Q. Wei, Biosens. Bioelectron., 2016, 79, 482–487 CrossRef CAS PubMed.
- X. Jia, Z. Liu, N. Liu and Z. Ma, Biosens. Bioelectron., 2014, 53, 160–166 CrossRef CAS PubMed.
- F. Y. Kong, B. Y. Xu, Y. Du, J. J. Xu and H. Y. Chen, Chem. Commun., 2013, 49, 1052–1054 RSC.
- J. Wang, D. C. Yang, M. F. Chen, B. F. Liu, H. Chen, H. Xu, W. X. Wang and L. J. Bai, Anal. Methods, 2018, 10, 526–532 RSC.
- J. Guo, X. Han, J. Wang, J. Zhao, Z. Guo and Y. Zhang, Anal. Biochem., 2015, 491, 58–64 CrossRef CAS PubMed.
- Y. Hui, X. Ma, X. Hou, F. Chen and J. Yu, Ionics, 2015, 21, 1751–1759 CrossRef CAS.
- K. J. Huang, D. J. Niu, J. Y. Sun and J. J. Zhu, J. Electroanal. Chem., 2011, 656, 72–77 CrossRef CAS.
- J. Wang, Y. T. Wang, H. Chen, H. Xu, W. X. Wang and L. J. Bai, Sens. Actuators, B, 2018, 258, 998–1007 CrossRef CAS.
Footnote |
| † Electronic supplementary information (ESI) available. See DOI: 10.1039/c9ra02565k |
| This journal is © The Royal Society of Chemistry 2019 |