 Open Access Article
Facile fabrication of a novel BiPO4 phase junction with enhanced photocatalytic performance towards aniline blue degradation†
Ahmed B. Azzama,
S. M. El-Sheikh *b,
R. A. Geioushyb,
Bahaa Ahmed Salaha,
Farida M. El-Darsa and
Ahmed S. Helalc
aChemistry Department, Faculty of Science, Helwan University, Helwan, Egypt
bNanomaterials and Nanotechnology Department, Advanced Materials Division, Central Metallurgical R & D Institute (CMRDI), P. O. Box 87, Helwan, 11421 Cairo, Egypt. E-mail: selsheikh2001@gmail.com; saidelsheikh@cmrdi.sci.eg; Tel: +20 1022316076
cDepartment of Nuclear Science and Engineering, Massachusetts Institute of Technology, 77 Massachusetts Avenue, Cambridge, MA 02139, USA
First published on 3rd June 2019
Abstract
A novel BiPO4 photocatalyst has been fabricated via a facile precipitation route using dimethyl sulfoxide (DMSO) as a solvent. The physical and chemical properties of the BiPO4 photocatalyst material were analyzed using XRD, Rietveld refinements XRD, FE-SEM, TEM, HR-TEM, EDS, XPS, FT-IR, Raman spectra, UV-Vis (DRS), and PL. The results confirm that hexagonal phase BiPO4 (HBIP) nanorods were successfully synthesized. FE-SEM images reveal that the addition of surfactant “CTAB” during preparation can control the surface morphology of BiPO4. The Rietveld refinement technique revealed the formation of a monazite monoclinic (nMBIP) and monoclinic (mMBIP) phase junction resulting from the calcination of HBIP at 500 °C. The photocatalytic behavior of the as-synthesized hexagonal and monoclinic BiPO4 nanostructures towards aniline blue (AB) degradation under UV light was systematically investigated. Among all catalysts, the phase junction (nMBIP–mMBIP) structure demonstrated the highest photocatalytic activity. The degradation rate of AB over the (nMBIP–mMBIP) phase junction structure was 3.4 times higher than that by HBIP. These results suggested that the surface-phase junction provides a synergistic effect for the electron–hole transfer process.
1. Introduction
Nowadays, photocatalysts are widely used for solving environmental and energy issues.1–4 Semiconductors such as g-C3N4,5,6 CdS,7 Ag3VO4,8 ZnO,9 and TiO2 (ref. 10–12) have been employed in dealing with the emergence of environmental pollution issues. Among the above-mentioned photocatalysts, bismuth-based photocatalysts have attracted considerable attention for environmental and energy related applications.13 BiPO4 has a wide band gap (3.5–4.6 eV), while incorporation with nonmetal oxy-acid displayed an efficient photocatalytic dye degradation compared to TiO2 (P25).14 The limited absorption of BiPO4 is one of the major drawbacks for widespread applications.15 Developing an efficient and stable BiPO4 photocatalyst continues to be a challenging endeavor. This can take place via hetero-junctions with other semiconductors,16,17 and doping with nonmetals.18 Recently, semiconductor photocatalysts with phase junctions have played a dominant role in photocatalytic degradation.19 BiPO4 exists in three crystal structures; hexagonal (HBIP), monazite monoclinic (nMBIP), and monoclinic (mMBIP).20 In all crystal structures of BiPO4, bismuth is bonded with eight near neighbor oxygen atoms, while phosphorus is associated with four oxygen atoms.21 Furthermore, hexagonal BiPO4 (HBIP) has been transformed into (nMBIP–mMBIP) phases under calcination at different temperatures.22 It is reported that nMBIP–mMBIP phase junction structure provide an enhancement in the photocatalytic activity.15,23 Herein, BiPO4 with different morphologies was synthesized by facile precipitation method followed by calcination of HBIP at different temperatures to form a (nMBIP–mMBIP) phase junction structure. To the best of our knowledge, separation of the two monoclinic phases has been investigated by Rietveld refinements. In addition, the photocatalytic behavior under UV light was assessed by aniline blue (AB) degradation for the first time. Meanwhile, the photocatalytic mechanism is discussed.2. Experimental
2.1 Materials
Bismuth nitrate pentahydrate [Bi(NO3)3·5H2O, 99.99%], diammonium hydrogen phosphate [(NH4)2HPO4 > 99.0%], dimethylsulfoxide (DMSO > 99.9%) and cetyltrimethylammonium bromide (CTAB, 98%) were delivered from Sigma-Aldrich.2.2 Synthesis of BiPO4 nanostructures
A simple precipitation route is developed to prepare BiPO4 photocatalyst. Briefly, 1.94 g of bismuth nitrate and 0.5 g cetyltrimethylammonium bromide (CTAB) were dissolved in 40 ml dimethylsulfoxide (DMSO), and stirred for 30 min to obtain a clear solution. A 0.524 g (NH4)2HPO4 was dissolved in 40 ml double distilled water, and added slowly to the above mixture under vigorous stirring for 1 h. After that, centrifuged to collect white precipitate of BiPO4 (HBIP), washed with ethanol and water. Dried in oven at 90 °C for 6 h. Calcination of BiPO4 (HBIP) sample was investigated at different temperatures in the range from 400 to 600 °C, under constant heating rate (2 °C min−1 for 2 h). Also, BiPO4 photocatalyst was synthesized without CTAB.2.3 Characterization
X-ray diffraction data (XRD) were acquired on Bruker, Axs D8, using Cu-Kα radiation, λ = 1.5406 Å, with 2θ ranging from 15° to 55° and scan rate of 2° min−1, Germany. Rietveld refinements XRD were carried out on Panalytical X-Pert pro diffractometer (XRPD) with a Cu target, and a conventional 1.8 kW sealed X-ray tube source. Quanta FEG-250 SEM with 20 kV accelerated voltage and transmission electron microscopy (TEM, JEOLJEM-1230, Japan) are used as a diagnostic tool for morphology study. For mapping EDS, an energy dispersive X-ray spectroscopy were analyzed by JEOL 2010 TEM. The specific surface area of the as-synthesized photocatalysts, after degassing at 170 °C for 3 h, were determined by N2 adsorption–desorption based Brunauer–Emmett–Teller (BET) and Barret–Joyner–Halenda (BJH) curves using (Quantachrome NOVA instrument, USA). The elemental composition and the oxidation state were characterized by XPS and recorded on PHI Versa probe II, using monochromatic Al Kα (15.0 kV with kinetic energy of 1486.6 eV). Raman scattering spectra measurements were collected with using Bruker, senterra dispersive micro-Raman at 532 nm Nd:YAG laser source, Germany. The vibration spectrum of BiPO4 samples were performed by Fourier Infrared absorption spectrometer FT-IR using PerkinElmer Spectrum (200–4000 cm−1). UV-Vis Spectrophotometer, Jasco-V-570 was used to collect the absorption spectra of BiPO4 samples. The photoluminescence (PL) spectrum was analyzed using RF-5310 PC spectrofluorophotometer, Shimadzu.2.4 Photocatalytic performance test
The photocatalytic activity of the hexagonal and monoclinic BiPO4 photocatalysts was evaluated by aniline blue degradation under UV irradiation. In details, 0.05 g BiPO4 photocatalyst was suspended in 100 ml of (AB) dye (20 ppm), and stirred vigorously in darkness for 30 min. The photodegradation process was performed using UV lamp (20 W–254 nm) at room temperature. After each 20 min, approximately 3 ml liquid sample was withdrawn, and centrifuged for 10 min at 4000 rpm. The AB concentration was measured spectrophotometry at 606 nm. The calculated degradation (%) was carried out using the following formula:| Degradation (%) = [C0 − Ct]/C0 × 100% |
3. Results and discussions
3.1 Characterization of BiPO4
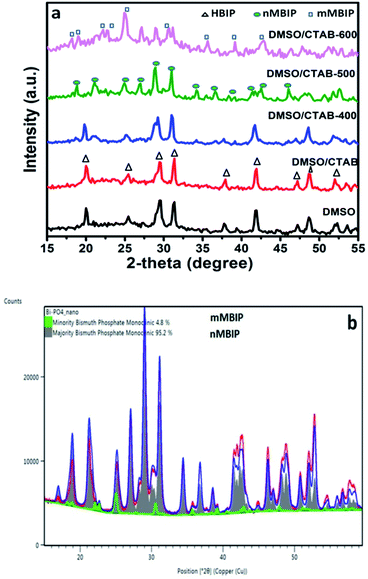
The crystal and phase compositions of the as-prepared BiPO4 photocatalysts were analyzed by XRD technique as presented in Fig. 1a. Evidently, BiPO4 photocatalysts prepared in DMSO or DMSO/CTAB have the same diffraction peaks at 2-theta angles 20.1°, 25.5°, 29.5°, 31.3°, 37.8°, 41.9°, 47.3° and 48.7° which correspond to the crystal orientations of (101), (110), (200), (102), (112), (211), (301) and (212) planes of BiPO4, respectively. These results agreed with JCPDS card no. 15-0766.4 Obviously, there is no significant difference in the BiPO4 samples prepared with and without CTAB. Further, the diffraction patterns were ascribed to the BiPO4 hexagonal phase (HBIP, space group: P3121), and no impurity peaks were detected, indicates the crystallinity nature. The as-prepared hexagonal BiPO4 sample prepared in DMSO/CTAB was calcined at different temperatures (400–600 °C) for 2 h with heating rate 2 °C min−1. It was found that, BiPO4 calcined at 400 °C still displays the major hexagonal phase (HBIP) and some minor monazite monoclinic BiPO4 (nMBIP) phase was detected. When the calcination was increased to 500 °C, XRD data indicates the phase junction formation of major (nMBIP) and minor (mMBIP). The diffraction peaks at 18.9°, 21.2°, 25.09°, 27.12°, 29.02°, 30.09°, 31.14°, 34.43°, 36.84°, 38.5°, 41.61°, 42.57°, and 46.21° associated with monazite monoclinic (nMBIP, JCPDS card no. 89-0287)24 and those at 22.14°, 22.93°, 25.17°, 30.74° attributed to mMBIP (JCPDS card no. 77-2208).25 Separation of the two monoclinic phases obtained at 500 °C was examined by Rietveld refinements as shown in Fig. 1b. It is clearly shown that the percentage of nMBIP and mMBIP is 95.2% and 4.8%, respectively. In addition, no peaks attributed to hexagonal BiPO4 phase appeared at 500 °C. At 600 °C calcination temperature, the two monoclinic phase structures (nMBIP and mMBIP) existed simultaneously. However, the proportion of mMBIP more than that of nMBIP phase at 600 °C. This illustrates the formation of BiPO4 phase structures (nMBIP and mMBIP) via calcination in the range from 500–600 °C as reported previously in the literature.25 These results suggest that polymorphic BiPO4 form can be selectively controlled by varying calcination temperature.Fig. 2 presents the SEM images for all samples, clearly, nanorods-like morphology BiPO4 were formed in DMSO. The diameters of nanorods is about 30 to 200 nm, and 500 nm in lengths as seen in Fig. 2 a. Further, the synthesized BiPO4 sample in DMSO/CTAB shows nanorod bundles with 300 nm in diameter, and 800 nm in lengths as seen in Fig. 2b. These results illustrate the critical significant role of CTAB as surfactant in controlling the BiPO4 morphology. Many cracks were observed on the surface which might be related to the growth defect. The FE-SEM image of BiPO4 sample calcined at 400 °C revealed the spindle like-morphology with a highly fused state (Fig. 2c). Further increasing the temperature to 500 °C and 600 °C, the nanorod bundles-like morphology was converted to clusters as seen in Fig. 2(d and e), respectively.
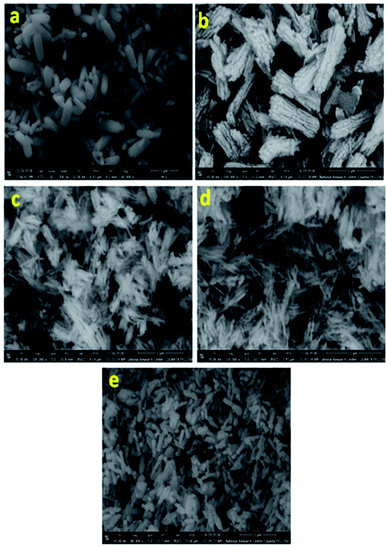 | ||
| Fig. 2 SEM images of BiPO4 prepared in DMSO (a), DMSO/CTAB (b), and calcined DMSO/CTAB at 400 °C (c), 500 °C (d), and 600 °C (e). | ||
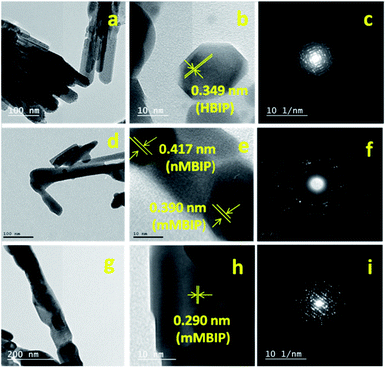
The TEM image of BiPO4 sample prepared in DMSO/CTAB showed that BiPO4 formed as bundles-like morphology self-assembled by nanorods (Fig. 3a). The diameter of nanorod ranged from 30–40 nm as seen in Fig. 3a. HRTEM image of BiPO4 nanorod bundles exhibited that the fringe spacing is 0.349 nm (Fig. 3b). This spacing related to (110) lattice plane of the hexagonal BiPO4 (HBIP) phase (JCPDS card no. 15-0766) as shown in Fig. 3b. SAED pattern displayed a concentric ring shape, which confirms the polycrystalline sample in nature as presented in (Fig. 3c). TEM image of the BiPO4 (nMBIP–mMBIP) calcined at 500 °C revealed the clusters nanorods were formed with diameters varying from 30 to 50 nm as seen in Fig. 3d. The corresponding HR-TEM image (Fig. 3e) shows a fringe spacing 0.417 nm, that agreed with (−111) lattice plane of nMBIP (JCPDS card no. 89-0287), and 0.390 nm which ascribed to (011) lattice plane of mMBIP (JCPDS card no. 77-2208). It is clearly demonstrated that the BiPO4 phase structure (nMBIP and mMBIP) was formed. The corresponding (SAED) pattern showed the concentric rings as presented in Fig. 3f. Moreover, TEM image of the BiPO4 calcined at 600 °C (Fig. 3g) shows clusters nanorods with diameter of 100 nm which is larger than that calcined at 500 °C. HRTEM image (Fig. 3h) revealed that the lattice fringe spacing is 0.290 nm, and matched with (111) lattice plane of mMBIP (JCPDS card no. 77-2208). The corresponding of a selected clusters nanorods (Fig. 3i) showed a regular arrays, indicates a single crystal structure. These results are well agreed with XRD data. Fig. S1† presents an image about annular dark-field of BiPO4 calcined at 500 °C. The EDS mapping of BiPO4 calcined at 500 °C shows that the elemental compositions are Bi, P, and O elements, as shown in Fig. S1.†
The specific surface areas measured for BiPO4 prepared in DMSO and BiPO4 calcined at 500 °C were 88.96, and 67.52 m2 g−1, respectively (Table S1, ESI†). As shown in a previous reports, a low specific surface area is the major problem for the practical use of in the environment.18,26 However, we have been successfully synthesized BiPO4 photocatalyst with larger surface area using DMSO as a solvent. Therefore, DMSO plays a dominate role for increasing surface area values. As seen, the BiPO4 prepared in DMSO has a larger surface area than BiPO4 calcined at 500 °C. The decreasing in surface area after calcination at 500 °C is due to the highly fused state morphology as depicted in SEM and TEM images (Fig. 2 and 3).
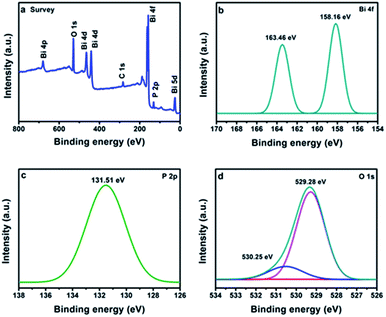
The valence states of the elements were identified by the XPS. The full survey confirms the presence of Bi, P and O in BiPO4 calcined at 500 °C (Fig. 4a). The peaks appeared at 158.16 and 163.46 eV are due to Bi 4f7/2 and Bi 4f5/2, respectively as shown in Fig. 4b.3 The separation distance between Bi 4f7/2 and Bi 4f5/2 peaks is 5.3 eV, implying for Bi3+.27 The peak located at 131.51 eV is characterized to P 2p in BiPO4 (Fig. 4c).28 Moreover, the two peaks at 529.28 and 530.25 eV are related to O 1 s in crystal lattice, and (–OH) group, respectively as presented in Fig. 4d.29,30
FT-IR spectroscopy was performed on BiPO4 samples to investigate the chemical bonding as seen in Fig. S2.† For BiPO4 (HBIP) prepared in DMSO or DMSO/CTAB revealed that the peaks at 587 and 534 cm−1 correspond to asymmetric bending of δ (O–P–O) and ν4 (PO4), respectively.31 the band located at 974 cm−1 referred to ν3 (PO4) asymmetric stretching. The hydroxyl band located at 1602 cm−1 is characterized to δ (H–O–H) bending modes of H2O. The absorption band of hydroxyl stretching ν (O–H) centered at 3495 cm−1 (data not shown) was assigned to H2O coordinated with the bismuth atoms. Upon calcination of HBIP at 400 °C, the stretching modes of PO4 group were changed and slightly splitted to four absorption bands. These absorption bands at 1064, 986, 951 and 918 cm−1 are gradually strengthened with increasing the calcinations from 400 to 600 °C, implying the transformation of hexagonal BiPO4 phase (HBIP) to monoclinic BiPO4 phase (MBIP).22 The band located at 534 cm−1 is splitted into four bands (494, 512, 527, and 549 cm−1) after HBIP calcination at 500 and 600 °C, which attributes to asymmetric bending (ν4) vibrations of PO4 group.25 This splitting revealed the transformation of HBIP to MBIP phase. Moreover, the band at 587 cm−1 of HBIP sample is slightly shifted to 599 cm−1 after calcination at 500 and 600 °C, which may be explained by the rotation of the PO4 tetrahedron. The bending vibrations for O–H group nearly disappeared with increasing the calcination up to 500 and 600 °C.
The Raman spectra of BiPO4 samples prepared in DMSO, DMSO/CTAB, and calcination temperature at 400, 500, 600 °C are presented in Fig. 5. The observed two bands at 969, and 1057 cm−1 for BiPO4 synthesized in DMSO or DMSO/CTAB can be attributed to ν1 symmetric stretching, and ν3 asymmetric stretching of the PO4 group, respectively.32 The peaks at 590, 551, 447, and 403 cm−1 refer to the ν4 and ν2 (PO4) bending modes.33 The band at 204 cm−1 is due to (O–Bi–O) symmetric bending mode.34 Obviously, calcination of HBIP indicated a significant changes in the Raman spectra. Under calcination of HBIP at 400 °C, the ν3 asymmetric stretching band showed a blue shift to 1042 cm−1, and slightly increased to 1037 cm−1 with increasing the calcination to 500 and 600 °C. In addition at 500 °C calcination temperature, the stretching mode of Bi–O located at 168 and 240 cm−1 are attributed to monoclinic Bi–O polyhedra.25 The Raman peaks ascribed to monoclinic phase are relatively narrow than that of hexagonal phase.35 The two bands at 918 and 277 cm−1 appeared after calcination at 500 °C corresponding to the ν1 (PO4) symmetric stretching band and (Bi–O) stretching modes, respectively.15 These two bands are characteristic for the nMBIP. At the same time, the ν4 and ν2 bending modes of PO4 group indicated a red shift to 602 and 460 cm−1, respectively. Further, calcination at 600 °C, the ν1 (PO4) symmetric stretching mode is splitted into two peaks at 966, and 979 cm−1. In addition, the bending modes of O–P–O displayed a significant red shift to 406, 484, and 607 cm−1, these features appeared at 600 °C are related to the mMBIP phase.
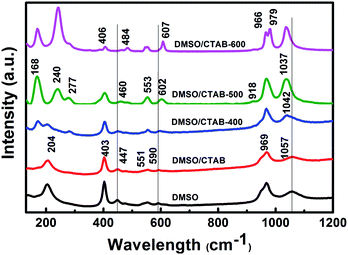 | ||
| Fig. 5 Raman spectra of BiPO4 prepared in DMSO, DMSO/CTAB, and calcination at 400 °C, 500 °C, and 600 °C. | ||
The Raman analysis is agreed with XRD, HR-TEM, and FT-IR analysis which indicates the transformation of HBIP to nMBIP and to mMBIP phase under calcination temperature effect.
The UV-Vis diffuse reflectance for HBIP and MBIP samples were presented in Fig. 6a. The absorption band of HBIP initiates at 310 nm. Moreover, it was found that BiPO4 under calcination at different temperatures shows optical absorption at 350 nm. The optical band gap (Eg) of the samples was evaluated using the Kubelka–Munk function as follow:36
| (F(R)hν)0.5 = A(hν − Eg) |
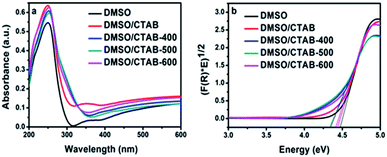 | ||
| Fig. 6 (a) UV-Vis diffuse reflection spectrum of BiPO4 synthesized in DMSO, DMSO/CTAB, and calcination of DMSO/CTAB at different temperatures; (b) Tauc plots ((F(R)hv)0.5 vs. hv) constructed from Fig. 6a. | ||
Fig. 7 shows the PL spectra at room temperature for BiPO4 samples prepared in DMSO, DMSO/CTAB, and calcined BiPO4 at different temperatures. The emission spectra appeared at about 468 nm. The hexagonal BiPO4 sample prepared in DMSO exhibited the highest emission peak intensity compared to others, indicates the highest electron–hole pairs recombination rate. In contrast, the calcined of BiPO4 at 500 °C exhibited the weakest emission peak intensity, this might be attributed to the surface phase junction formation in monoclinic BiPO4, which revealing the lowest charges recombination rate. Consequently, these results prove that the presence of surface phase junction has diminished the rate of recombination between charges transfer and thus expected to improve the behavior of photocatalytic.
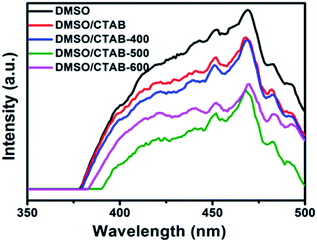 | ||
| Fig. 7 PL spectra of BiPO4 synthesized in DMSO, DMSO/CTAB, and calcination of DMSO/CTAB at different temperatures. | ||
3.2 Photocatalytic performance
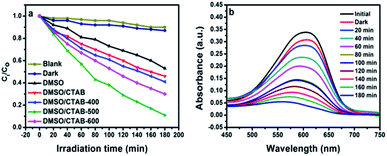
Aniline blue (AB) degradation reactions were carried out under UV light to investigate the photocatalytic behavior of the BiPO4 samples. As presented in Fig. 8a, no degradation of AB was observed without photocatalyst addition under UV light irradiation, indicating the stability of aniline blue and its photolysis difficulty. In addition, it was found that 46.26, 53.78, 58.82, 91.12, and 70% of aniline blue were degraded after 180 min in the presence of BiPO4 photocatalyst prepared in DMSO, DMSO/CTAB, and calcined at 400, 500, 600 °C, respectively. Clearly, hexagonal BiPO4 samples prepared in (DMSO or DMSO/CTAB) displayed lower photocatalytic activity compared to monoclinic phase as reported before.20 With increasing the BiPO4 calcination, aniline blue degradation rate are improved. Surprisingly, when the calcination temperature rise to 600 °C, the AB degradation rate was decreased. Meanwhile, the calcined BiPO4 at 500 °C showed the highest catalytic activity compared to others samples. This illustrates the higher proportion of nMBIP than mMBIP at 500 °C as discussed in (Rietveld refinement method), which exhibited higher catalytic activity.37 This finding demonstrates that nMBIP phase with the most distorted PO4 tetrahedron possess the highest photocatalytic activity toward pollutants degradation. Fig. 8b shows the temporal absorption spectral changes of AB using calcined BiPO4 at 500 °C. During the photodegradation reactions, the absorption peak intensity at 606 nm reduced gradually, and about 91.12% of AB could be degraded after 180 min.The crystal structures of BiPO4 calcined at 500 °C clearly shows that the change in distortion of polyhedron (Bi–O) and tetrahedron (P–O) is attributed to the symmetry of the crystal structures as shown in Fig. S3.† The bond length in Bi–O and P–O of nMBIP are dispersed broadly more than mMBIP.38 Therefore, the improvement in photocatalytic activities is related to crystal structures of BiPO4.
The photocatalytic behavior was assigned to the first-order kinetics of Langmuir–Hinshelwood model as follows.39
| ln(Ct/C0) = − kappt |
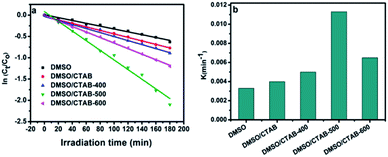 | ||
| Fig. 9 (a) Linear transform ln(Ct/C0) = f(t) of the AB degradation kinetics curves; (b) first-order rate constant of all as-synthesized BiPO4 samples. | ||
The rate constant of BiPO4 calcined at 500 °C was 0.0113 min−1 as shown in Fig. 9b. This was 3.4 and 2.8 times more than that of BiPO4 prepared in DMSO (kapp 0.0033 min−1) or DMSO/CTAB (kapp 0.004 min−1), respectively. This behavior was thought to be due to the formation of BiPO4 phases (nMBIP–mMBIP) at 500 °C which enhance the charges transfer, thus improved the photocatalytic performance.
3.3 Photodegradation mechanism
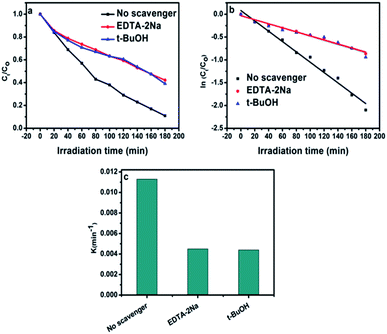
Different scavengers have been added during the oxidation reactions to determine the oxidative species in the photocatalytic system. EDTA-2Na and t-BuOH were selected as the hole and radical scavenger, respectively.40 Obviously, the AB degradation rate was significantly suppressed by using EDTA-2Na, and/or t-BuOH indicating that the holes and radicals are mainly oxidative species as shown in Fig. 10a. The kapp value with various scavengers is estimated from the relation between ln(Ct/C0) versus time (t) as shown in Fig. 10b. The change in the rate constant with addition of scavengers was indicated as presented in Fig. 10c. It can be seen that the presence of EDTA-2Na and/or t-BuOH show a significant effect in decreasing kapp. In contrast, sample performed in the absence of scavengers has the highest kapp value, confirming the dominant role of holes and radicals in the phase junction system. The electron–hole pairs separation over BiPO4 phase junction system is shown in Scheme 1. The transferring of the charges mainly depends on the band potential, which theoretically estimated using electronegativity concept.26,41 The photocatalyst band potential can be evaluated as follows:42| EVB = X − Ee + 0.5Eg |
| ECB = EVB − Eg |
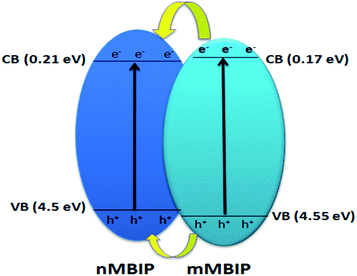 | ||
| Scheme 1 Schematic diagram shows the electron–hole separation over BiPO4 phase junction system under UV light irradiation. | ||
3.4 Stability evaluation
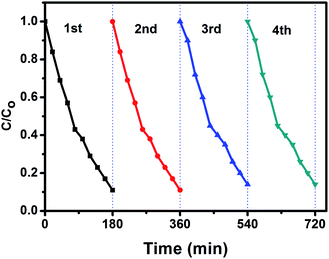
The stability and reusability is an important parameter of the photocatalytic process. In order to investigate the photocatalytic stability of the photocatalyst, the circulation runs for photocatalytic degradation of aniline blue (AB) with the BiPO4 phase junction (nMBIP–mMBIP) calcined at 500 °C are carried out to evaluate its cycling stability.Prior to the next cycle experiment, the previously used photocatalyst is subjected to washed with distilled water, dried at 90 °C, added to 100 ml of (AB) dye (20 ppm), and irradiated under UV light. After each 20 min, approximately 3 ml liquid sample was withdrawn, centrifuged, and measured using spectrophotometer instrument. As seen in Fig. 11, the photocatalytic performance was monitored for four successive cycles. The activity was decreased slightly up to 85% in the fourth cycle. This indicates that nMBIP–mMBIP phase junction displays high stability and no photocorrosion occurred during the photocatalytic oxidation process.
4. Conclusions
Hexagonal BiPO4 photocatalyst has been fabricated by a facile precipitation route using DMSO as a solvent. By using surfactant (CTAB), BiPO4 nanorod bundles could be obtained, revealing the controlling of BiPO4 morphology. Calcinating the hexagonal BiPO4 at different temperatures was also discussed. BiPO4 calcined at 500 °C indicated the superior performance for AB degradation and its rate constant was 3.4 times higher than that by HBIP. The nMBIP–mMBIP phase junction system facilities the separation of the photogenerated e−/h+ pairs, thus enhanced the behavior of photocatalytic. The results provide that nMBIP verifies the dominate role for enhancing the performance of photocatalytic rather than mMBIP.Conflicts of interest
There are no conflicts to declare.Acknowledgements
This study was partly supported by Central Metallurgical Research and Development Institute (CMRDI), Egypt project no. 39/2108 and Massachusetts Institute of Technology (MIT), USA.Notes and references
- Y. Wang, B. Li, G. Li, X. Ma, H. Zhang, Y. Huang, G. Wang, J. Wang and Y. Song, Chem. Eng. J., 2017, 322, 556–570 CrossRef CAS.
- D. Yuan, L. Huang, Y. Li, Y. Xu, H. Xu, S. Huang, J. Yan, M. He and H. Li, RSC Adv., 2016, 6, 41204–41213 RSC.
- J. Wang, J. Jin, X. Wang, S. Yang, Y. Zhao, Y. Wu, S. Dong, J. Sun and J. Sun, J. Colloid Interface Sci., 2017, 505, 805–815 CrossRef CAS PubMed.
- X. Zou, C. Ran, Y. Dong, Z. Chen, D. Dong, D. Hu, X. Li and Y. Cui, RSC Adv., 2016, 6, 20664–20670 RSC.
- H. Sun, G. Zhou, Y. Wang, A. Suvorova and S. Wang, ACS Appl. Mater. Interfaces, 2014, 6, 16745–16754 CrossRef CAS PubMed.
- M. Wei, L. Gao, J. Li, J. Fang, W. Cai, X. Li and A. Xu, J. Hazard. Mater., 2016, 316, 60–68 CrossRef CAS PubMed.
- T. Wu, P. Wang, J. Qian, Y. Ao, C. Wang and J. Hou, Dalton Trans., 2017, 46, 13793–13801 RSC.
- M. Yan, Y. Wu, Y. Yan, X. Yan, F. Zhu, Y. Hua and W. Shi, ACS Sustainable Chem. Eng., 2016, 4, 757–766 CrossRef CAS.
- F. Kiantazh and A. Habibi-Yangjeh, Solid State Sci., 2015, 49, 68–77 CrossRef CAS.
- S. M. El-sheikh, T. M. Khedr, G. Zhang, V. Vogiazi, A. A. Ismail, K. O. Shea and D. D. Dionysiou, Chem. Eng. J., 2017, 310, 428–436 CrossRef CAS.
- G. Zhang, Y. C. Zhang, M. Nadagouda, C. Han, K. O'Shea, S. M. El-Sheikh, A. A. Ismail and D. D. Dionysiou, Appl. Catal., B, 2014, 144, 614–621 CrossRef CAS.
- S. M. El-Sheikh, T. M. Khedr, A. Hakki, A. A. Ismail, W. A. Badawy and D. W. Bahnemann, Sep. Purif. Technol., 2017, 173, 258–268 CrossRef CAS.
- P. Madhusudan, J. Ran, J. Zhang, J. Yu and G. Liu, Appl. Catal., B, 2011, 110, 286–295 CrossRef CAS.
- C. Pan and Y. Zhu, Environ. Sci. Technol., 2010, 44, 5570–5574 CrossRef CAS PubMed.
- Y. Zhiu, Y. Liu, Y. Lv, Q. Ling, D. Liu and Y. Zhu, J. Mater. Chem. A, 2014, 2, 13041–13048 RSC.
- N. Mohaghegh, M. Tasviri, E. Rahimi and M. R. Gholami, RSC Adv., 2015, 5, 12944–12955 RSC.
- V. A. Online, X. Jia, J. Cao, H. Lin, M. Zhang, X. Guo and S. Chen, RSC Adv., 2016, 6, 55755–55763 RSC.
- L. She, G. Tan, H. Ren, J. Huang, C. Xu and A. Xia, RSC Adv., 2015, 5, 36642 RSC.
- J. Zhang, Q. Xu, Z. Feng, M. Li and C. Li, Angew. Chem., Int. Ed., 2008, 47, 1766–1769 CrossRef CAS PubMed.
- C. Pan and Y. Zhu, Catal. Sci. Technol., 2015, 5, 3071–3083 RSC.
- Y. Cao, N. Liu, J. Tian, Y. Liu and X. Zhang, Chem. Phys. Lett., 2015, 640, 180–183 CrossRef CAS.
- M. Zhao, G. Li, J. Zheng, L. Li, H. Wang and L. Yang, CrystEngComm, 2011, 13, 6251 RSC.
- Y. Guo, P. Wang, J. Qian, Y. Ao, C. Wang and J. Hou, Appl. Catal., B, 2018, 234, 90–99 CrossRef CAS.
- J. Li, H. Yuan and Z. Zhu, RSC Adv., 2016, 6, 70563–70572 RSC.
- M. H. Fulekar, A. Singh, D. P. Dutta, M. Roy, A. Ballal and A. K. Tyagi, RSC Adv., 2014, 4, 10097–10107 RSC.
- Y. Liu, P. Zhang, H. Lv, J. Guang, S. Li and J. Jiang, RSC Adv., 2015, 5, 83764–83772 RSC.
- Y. Yan, Z. Zhou, W. Li, Y. Zhu, Y. Cheng, F. Zhao and J. Zhou, RSC Adv., 2014, 4, 38558–38567 RSC.
- M. Lu, G. Yuan, Z. Wang, Y. Wang and J. Guo, Nanoscale Res. Lett., 2015, 10, 1–7 CrossRef CAS PubMed.
- M. Wang, Y. Che, C. Niu, M. Dang and D. Dong, J. Hazard. Mater., 2013, 262, 447–455 CrossRef CAS PubMed.
- J. Li, H. Yuan and Z. Zhu, Appl. Surf. Sci., 2016, 385, 34–41 CrossRef CAS.
- Y. Zhang, B. Shen, H. Huang, Y. He, B. Fei and F. Lv, Appl. Surf. Sci., 2014, 319, 272–277 CrossRef CAS.
- G. Li, Y. Ding, Y. Zhang, Z. Lu, H. Sun and R. Chen, J. Colloid Interface Sci., 2011, 363, 497–503 CrossRef CAS PubMed.
- J. Li, H. Yuan and Z. Zhu, J. Alloys Compd., 2015, 640, 290–297 CrossRef CAS.
- G. Lakshminarayana, T. D. Dao, K. Chen, M. Sharma, T. Takeda, M. G. Brik, I. V. Kityk, S. Singh and T. Nagao, Opt. Mater., 2015, 39, 110–117 CrossRef CAS.
- M. Zhao, G. Li, L. Li, L. Yang and J. Zheng, Cryst. Growth Des., 2012, 12, 3983–3991 CrossRef CAS.
- F. Feng, W. Yang, S. Gao, C. Sun and Q. Li, ACS Sustainable Chem. Eng., 2018, 6, 6166–6174 CrossRef CAS.
- L. Zhu, X.-G. Ma, Y. Wei, L. Chu, H.-H. Wang and C.-Y. Huang, Chin. J. Struct. Chem., 2017, 36, 1299–1306 CAS.
- C. Pan, D. Li, X. Ma, Y. Chen and Y. Zhu, Catal. Sci. Technol., 2011, 1, 1399–1405 RSC.
- L. She, G. Tan, H. Ren, J. Huang, C. Xu and A. Xia, RSC Adv., 2015, 5, 36642–36651 RSC.
- Y. Zhang, H. Fan, M. Li and H. Tian, Dalton Trans., 2013, 42, 13172 RSC.
- H. Xu, Y. Xu, H. Li, J. Xia, J. Xiong, S. Yin, C. Huang and H. Wan, Dalton Trans., 2012, 41, 3387 RSC.
- F. Duo, Y. Wang, X. Mao, X. Zhang, Y. Wang and C. Fan, Appl. Surf. Sci., 2015, 340, 35–42 CrossRef CAS.
Footnote |
| † Electronic supplementary information (ESI) available. See DOI: 10.1039/c9ra02315a |
| This journal is © The Royal Society of Chemistry 2019 |

