
 Open Access Article
 This Open Access Article is licensed under a Creative Commons Attribution-Non Commercial 3.0 Unported Licence
Ferromagnetic and excellent microwave absorbing properties of CoNi microspheres and heterogeneous Co/Ni nanocrystallines
Zhongzhu Wang *,
Wei Yang,
Qingrong Lv,
Shiqiao Liu and
Zhi Fang
*,
Wei Yang,
Qingrong Lv,
Shiqiao Liu and
Zhi Fang
Engineering Technology Research Center of Magnetic Materials of Anhui Province, School of Physics & Materials Science, Anhui University, Hefei 230601, China. E-mail: wangzz@ahu.edu.cn
First published on 30th April 2019
Abstract
CoNi microspheres with different diameters and heterogeneous Co/Ni nanocrystallines were synthesized via changing hydrothermal reaction parameters. The heterogeneous Co/Ni nanocrystallines comprised three kinds of particle morphologies, i.e., nanoflakes, nanospheres and needle-like nanowhiskers. The heterogeneous Co/Ni nanocrystalline sample coating (containing 60 wt% powder) exhibited a maximum reflection loss (RL) of −33 dB at 17.6 GHz and a bandwidth of less than −10 dB covering the 15.04–18.00 GHz range with a coating thickness of 1 mm. The CoNi microsphere sample with diameters in the range of 0.4–2.5 μm exhibited excellent microwave absorption abilities in the C-band (4–8 GHz) and X-band (8–11.5 GHz). However, the sample of chain-like assemblies from CoNi microspheres with a diameter above 2 μm presented poor microwave absorption in the 2–18 GHz range. In contrast, the excellent microwave absorption properties of the heterogeneous Co/Ni nanocrystalline sample in the Ku-band (12–18 GHz) could be attributed to the relatively high permeability (1.63–1.10) and optimal impedance matching between permittivity and permeability.
1. Introduction
The microwave absorption properties of magnetic transition metals (Fe, Co, and Ni) and their alloys originate from the ferromagnetic loss, dielectric loss, and eddy current loss, all of which are heavily dependent on their morphology, particle size and microstructure in the 2–18 GHz frequency range.1–3 It has been proven that among these magnetic transition metals, cobalt increases the natural resonance frequency owing to its high magnetocrystalline anisotropy.4 To date, based on their large shape anisotropy, various microwave absorption materials (MAMs) with morphologies of nanoflakes, nanowires, nanowhiskers, etc. have been synthesized.5–7 To obtain high dielectric loss and optimized impedance matching, multiple-phase structured MAM composites, such as Cu@Ni@RGO,8 RGO/BaFe12O19/Fe3O4,9 RGO/CoFe2O4/ZnS,10 PANI/a-Fe2O3@SiO2,11 Co/CoO,12 CoNi@C/RGO,13 and Fe–Fe3O4@C,14 have been widely investigated. However, to the best of our knowledge, heterogeneous ferromagnetic metal nanocrystalline MAMs have been seldom investigated. In this research, we intended to select heterogeneous Co/Ni magnetic metal nanocrystallines composed of nanowhisker-on-nanoflake and nanosphere-on-nanoflake heterogeneous structures as candidates of microwave absorbers. We hope that the heterogeneous magnetic metal nanocrystalline MAMs can exhibit a broad magnetic loss peak and high complex permeability values due to the coexistence effects of two kinds of shape anisotropies and two kinds of magnetocrystalline anisotropies coming from each magnetic metal phase. In addition, the nanoflakes with a high surface area could produce relatively strong interfacial polarization, and the heterogeneous magnetic metal structure could also produce additional interfacial polarization. Based on the above analysis, we infer that heterogeneous Co/Ni magnetic metal nanocrystallines can surely demonstrate a good microwave absorption performance.The hydrothermal method can provide an effective way to synthesize heterogeneous magnetic metal nanocrystallines.9 Wang and coworkers15 synthesized novel wire-on-flake heterostructured Co0.5Ni0.5P on a carbon cloth when the relative molar ratio of Co and Ni precursors was 1![[thin space (1/6-em)]](https://www.rsc.org/images/entities/char_2009.gif) :1 using the hydrothermal reaction. Zhao et al.8 prepared core–shell Cu@Ni nanorods using the hydrothermal method. Yu et al.16 used the magnetic field-assisted solvothermal method to fabricate the differently shaped assemblies of Ni–Co alloys with different microstructures by adjusting the experimental parameters of precursor concentrations and Ni/Co ratios. Based on the above samples, we also successfully synthesized heterogeneous Co/Ni magnetic metal samples with the structures of nanowhisker-on-nanoflake and nanosphere-on-nanoflake by adjusting the precursor concentration.
:1 using the hydrothermal reaction. Zhao et al.8 prepared core–shell Cu@Ni nanorods using the hydrothermal method. Yu et al.16 used the magnetic field-assisted solvothermal method to fabricate the differently shaped assemblies of Ni–Co alloys with different microstructures by adjusting the experimental parameters of precursor concentrations and Ni/Co ratios. Based on the above samples, we also successfully synthesized heterogeneous Co/Ni magnetic metal samples with the structures of nanowhisker-on-nanoflake and nanosphere-on-nanoflake by adjusting the precursor concentration.
In this study, a series of CoNi structures (microspheres, chain-like assemblies, and heterogeneous nanocrystallines) were synthesized. Their microwave absorption mechanisms are different from each other. The chain-like assemblies from the Co67Ni33 alloy microspheres should possess high permittivity, high dielectric loss and strong eddy current loss in the 2–18 GHz range due to self-assembled structures. Eddy current loss is beneficial for microwave absorption; however, strong eddy current losses sometimes lead to low permeability and poor impedance matching due to the skin effect.18 Well-dispersed spherical particles may possess relatively low permittivity, relatively low dielectric loss and relatively high permeability due to relatively higher electric resistivity compared to closely agglomerated particles. The heterogeneous Co/Ni nanocrystallines may exhibit a broad magnetic loss peak and high complex permeability values due to the coexistence effects of shape anisotropy and magnetocrystalline anisotropy coming from each magnetic metal phase. Thus, the relations among the microstructure, particle shape and microwave absorption properties of the Co67Ni33 microspheres and the heterogeneous Co/Ni nanocrystallines were thoroughly revealed in the 2–18 GHz range.
2. Experimental
CoNi nanoparticles were prepared via the hydrothermal method. In a typical process, a solution containing CoCl2·6H2O (1.6 g), NiCl2·6H2O (0.8 g), NaOH (3 g), and hexadecyltrimethylammonium bromide (CTAB, 2 g) was transferred to a 50 mL Teflon-lined stainless steel autoclave and then heated to a desired temperature (160, and 180 °C) for various time periods (2 h, 6 h). After cooling to room temperature, the product was repeatedly washed with ethanol and distilled water and then dried in air. The as-prepared samples were labelled as sample #1 (160 °C for 2 h) and sample #2 (160 °C for 6 h). Sample #3 was hydrothermally prepared at 180 °C for 6 h by reducing the amount of added CoCl2·6H2O (0.6 g) and NiCl2·6H2O (0.3 g) while keeping the other conditions identical. Sample #4 was hydrothermally prepared at 180 °C for 6 h by reducing the CTAB amount while keeping the added CoCl2·6H2O (1.6 g) and NiCl2·6H2O (0.8 g) similar to those of sample #1.The morphologies were visualized using TEM (TEM, JEM-2100) and FESEM (FESEM, Regulus8230). X-ray powder diffraction (XRD) patterns were obtained on a Rigaku D/MAX-cA X-ray diffractometer using Cu Kα radiation. The powder sample was used to measure the magnetic properties by the SQUID MPMS system at room temperature.17 The complex permeability (μ′, μ′′) and complex permittivity (ε′, ε′′) were obtained on an Agilent 8510C vector network analyzer in the 2–18 GHz range using an Agilent 85071E material measurement software. The magnetic samples were embedded in a wax composite (60 wt% powder). The microwave absorption ability (reflection loss, RL) was calculated based on the measured complex permeability and complex permittivity at each frequency as reported in the literature.17
3. Results and discussion
The XRD peaks shown in Fig. 1 can be indexed to fcc Co/Ni phases (JCPDS 15-0806, JCPDS 01-1260) regardless of the several weak peaks that are indexed to the hcp Co phase (JCPDS 05-0727). Because of the almost similar peak positions of both fcc Co and fcc Ni, it was not possible to distinguish whether CoNi powders are solid solutions or mixtures of cobalt and nickel fcc phases.18 The average crystallite size (D) was determined using Scherrer's formula: 15.1, 17.1, 28.6, and 26.8 nm for samples #1, #2, #3, and #4, respectively.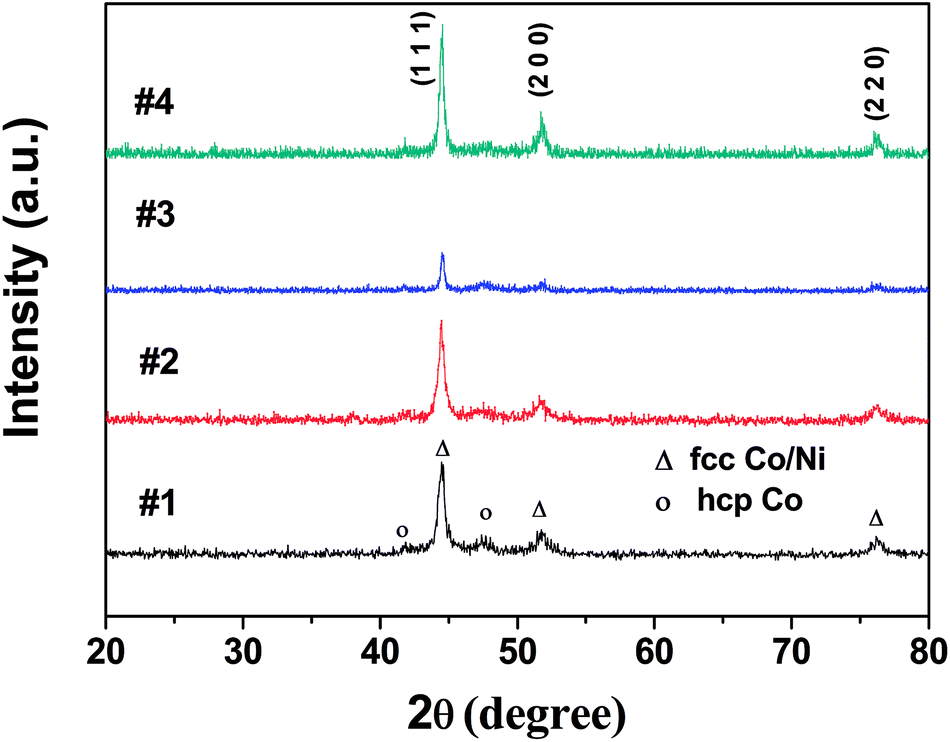 | ||
| Fig. 1 X-ray diffraction patterns of Co67Ni33 alloy microspheres for samples #1, #2, #3 and the heterogeneous Co/Ni nanocrystalline for sample #4. | ||
The morphologies of the obtained sample were visualized by SEM and TEM, as shown in Fig. 2. Sample #1 has microsphere morphology with an average diameter of 1 μm. Close scrutinization shows that the microspheres are assembled by interconnected NiCo nanocrystallines. The size of these microspheres increased to 0.4–2.5 μm by prolonging the reaction time to 6 h (Fig. 2c and d). Intriguingly, chain-like morphology assembled by CoNi microspheres was observed when the hydrothermal reaction was performed at 180 °C for 6 h (Fig. 2e and f, sample #3). Sample #4 exhibited a heterogeneous Co/Ni nanocrystalline structure after reducing the CTAB amount (Fig. 2g and h). The TEM image shows that the heterogeneous Co/Ni nanocrystalline contains nanoflakes, nanospheres, and needle-like nanowhiskers (Fig. 2g and h). It was found that the length and width of the nanoflakes were 500 and 300 nm, respectively; the average diameter of the nanospheres was ∼80 nm, and the length of the needle-like nanowhiskers was ∼30–140 nm. It is well-known that the hydrothermal reaction temperature, reaction time, CTAB mass, etc. have a great effect on the morphologies of the CoNi particles.19 The variation in size for CoNi microspheres (samples #1, #2, and #3) is mainly caused by different reaction times and temperatures. At low CTAB amount, one part of Co prefers to aggregate to form the hexagonal-like Co nanoflakes (hcp-Co), as verified by XRD result. Meanwhile, the other part of Ni and Co grow to form CoNi nanospheres. Additionally, the aggregation of Ni creates needle-like whiskers. The abovementioned mechanism on heterogeneous Co/Ni nanocrystallines needs further investigation in the future.
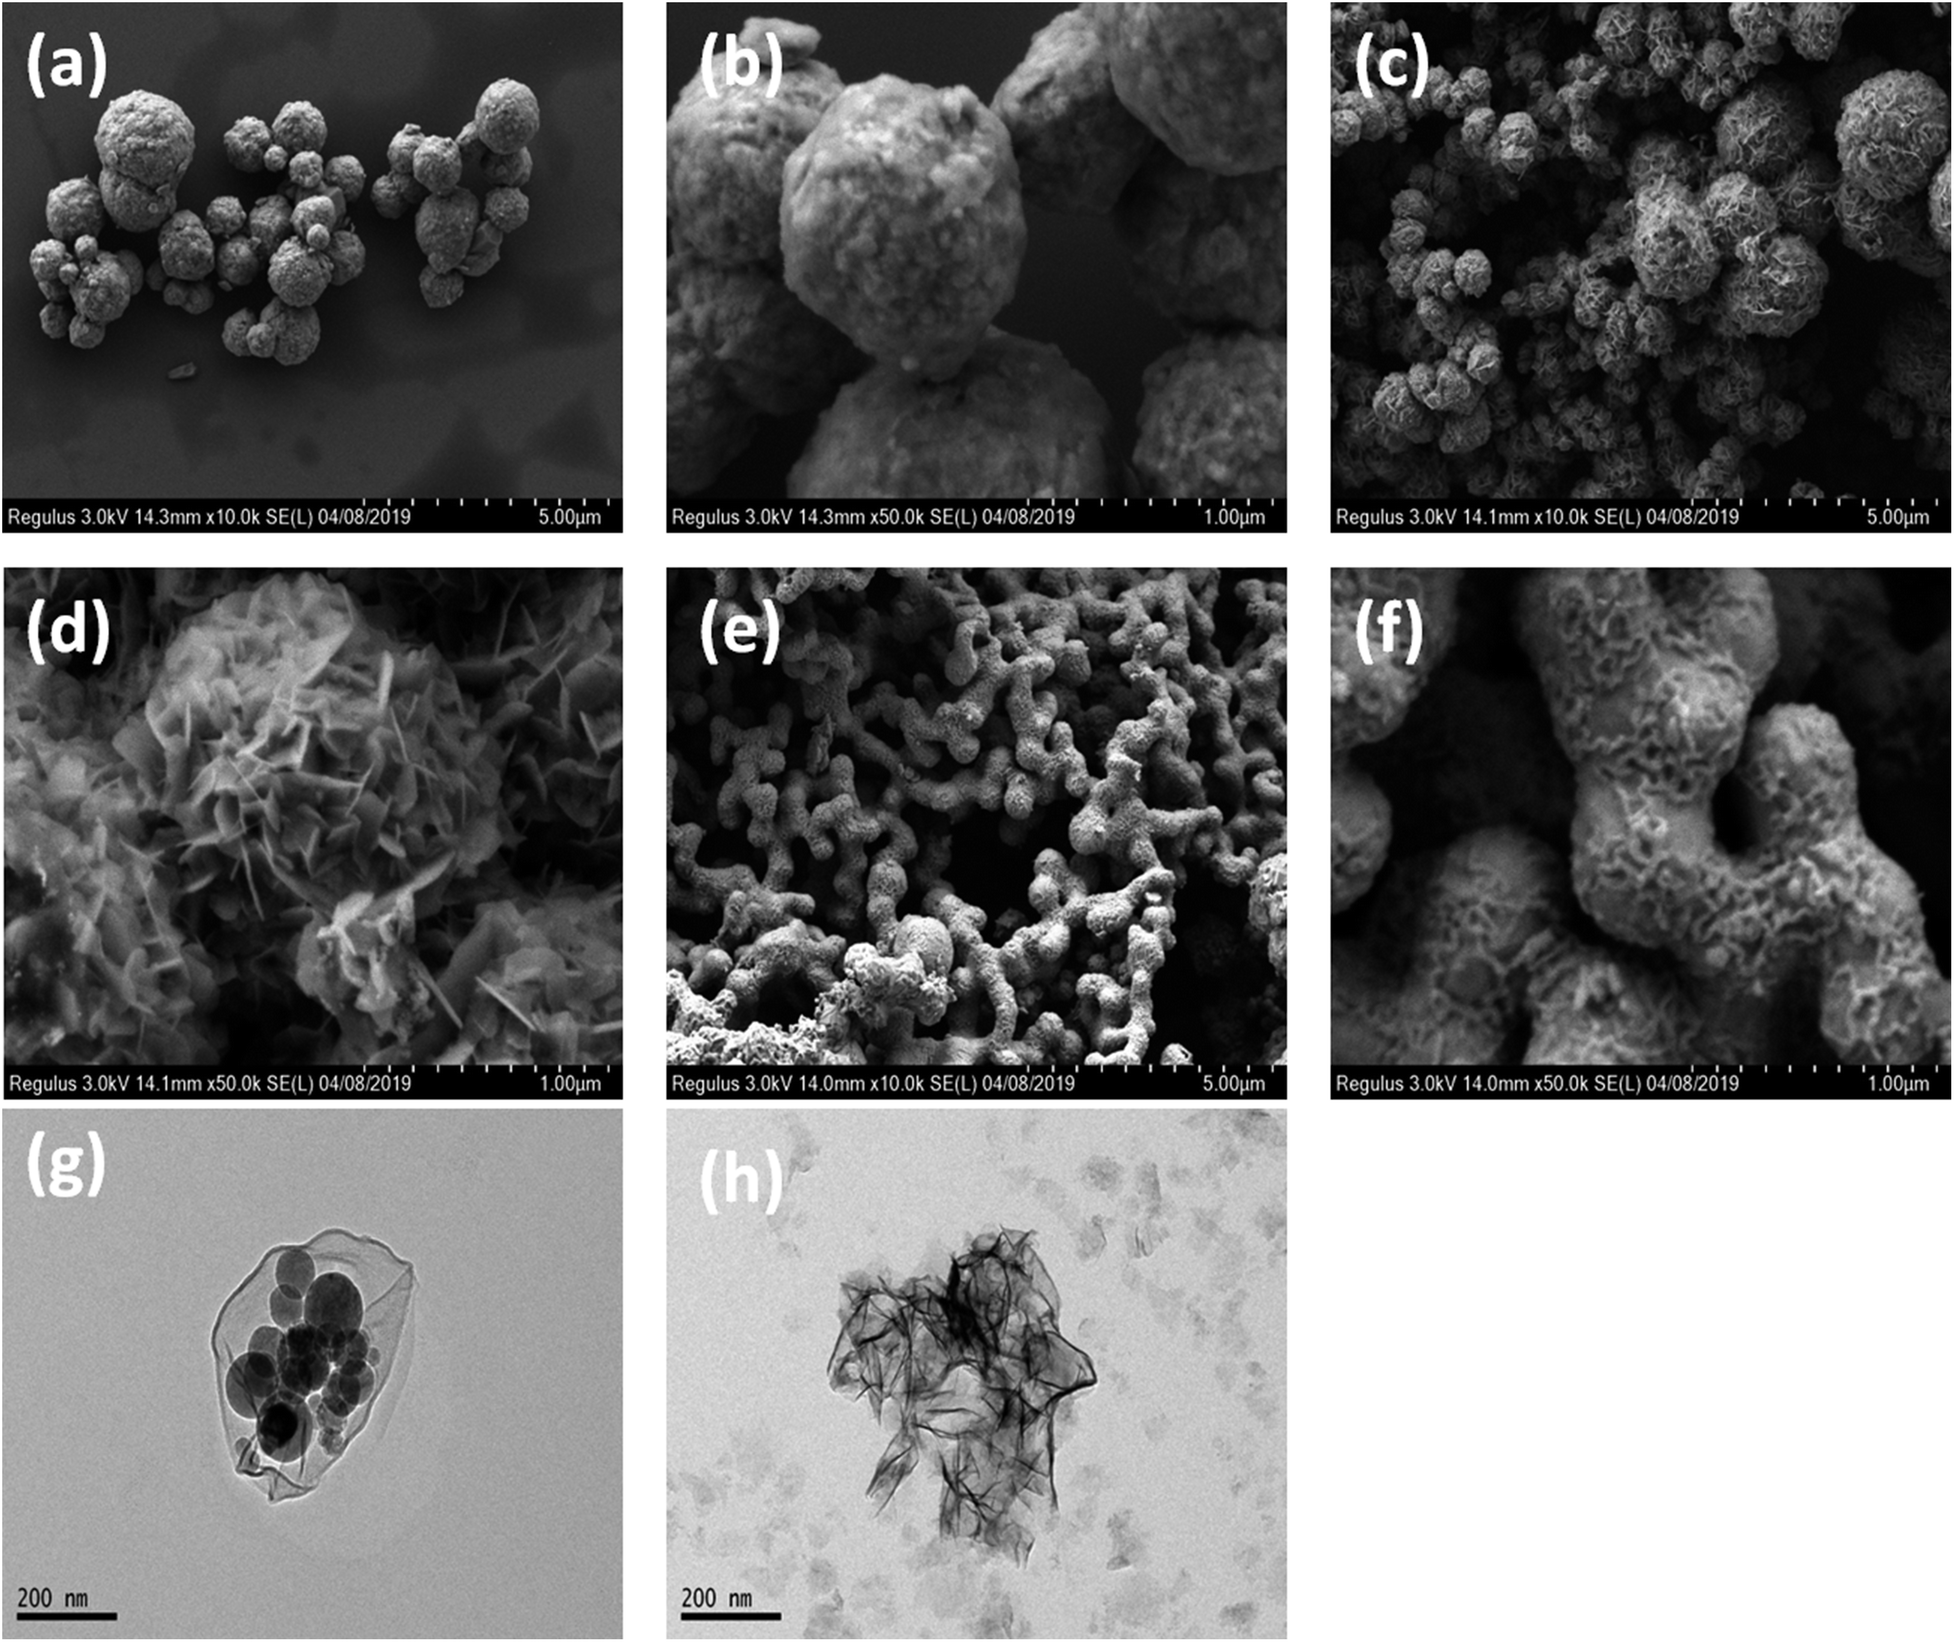 | ||
| Fig. 2 Low-magnification (a) and high-magnification (b) FESEM images of sample #1; FESEM images (c and d) of sample #2; FESEM images (e and f) of sample #3; TEM images (g and h) of sample #4. | ||
Fig. 3 shows the M–H hysteresis loops measured at room temperature. The saturated magnetization (Ms) values are 105, 101, 127.4, and 48 emu g−1; the coercive force (Hc) values are 115, 99, 241, and 30 Oe for samples #1, #2, #3, and #4, respectively. The sample #3 offers the highest Hc value of 241 Oe and Ms value of 127.4. In contrast, the heterogeneous Co/Ni nanocrystalline of sample #4 shows the lowest Ms and Hc values among the obtained samples. This result is likely because of the surface oxidation of Co/Ni nanocrystalline owing to its large surface area.20,21 Fig. 4 shows the complex permeability (μ′, μ′′) and permittivity (ε′, ε′′) of the obtained samples in the 2–18 GHz range. Sample #1 shows a maximum ε′ value of 18.7 at 9.6 GHz and a maximum ε′′ value of 8.7 at 11.28 GHz despite its broad peak. Sample #2 shows slightly decreased ε′ and ε′′ values. In contrast, sample #3 possesses the highest ε′ values of 41–21 and ε′′ value of 21–13 compared to samples #1 and #2. This result is likely because of the strong intrinsic electric dipole polarization due to its self-assembled structure. The ε′ value of sample #4 fluctuates between 14.7 and 16.2, while the ε′′ value changes between 0.3 and 2.63. Both sample #1 and #2 exhibit a sharp peak in the (ε′, ε′′)–f curves. In contrast, samples #3 and #4 show a plateau in the whole frequency range. The permeability μ′ of sample #4 decreases from 1.63 to 1.1, and μ′′ changes between 0.35 and 0.24 in the range of 2–18 GHz. The high complex permeability values of sample #4 might be because of its relatively strong magnetic resonance with the magnetic anisotropy field as the natural resonance mechanism plays a dominant role for complex permeability at a high frequency.22 Besides, the shape anisotropy of nanoflakes and needle-like nanowhiskers would lead to high natural resonance frequency and high permeability.
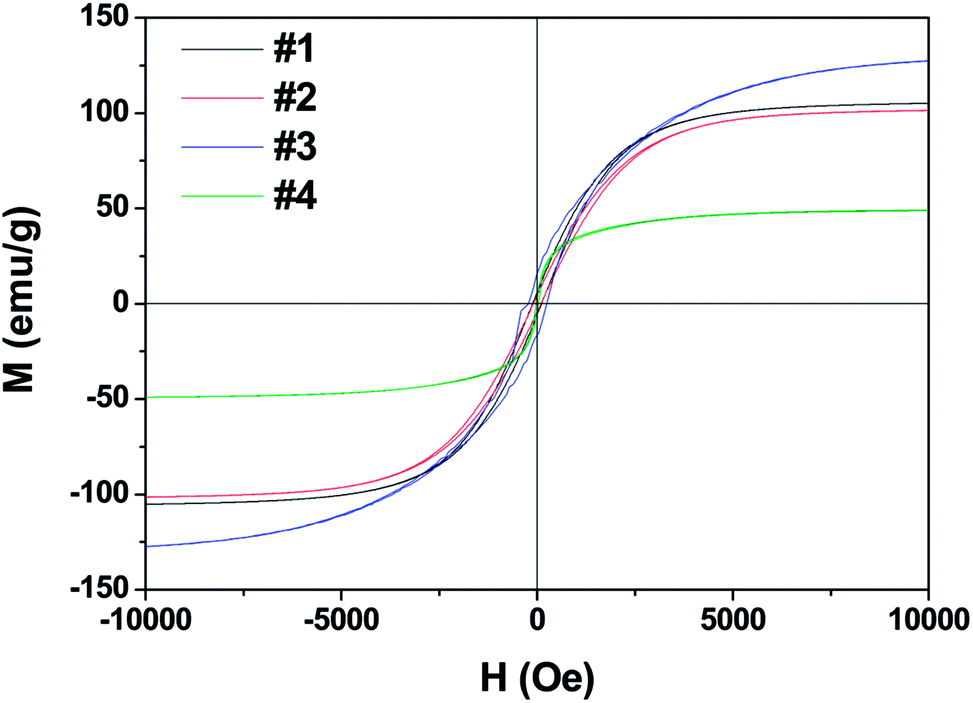 | ||
| Fig. 3 M–H hysteresis loops of samples at room temperature. | ||
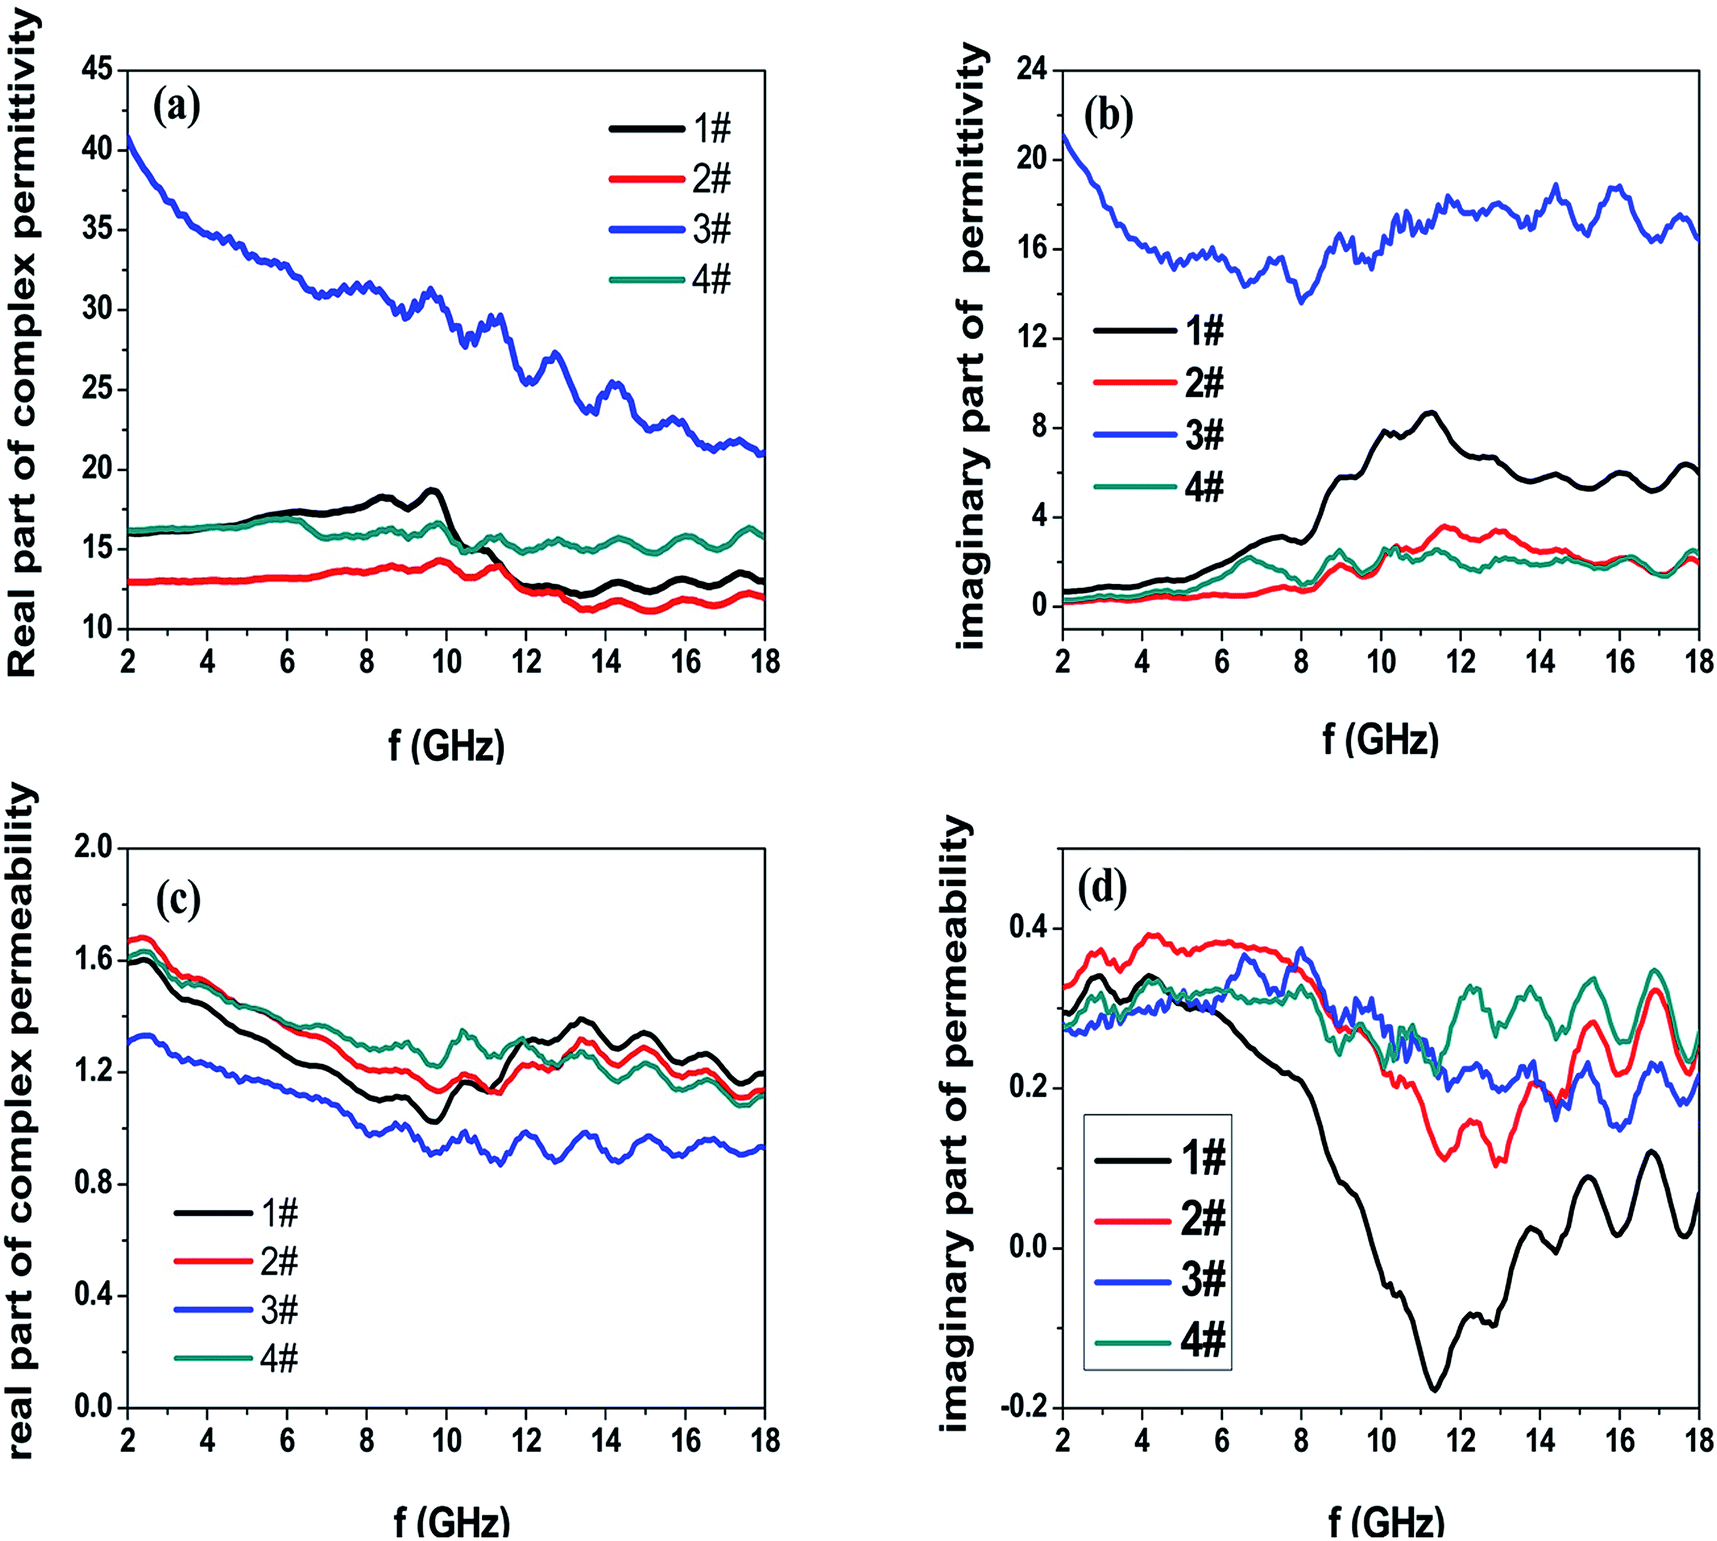 | ||
| Fig. 4 Frequency dependence of (a) real and (b) imaginary parts of complex permittivity and (c) real and (d) imaginary parts of complex permeability for the as-prepared powder-wax composites. | ||
To distinguish the dipole moment resonance and interface polarization in the range of 2–18 GHz, the Cole–Cole curve of ε′′ vs. ε′ is presented in Fig. 5. According to the Debye relaxation theory,9,23,24 each semicircle in the Cole–Cole curve represents one Debye relaxation process. Fig. 5a and b show several Cole–Cole semicircles and a minority of small circles for samples #1 and #2, indicating multiple polarization processes. It is worth noting that the number of circles in the curve of sample #2 is larger than those in the curve of sample #1, showing a much more polarization relaxation process. This result might be caused by the defects in sample #2. Sample #3 exhibits one or two irregular semicircles in the Cole–Cole curve (Fig. 5c) due to the low surface area of the chain-like microsphere structure. Meanwhile, the high complex permittivity values of sample 3 might be attributed to the intrinsic electric dipole moment polarization owing to the chain-like structure. For sample #4, an interconnection between circles and semicircles is observed in its Cole–Cole curve (Fig. 5d), showing multiple relaxation processes including interface polarization and dipole moment polarization caused by the heterogeneous Co/Ni nanocrystalline structure.
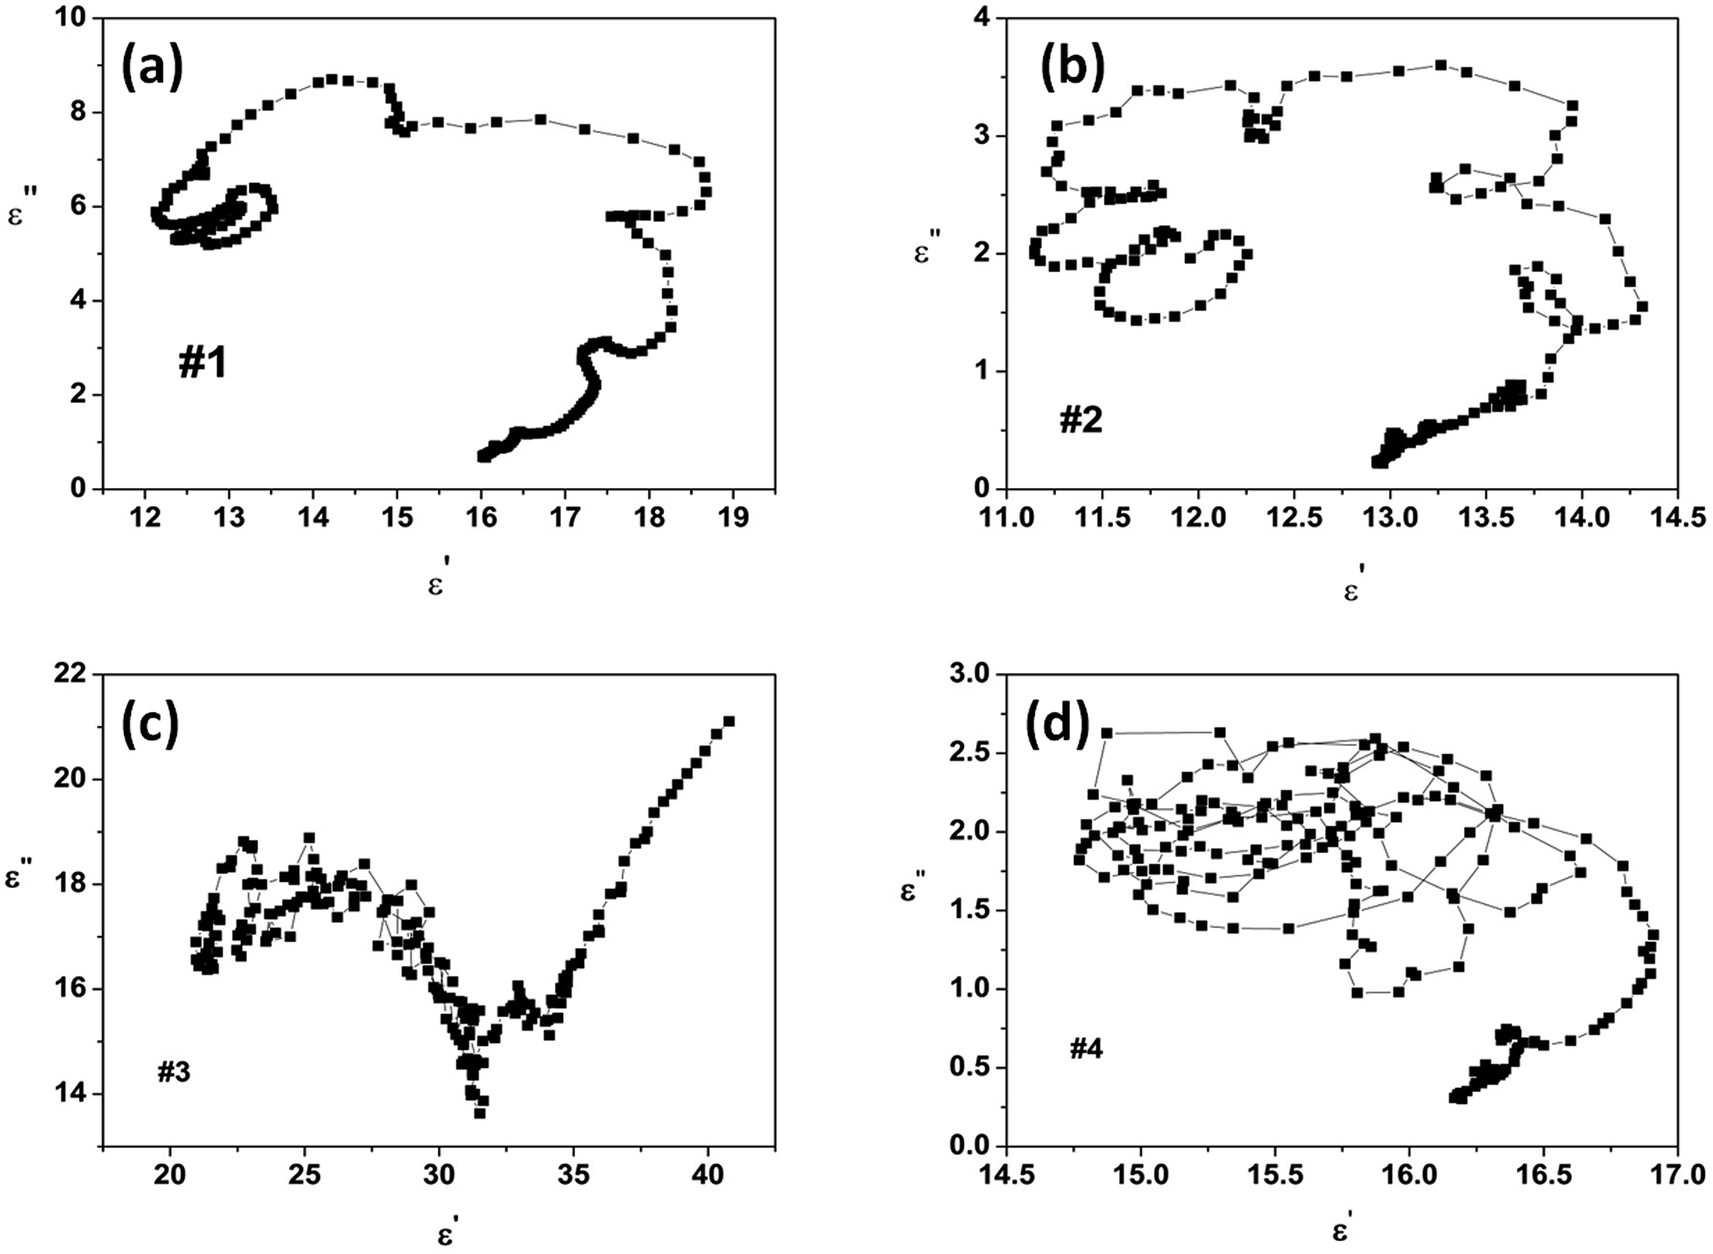 | ||
| Fig. 5 Cole–Cole curves of (a) sample #1, (b) sample #2, (c) sample #3 and (d) sample #4. | ||
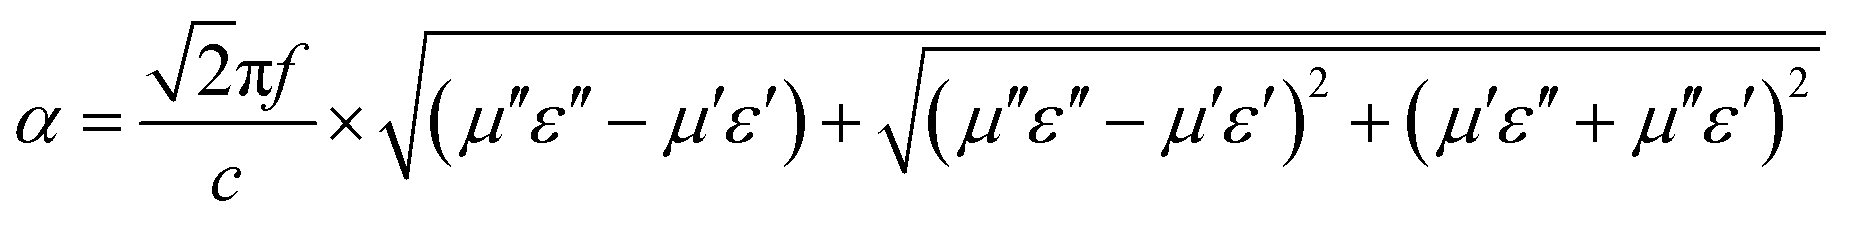
The dielectric loss factor (tanδε = ε′′/ε′), magnetic loss factor (tanδμ = μ′′/μ′) and relative impedance (Z = (μ/ε)1/2) are all important parameters to evaluate the absorption abilities of microwave absorbers.25,26 In addition, the attenuation constant α can be expressed as follows:27,28
 | (1) |
 | ||
| Fig. 6 (a) Dielectric loss factors, (b) magnetic loss factors and (c) attenuation constant of the as-prepared powder-wax composites. | ||
 | ||
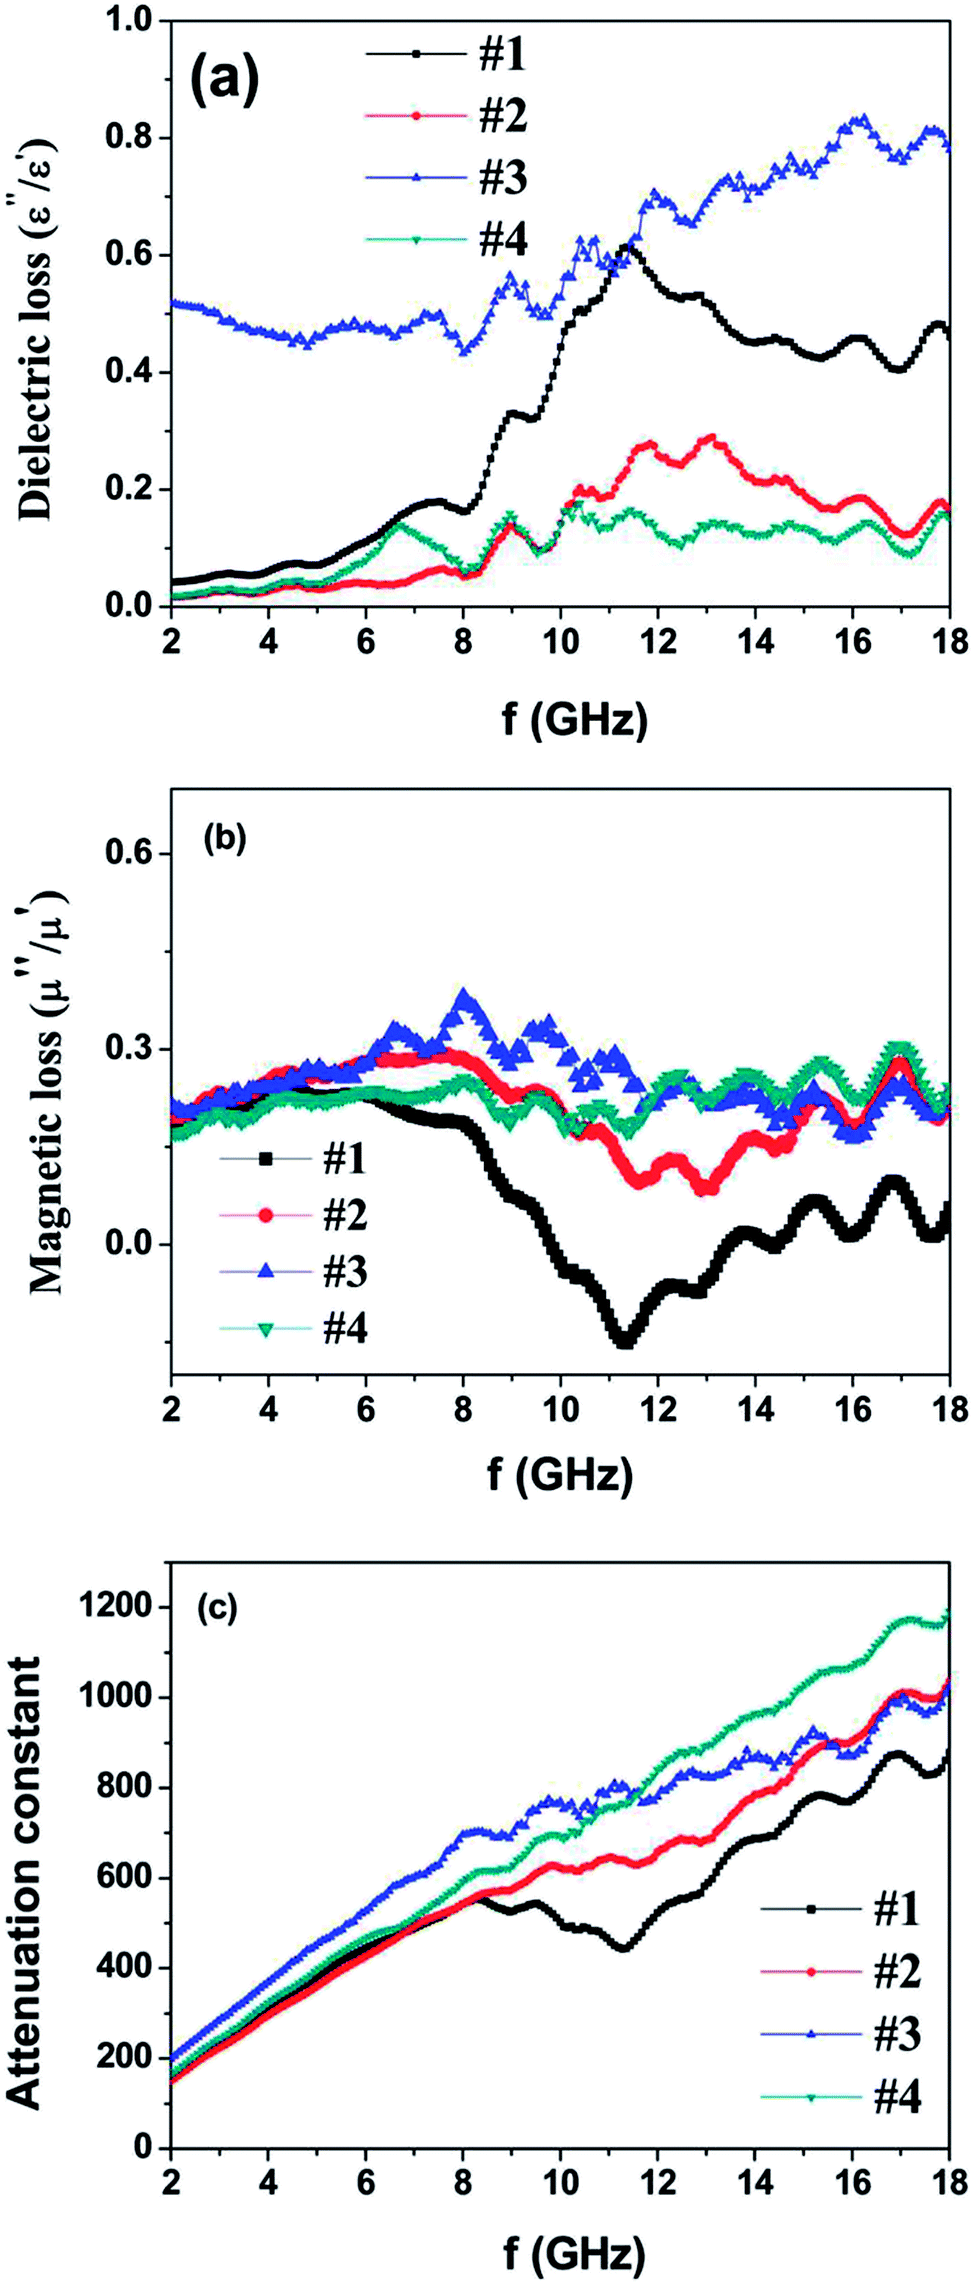
| Fig. 7 Microwave reflection losses of the powders/wax composite coating. (a) Co67Ni33 alloy microspheres of sample #1, (b) Co67Ni33 alloy microspheres of sample #2, (c) chain-like assemblies of sample #3 and (d) the heterogeneous Co/Ni nanocrystalline of sample #4. | ||
Fig. 7 shows the calculated reflection loss (RL) of the as-prepared powder embedded in a wax (60 wt% powder) coating on the metal-backed substrate with different coating thicknesses. Sample #1 exhibits the maximum RL value of −41 dB at 6.48 GHz with the thickness of 2.5 mm and the bandwidth (RL of less than −10 dB) of 2 GHz; moreover, as the coating thickness decreases to 2 mm and 1.5 mm, the absorption peak shifts to 8.32 GHz and 12.48 GHz with the corresponding maximum RL values of −26.2 dB and −22 dB. Sample #2 exhibits the maximum RL value of −25.3 dB at 13.28 GHz with the thickness of 1.5 mm and the bandwidth covering the 11.28–15.44 GHz range. When the coating thickness increases to 2 mm, the RL peak moves to the position at 9.12 GHz with a maximum RL value of −26.2 dB and the bandwidth covers the 7.84–10.88 GHz range. Sample #3 presents poor reflection loss in the 2–18 GHz range, which can be attributed to the poor impedance matching because its permittivity is much larger than its permeability. However, Sample #4 presents excellent microwave absorption properties in the Ku-band (12–18 GHz) at the coating thickness of 1 mm; the maximum RL value reaches −33 dB at 17.6 GHz and the bandwidth covers the 15.04–18.00 GHz range. As the coating thickness increases to 1.5 mm, the RL peak shifts to the position at 11.12 GHz with the maximum RL value of −26.3 dB and the bandwidth covers the 9.8–12.88 GHz range. When the coating thickness is further increased to 2 mm and 2.5 mm, the microwave absorption peak shifts to a low frequency position. The excellent high-frequency microwave absorption of the heterogeneous Co/Ni nanocrystalline in the Ku-band (12–18 GHz) can be ascribed to the relatively high permeability and optimal impedance matching.
4. Conclusions
CoNi microspheres with different diameters and heterogeneous Co/Ni nanocrystallines were synthesized via changing hydrothermal reaction parameters. Our CoNi microsphere sample with an average diameter of about 1 μm exhibited excellent microwave absorption abilities in the C-band (4–8 GHz) and X-band (8–11.5 GHz) with different coating thicknesses. However, the sample of chain-like assemblies from CoNi microspheres with the diameter above 2 μm presented poor microwave absorption in the 2–18 GHz range, which can be ascribed to poor impedance matching because its permittivity is much higher than its permeability. The heterogeneous Co/Ni nanocrystalline sample exhibited the maximum RL value of −33 dB at 17.6 GHz with a coating thickness of 1 mm and the bandwidth covered the 15.04–18 GHz range. Moreover, its excellent microwave absorption properties in the Ku-band (12–18 GHz) could be attributed to the relatively high permeability and optimal impedance matching. All in all, increasing the complex permeability values and optimizing impedance matching are very beneficial for improving the microwave absorption of magnetic microwave absorbers.Conflicts of interest
There are no conflicts to declare.Acknowledgements
This work was partly supported by the Anhui Provincial Natural Science Fund (No. 1708085ME123 and 1508085MF136). Microwave absorption properties were measured on Agilent E5071C vector network analyzer by School of Chemistry and Chemical Engineering, Anhui University.References
- N. Li, C. W. Hu and M. H. Cao, Phys. Chem. Chem. Phys., 2013, 15, 7685–7693 RSC.
- Y. Yang, C. L. Xu, Y. X. Xia, T. Wang and F. S. Li, J. Alloys Compd., 2010, 493, 549–552 CrossRef CAS.
- C. Feng, X. G. Liu, Y. P. Sun, C. G. Jin and Y. H. Lv, RSC Adv., 2014, 4, 22710–22715 RSC.
- G. W. Wang, X. L. Li, P. Wang, J. M. Zhang, D. Wang, L. Qiao, T. Wang and F. S. Li, J. Magn. Magn. Mater., 2018, 456, 92 CrossRef CAS.
- H. L. Lv, G. B. Ji, M. Wang, C. M. Shang, H. Q. Zhang and Y. W. Du, J. Alloys Compd., 2014, 615, 1037 CrossRef CAS.
- S. F. Zhou, Q. X. Zhang, H. Liu, X. Gong and J. Huang, Mater. Chem. Phys., 2012, 134, 224 CrossRef CAS.
- S. L. Yan, L. Zhen, C. Y. Xu, J. T. Jiang, W. Z. Shao and J. K. Tang, J. Magn. Magn. Mater., 2011, 323, 515 CrossRef CAS.
- B. Zhao, L. Y. Liang, J. S. Deng, Z. Y. Bai, J. W. Liu, X. Q. Guo, K. Gao, W. H. Guo and R. Zhang, CrystEngComm, 2017, 19, 6579 RSC.
- S. Q. Jiao, M. Z. Wu, X. X. Xu, H. B. Hu, Z. M. Bai, P. Dai, T. T. Jiang, H. Bi and G. Li, Mater. Res. Bull., 2018, 108, 89 CrossRef CAS.
- N. Zhang, Y. Huang, M. Zong, X. Ding, S. P. Li and M. Y. Wang, Chem. Eng. J., 2017, 308, 214 CrossRef CAS.
- N. Zhang, Y. Huang and M. Y. Wang, J. Colloid Interface Sci., 2018, 530, 212 CrossRef CAS PubMed.
- B. Zhao, J. S. Deng, L. Y. Liang, C. X. Zuo, Z. Y. Bai, X. Q. Guo and R. Zhang, CrystEngComm, 2017, 19, 6095 RSC.
- N. Zhang, Y. Huang, X. D. Liu and M. Y. Wang, Composites, Part A, 2018, 115, 283 CrossRef CAS.
- X. Jian, X. Y. Xiao, L. J. Deng, W. Tian, X. Wang, N. Mahmood and S. X. Dou, ACS Appl. Mater. Interfaces, 2018, 10, 9369 CrossRef CAS PubMed.
- X. Y. Zhang, W. L. Gu and E. K. Wang, J. Mater. Chem. A, 2017, 5, 982 RSC.
- M. J. Hu, B. Lin and S. H. Yu, Nano Res., 2008, 1, 303 CrossRef CAS.
- M. Wang, Z. Z. Wang, P. H. Wang, Y. L. Liao and H. Bi, J. Magn. Magn. Mater., 2017, 425, 25 CrossRef CAS.
- G. Viau, F. Ravel, O. Acher, F. Fievet-Vincent and F. Fievet, J. Magn. Magn. Mater., 1995, 140, 377 CrossRef.
- P. H. Qiu, C. Jensen, N. Charity, R. Towner and C. B. Mao, J. Am. Chem. Soc., 2010, 132, 17724 CrossRef CAS PubMed.
- N. A. M. Barakat, K. A. Khalil, I. H. Mahmoud, M. A. Kanjwal, F. A. Sheikh and H. Y. Kim, J. Phys. Chem. C, 2010, 114, 15589 CrossRef CAS.
- X. W. Wei, X. M. Zhou, K. L. Wu and Y. Chen, CrystEngComm, 2011, 13, 1328 RSC.
- J. P. Zou, Z. Z. Wang, M. Q. Yan and H. Bi, J. Phys. D: Appl. Phys., 2014, 47, 275001 CrossRef.
- T. Liu, Y. Pang, M. Zhu and S. Kobayashi, Nanoscale, 2014, 6, 2447 RSC.
- P. C. P. Watts, W. K. Hsu, A. Barnes and B. Chambers, Adv. Mater., 2003, 15, 600 CrossRef CAS.
- M. S. Cao, J. Yang, W. L. Song, D. Q. Zhang, B. Wen, H. B. Jin, Z. L. Hou and J. Yuan, ACS Appl. Mater. Interfaces, 2012, 4, 6949 CrossRef CAS PubMed.
- R. C. Che, L. M. Peng, X. F. Duan, Q. Chen and X. L. Liang, Adv. Mater., 2004, 16, 401 CrossRef CAS.
- J. Xiang, J. Li, X. Zhang, Q. Ye, J. Xu and X. Shen, J. Mater. Chem. A, 2014, 2, 16905 RSC.
- S. L. Wen, Y. Liu, X. C. Zhao, J. W. Cheng and H. Li, Phys. Chem. Chem. Phys., 2014, 16, 18333 RSC.
| This journal is © The Royal Society of Chemistry 2019 |