 Open Access Article
Modelling the formation of porous organic gels – how structural properties depend on growth conditions
Martin Prostredny ,
Ashleigh Fletcher and
Paul Mulheran
 *
*
Department of Chemical and Process Engineering, University of Strathclyde, Glasgow G1 1XJ, UK. E-mail: paul.mulheran@strath.ac.uk; Tel: +44 (0)141 548 2385
First published on 27th June 2019
Abstract
There has been significant research interest invested into the study of the formation and properties of porous organic materials, due to their widespread applications. However, present models in the literature do not fully explain the observations made for these systems, therefore, this work presents a model developed to fully capture growth from the monomeric species present in the initial stages of the gelation composition. In this work, we employ a two-dimensional lattice-based kinetic Monte Carlo model to investigate how growth processes impact the structural properties of model gels. Experimentally, gel growth is primarily controlled through catalyst concentration, which determines the density of species that are activated for rapid growth, and solids concentration; our model captures both of these dependencies. Increasing both solids content and percentage of activated monomers leads to a higher ratio of closed porosity, and higher values of accessible surface area with increasing level of activation. The generated structures are analysed for their fractal properties using a correlation dimension. Increasing both solids content and percentage of activated species leads to an increase in correlation dimension, which plateaus at a value of 2, independent of catalyst concentration, suggesting little structural change at high solid loadings, over 50%. The Hurst exponent of a random walker diffusing in the accessible pores shows the opposite trend, varying from ½ for unconstrained diffusion and reducing to ⅓ for diffusion through the pore network at the threshold of percolation. These characteristics support visual observations of increasing complexity and tortuosity of pore structures in the model cluster structures. The implications of these results, for the design of porous structures tailored to particular applications, are discussed.
1 Introduction
Porous organic materials have been studied extensively, particularly due to their applications in many fields such as thermal insulation,1,2 porous electrode materials3,4 and adsorbents.5,6 Resorcinol-formaldehyde (RF) gels are one type of these materials, providing the option, for these materials, to use them either in their organic dried7,8 or electrically conductive carbonized forms.3,4,6 We have previously studied the RF gel manufacturing procedure9 in order to better understand the underlying processes that occur during the gelation of these materials, investigating the materials in their dried organic form to preserve the structure created during the gelation process.The initial stages of RF gelation consist of monomer and cluster formation and their subsequent growth into larger, more complex structures.10 The process is pH sensitive with basic synthesis routes being more commonly used in the literature.11,12 The catalyst is usually a weak base in the form of an inorganic hydrolysing salt, which allows adjustment of the solution pH with the most common example being sodium carbonate (Na2CO3). Under basic conditions, resorcinol forms anions in solution that react with formaldehyde, creating monomers that undergo successive condensation reactions resulting in cluster growth and aggregation.10 The process of hydrogen abstraction from neutral resorcinol molecules is notably faster than the formation and growth of clusters, as previously observed by NMR,13 which was taken into account when developing the cluster growth and aggregation model presented here.
Two potential formation pathways for RF gels have been proposed in the literature: microphase separation14 and colloidal aggregation.15 However, it seems that both options represent two extreme views of the same complex process, involving the growth and aggregation of primary spherical particles, leading to analogous final gel structures.16 In this work, a model pathway resembling colloidal aggregation is developed, due to its prevalence in the literature.17–22
Studies have previously focused on the generation of porous model gel structures that could be compared to those obtained experimentally. Early works by Meakin23 and Kolb et al.24 introduced a two-dimensional lattice model of diffusion-limited cluster–cluster aggregation. These models were developed with colloidal particle aggregation in mind, without the primary particles changing size, such as for agglomeration of metal or polymeric particle sols. Some other works included reordering of the initially formed structures to represent some of the patterns observed in silica gel materials.25 However, the bonds in silica gels are more likely to undergo hydrolysis, especially under acidic conditions, than their organic counterparts. Here, the mechanism for base-catalysed RF gels is considered, where hydrolysis of the formed ether bonds is not favoured, therefore not leading to structural reorganisation at the later stages of gelation.
Gavalda et al.26,27 modelled carbon aerogel structures using random close-packed, slightly overlapping, spheres with mesopores between the particles, and micropores incorporated within the particles. However, all particles were assumed to be equal in size, which is not always the case in a real system, where particles can vary over a range of sizes. Work by Morales-Flórez et al.28,29 used an algorithm with randomly-packed spheres in several hierarchically-ordered levels in order to simulate silica (SiO2) and titania (TiO2) porous materials. Even though the final structures obtained vary in shape, the primary spherical particles used to form the final clusters are all identical in size. A molecular dynamics study by Ferreiro-Rangel and Gelb30 used a coarse-grained model for silica aerogel simulation; although again, using a uniform size of primary particles, which were allowed to diffuse and bond together to form the final structure. These examples from the literature show a trend of using monodisperse particles in order to model structures for porous xerogel and aerogel materials, which might not reflect all of the characteristics of these materials, since the experimentally obtained aero- and xerogels are not formed by particles of identical size.31 As far as we are aware, no study prior to this has tried to replicate the formation of gel structures starting from monomeric species, through nucleation and growth of primary particles, to the final aggregated state.
Both experimentally and via simulation, porous materials are usually analysed for their textural properties, such as accessible surface area, pore volume, and pore size distribution. However, it has been reported previously that aerogel and xerogel materials tend to exhibit structures with fractal characteristics,32–35 even though some early studies suggested a lack of fractal properties of RF gels.14 Fractal properties can add useful information about their structure and therefore, fractal analysis of porous materials has been performed, in the past, using both simulations30,36 and experiments, through techniques including dynamic light scattering33 and small angle X-ray scattering,32,33,35 adding more information about the structure of these materials.
A number of methods can be used to characterize a structure in terms of a fractal dimension, including correlation dimension (DC), box-counting dimension (DB), and information dimension (DI). This work uses the correlation dimension, which is related to the other dimensions through DC ≤ DI ≤ DB.37
The Hurst exponent is related to fractal dimension38 and can be used to describe the persistence of a time series.39 If one considers a random walker on a two-dimensional lattice; a particle exhibiting Brownian motion on an empty lattice, with no obstacles, has a Hurst exponent value of H = ½. A random walker with a lower value H < ½ is described as antipersistent, which means that it is more likely to remain closer to the origin than the freely diffusing particle. A value of H > ½ is attributed to persistent walkers, meaning they are more likely to leave the origin with a smoother, less rugged trace. If one now considers a random walker on a plane with obstacles, its trace will become more antipersistent, tending to confine it to a smaller area. As the obstacle structures become more complex and the voids more tortuous, thereby restricting the movement of the walker, the value of H might be expected to approach ∼⅓, the value found at the percolation threshold.40
In this work, a cluster growth and aggregation model, using kinetic Monte Carlo simulations, is presented. The model aims to mimic the growth processes deduced from experimental gel formation, and in particular moves away from the dependence on uniform sphere size found in previous models,26–30 while adding cluster growth and concentration of activated species compared to previous work developed for similar systems.23,24 We develop a two-dimensional model, which allows visual understanding of the structure development, as well as evaluation of large system sizes, to explore the fractal properties. The generated structures are subsequently analysed for accessible pore space and accessible surface area, along with their fractal properties, using the correlation dimensions of the structures, and Hurst exponent of random walkers diffusing in the resulting accessible pore structures. These characteristics will provide insight into the interdependence of the structural properties of these materials and their synthesis conditions, such as concentrations of catalyst and solids, paving the way for the bespoke design of porous gels tailored to their applications.
2 Cluster growth and aggregation model
2.1 Background
Our model, describing the formation, growth and aggregation of resorcinol-formaldehyde (RF) clusters, is developed on the basis of experimental evidence found in the literature. A general understanding of the dependence of RF gel materials on some of the processing parameters was obtained by performing a related experimental study9 and reviewing our previous experimental work.10,41,42 The catalyst salt present in the solution activates a proportion of the resorcinol molecules43 to form anions, which are more reactive in the addition reaction with formaldehyde. These activated species act as seeds for subsequent growth of the spherical particles that are observed by electron microscopy of RF gels.15,44–46Cluster formation and diffusion in the RF solution has been observed visually by Alshrah et al.35 As the clusters grow within the reaction solution, they can adhere to other clusters, thus forming larger aggregates, with these processes more pronounced at elevated temperatures.10 This aggregation has been noted in the work by Pol et al.,47 where RF resin synthesis has been assisted by ultrasound, forming individual spherical particles in solution within a short time frame. In a control experiment in the same work, performed as a stirred emulsion polymerization without sonication, small aggregates of RF particles were observed, again via scanning electron microscopy, after a longer gelation time, which is required for the reaction to complete without sonication. The particles prepared with ultrasound formed relatively quickly, leading to a small fraction of particles adhering to each other. However, the longer reaction times required during emulsion polymerization result in greater RF cluster adherence, leading to small aggregates. Larger agglomerates were not formed due to the agitation from stirring, which prevents the particles from contacting for a sufficiently long enough time to form cross-links.
During the RF monolith manufacturing processes, there is no agitation of the reacting solution allowing the formation of three-dimensional particle networks, starting from individual clusters that create smaller aggregates, which generate the final structure spanning the reaction space.9 The examples from the literature discussed here are not exhaustive but provide additional information about the generation of final structures in RF gels, and were used as a basis for the developed model. It should be noted that even though the model was based on experimental data for RF gels, due to the amount of data available in the literature and our previous experimental experience, it could be transferable to other materials, for which the structure is created via a similar route as the one described here for RF gels.
2.2 Algorithm
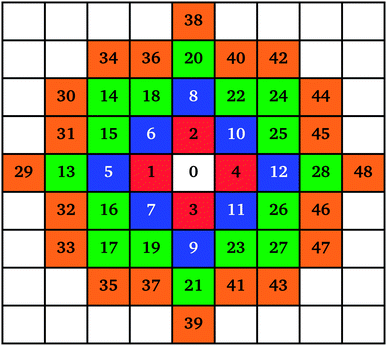
For this purpose, in-house software was developed with GNU Fortran compiler and GNU parallel tool48 using a lattice based kinetic Monte Carlo method (see Chatterjee and Vlachos49 for a review of the kinetic Monte Carlo method). A two-dimensional lattice, with periodic boundaries, was initially populated by monomers, in order to mimic total solids concentration (SC), which in this case represents the fraction of occupied lattice sites. Values of SC used in this work range from 10 to 50%, moving in 10% increments. Higher values of SC, up to 90%, were explored; however, most of the porosity above 50% was observed as closed and not percolated in two dimensions, therefore, only structures up to 50% SC are considered here. A percentage of the monomers (CC) were ‘activated’ to represent catalyst concentration and corresponding amount of activated monomers (resorcinol anions). These activated species acted as seeds for cluster nucleation. In this work, CC = 1, 2, and 3% were used, based on the proportion of charged resorcinol molecules discussed in the work of Lin and Ritter.43The monomers, and growing clusters, were allowed to diffuse on the lattice, where the probability of a cluster moving was inversely proportional to its size. When a monomer diffused onto a site occupied by a cluster, it attached to the cluster, resulting in growth. Based on experimental evidence,15,44–46 as discussed above, ‘circular’ islands grew on the lattice, as illustrated in Fig. 1.
The mechanism of individual cluster growth is depicted in Fig. 1, where the increasing numbers indicate lattice sites for cluster growth with each additional monomer attached to that cluster. The colours used in Fig. 1 represent layers of monomers being attached to a cluster; this way, the growing clusters retain a compact, approximately circular, shape rather than the branched shape that would result from a diffusion-limited aggregation mechanism, keeping the model structures closer to those observed experimentally. If a site was already occupied by another cluster, the next available site in the list was used.
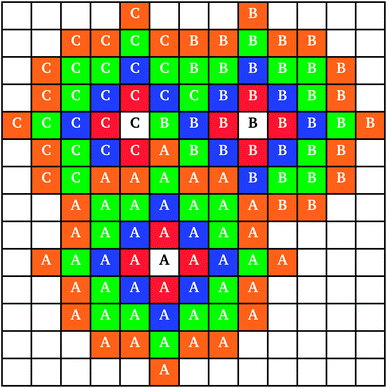
When two clusters touched, they became linked into a larger cluster aggregate; the resulting cluster aggregates moved across the lattice together, but the individual clusters continued to grow independently. An example of individual cluster growth in an aggregate, formed by three clusters, is shown in Fig. 2. It can be seen that while cluster A (Fig. 2) retains an approximately circular shape, cluster C grows around clusters A and B, keeping an outer circular arc shape where possible. Cluster growth and aggregation is illustrated in Fig. 3, where three clusters (black) gradually grow, on a lattice with periodic boundaries, consuming the monomers (red) around them. As can be seen from Fig. 3, monomers and clusters diffuse freely on the lattice with monomers being gradually depleted by the growing clusters.
 | ||
| Fig. 3 Cluster growth and diffusion mechanism example. Positions occupied by cluster points shown in black, and by monomers in red. | ||
To summarise, the algorithm is based on the following steps:
(1) Populate lattice with cluster seeds and monomers.
(2) Randomly select a species to diffuse based on the relative rate of species diffusion using the kinetic Monte Carlo algorithm; diffusion probability scales inversely with species size.
(3) Attempt to diffuse the selected species in a random direction by one lattice site:
(a) If a cluster was selected in step 2, move all clusters within the same aggregate together and, if another cluster is adjacent at the new position, merge the two clusters/aggregates.
(b) If a monomer was selected in step 2, and if the new site is occupied by a cluster, attach the monomer to the cluster and increase the cluster size; do not accept the move if the new site is already occupied by another monomer.
(4) If there is more than one cluster aggregate and any monomers remaining in the simulation, go back to step 2 and repeat until there are no monomers and only one cluster aggregate remaining.
2.3 Simulated structures
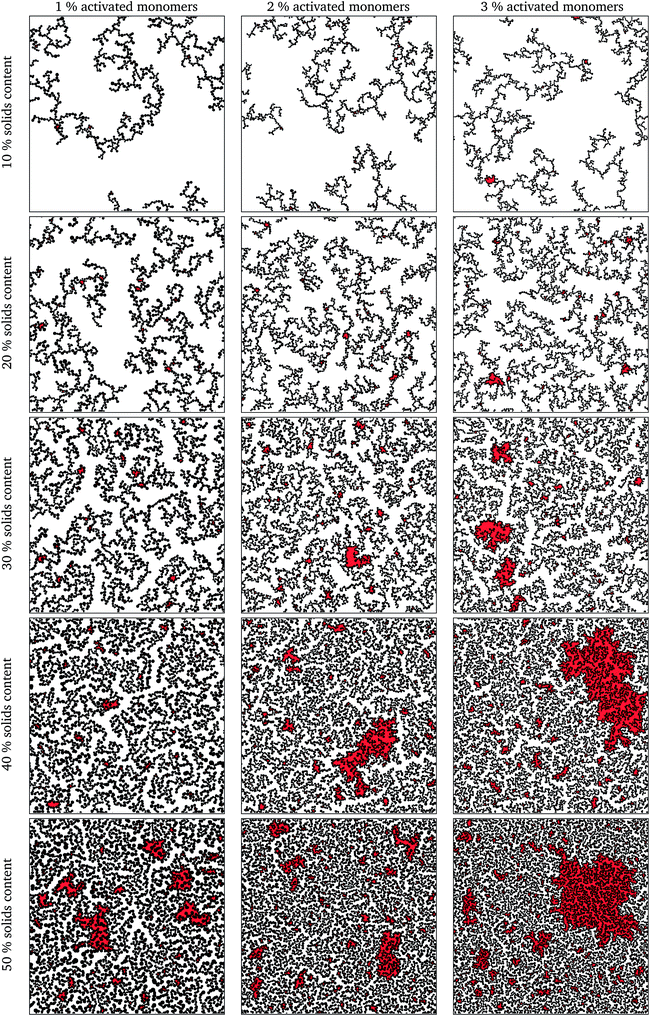
The simulation was deemed to be finished when there was only one spanning cluster aggregate remaining in the system. Selected final structures are shown in Fig. 4 in order to show the effect of solids content and percentage of activated monomers on simulated structures. Increasing the percentage of activated monomers in the initial simulation results in the clusters in the final structure being smaller in size, thereby increasing their number. This results in a more branched structure, which leads to more interconnected networks spanning the reaction space, making the whole structure more interdigitated. By increasing the solids content, the grown structures are more densely packed, however, as previously discussed, they retain a percolated porous structure up to 50% solids content. At higher solids contents (above 50%), the structures end up being too dense and most of the pores are closed in two dimensions, and only the pores that might be on the structure surface would be externally accessible. It is worth noting that while these generated structures might be visualised as two-dimensional slices of a three-dimensional material, in reality some of the closed pores present in the two-dimensional structure might well be open pores in a three-dimensional structure.It can be seen, from Fig. 4, that the structures created using lower solids contents, e.g. 10 and 20%, contain pores that are quite open and generally exhibit wide necks, resulting in very few bottle-neck type pores. Conversely, structures with higher solids loading, e.g. 40 and 50%, exhibit a complex series of interconnected pores with a higher fraction of constricted and closed pores.
Due to the random nature of kinetic Monte Carlo simulations, a series of 10 runs was performed for each set of conditions (solids content and percentage of activated monomers) by using a different seed for the Fortran built-in random number generator at the beginning of the simulation. Fig. 4 shows only the first run for each set of the presented model parameters, these being wholly representative of the trends for each set of parameters, with inaccessible pore spaces highlighted in red.
In the following we present data analyses from the 10 independent runs. Since each is performed on a 1000 × 1000 lattice, we obtain statistically significant results for how structural features vary with SC and CC.
3 Textural characterization
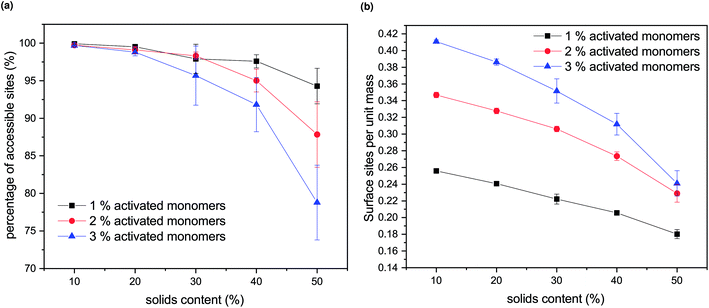
Experimentally, porous materials are usually characterized by various techniques, such as gas sorption, for their textural properties.11,44,46,50,51 Accessible surface area and accessible pore volume are important characteristics of these materials and have a direct impact on their applications.The generated structures, as presented in Fig. 4, were analysed for accessible pore area and number of accessible surface sites. Firstly, the area of the percolating network of pores was identified for all the structures, represented in white in Fig. 4. The number of accessible lattice sites was compared to the total number of unoccupied lattice sites for each generated structure and these ratios are shown in Fig. 5a. Increasing both SC and CC results in a qualitatively observable decrease in the ratio of accessible sites (Fig. 4), while quantitatively it is reflected in Fig. 5a and is a result of increased closed porosity within these structures.
The accessible surface areas of the pores, scaled to the gel mass, are shown in Fig. 5b. It can be seen that the surface area decreases with increasing solids concentrations (SC) and increases with increasing catalyst concentration (CC). At higher values of SC, the decrease is more pronounced due to the increase in closed porosity, as discussed above. Higher values of CC lead to higher numbers of accessible surface sites, with the difference more pronounced at lower values of SC.
From previous experimental work within our group, the effect of solids content on the final RF xerogel structure was observed as insignificant.9 However, it needs to be taken into account that the experimentally analysed samples are xerogels, which are affected by shrinkage during the drying process. Hydrogels with lower solids content will initially contain larger and more open pores; however, their solid network structure is relatively weak, resulting in significant shrinkage during drying. On the other hand, even though hydrogels with higher solids contents initially exhibit smaller pore voids, their gel structures are much stronger; thus, they are better able to withstand the forces exerted onto the pore walls during drying. Another factor to consider is that the range of solids content used in previous experiments was below 40%, and the change in accessible surface sites is fairly small in this region, compared to higher values of SC.
We note that the trends observed here for the effect of amount of activated species (CC) on both accessible pore volume and accessible surface sites agree with experimental trends for catalyst concentration, as presented in ref. 9. Increasing both solids content and catalyst concentration for RF xerogels results in higher values of pore volume, thus, lower amount of closed porosity. Accessible surface area of RF xerogels tends to increase with increasing catalyst concentration, while the effect of solids contents is less pronounced,9 as discussed above.
4 Fractal analysis
As mentioned in the introduction, fractal properties of aerogel and xerogel materials have been studied both experimentally32–35 and using simulations,30,36 providing additional information about the nature of porous materials. Therefore, the generated cluster structures were analysed for correlation dimension (Section 4.1) to gain more information about the structure complexity. The Hurst exponent values were calculated for the accessible pore spaces using diffusion of a random Brownian walker (Section 4.2).4.1 Correlation dimension
Correlation dimensions were calculated for the simulated structures, as outlined above, using the relationship proposed by Grassberger.52 First, the correlation sum (Cr) was calculated using:
 | (1) |
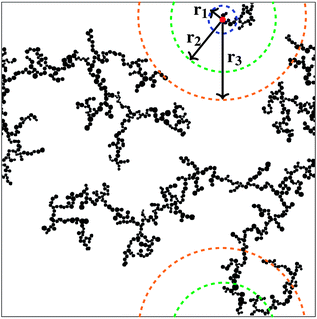
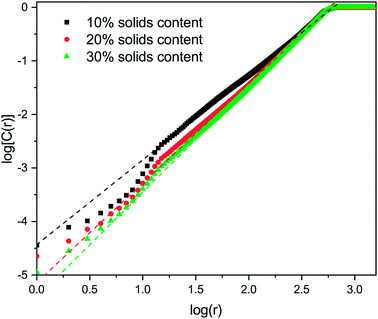
The correlation dimension of the system is obtained using a log–log scale plot of correlation sum vs. radius. It is known that for a fractal set, there are lower and upper limits for evaluating fractal properties.53 For small values of r (log(r) below 1), there are effects due to the discrete nature of the lattice, while the plateau at large r (log(r) around 3 and above) is due to the large-scale effects of the periodic boundary conditions mentioned above (recall the lattice size is 1000 × 1000). Between these limits is the scaling region, the slope of which is equal to the correlation dimension and these regions were used to evaluate the correlation dimension values. Example plots for structures with 1% activated monomers and solids content 10, 20, and 30%, are shown in Fig. 7.
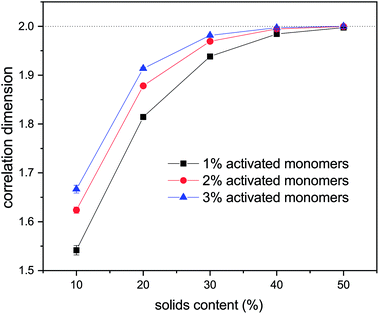
Values of correlation dimensions for the solids contents and percentages of activated monomers studied here are shown in Fig. 8. The values obtained vary in the range ∼1.5 to ∼2.0, increasing with increasing values of SC and CC. The lower limit is in line with expectations for cluster–cluster aggregation in dilute systems54 while the upper limit is expected for dense media in two dimensions. This means that the aggregates fill space more completely as these parameters increase, as expected. At higher solids contents (50% and above), the correlation dimension plateaus at a value of 2.0 for all percentages of activated monomers. The most substantial increase in correlation dimension can be observed between 10 and 20% solids content, where, as can be seen in Fig. 4, the structures differ most significantly even visually.
An experimental study by Huber et al.55 used dynamic light scattering measurements to quantify the fractal dimensions of particles formed during RF gelation. They observed an increase in fractal dimension with catalyst concentration, which agrees with the trend observed here.
4.2 Hurst exponent
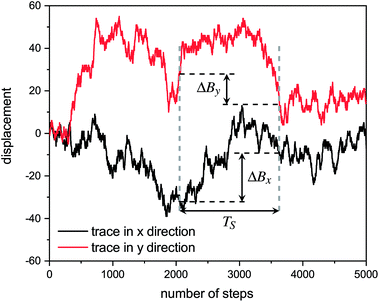
Hurst exponent values of accessible pores within the cluster structures, obtained using the model presented here, were calculated using a random walker with only percolated porous structures considered. The inaccessible pores excluded from analysis are coloured red in Fig. 4. As mentioned above, and as seen from Fig. 5a, increasing both values of SC and CC leads to more closed porosity in the system, which will have an effect on the values of the Hurst exponent as well.For each simulation, the random walker was placed within the percolated pore structure and allowed to freely diffuse for 10 million steps (ten times the number of lattice sites). This was repeated for 1000 randomly distributed accessible positions on the lattice. Random walker traces in both x and y directions were then analysed for average displacement from the origin with varying time window size. This is shown in Fig. 9, where traces of a random walker, in both x and y directions, are shown along with absolute displacements in both directions (ΔBx and ΔBy) for a selected time window (TS). The time window slides along the time axis, and an average value of displacement in both directions is calculated for varying size of time windows. For a random walker, there is a relationship between the average displacement  and time window size (TS):
 | (2) |
 versus log(TS) provides the value of the Hurst exponent (H). In this work, 11 time window sizes were used, starting at 100 steps and increasing exponentially up to 102
![[thin space (1/6-em)]](https://www.rsc.org/images/entities/char_2009.gif) 400 steps. It is important that the highest time window size is significantly smaller than the total number of steps, to ensure sufficient points for the average displacement calculation, as the time window slides along the time axis.
400 steps. It is important that the highest time window size is significantly smaller than the total number of steps, to ensure sufficient points for the average displacement calculation, as the time window slides along the time axis.
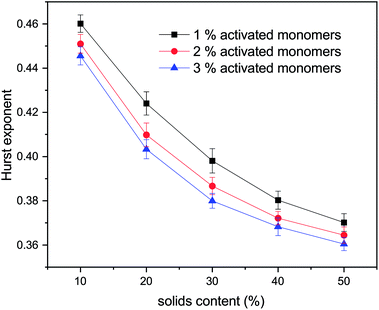
The values for the Hurst exponent, for a random walker diffusing in the percolated pore structures described above, are shown in Fig. 10. It can be seen that increasing values of both SC and CC causes a decrease in the Hurst exponent (H) values. As mentioned in the introduction, a random walker diffusing on an empty lattice has a value of H = ½, exhibiting a random Brownian trace in both x and y dimensions. Deviation of the Hurst exponent from the value of ½ towards ⅓ suggests a more anti-persistent character of the walker trace. By increasing solids content, the obstacles encountered by the walker also increase and the pore structure becomes more tortuous with more constricted pores, this limits the free diffusion of the walker, leading to a decrease of its Hurst exponent value.
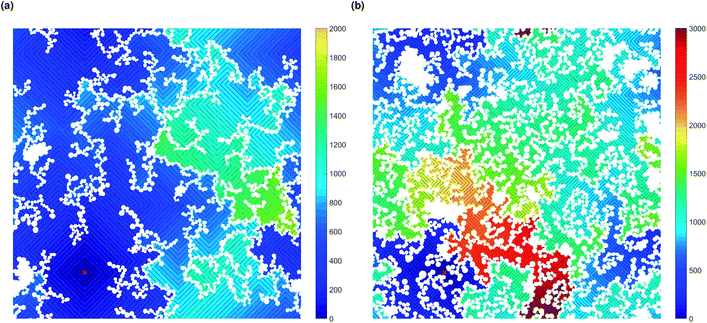
Increased tortuosity of accessible pore structures can be observed in Fig. 11, where cluster structures with two different values of solids content (SC) are presented. For porous materials, tortuosity can be taken as the ratio between diffusivity in the porous medium and in bulk fluid.56 The colours in Fig. 11 represent the number of diffusion steps required to reach various points on the lattice starting from the indicated point. With increased SC, the more constricted pores are increasingly difficult to access, as can be seen by the increased number of steps needed to reach these points. This is then reflected in the value of the Hurst exponent, as mentioned above.
An increase in number of activated sites increases the number of clusters in the structure, causing the structures to spread throughout the reaction space, again leading to a more complex pore structure and a higher ratio of closed porosity, in agreement with the trends observed for correlation dimension of the cluster structures, as discussed above.
5 Discussion
From the above, we believe that our model reproduces well the most important experimental trends for how textural properties depend on the organic gel reactant composition. It should be noted that even though the presented model has been developed with colloidal cluster aggregation mechanism, due to the nature of the model it could represent structures formed via microphase separation mechanism as well. Microphase separation theory suggests that after reaching a critical size, the growing clusters are not soluble in the reaction mixture, resulting in de-mixing. This would, however, not dramatically affect the way the model represents the cluster growth and aggregation beyond the initial cluster size formed by the microphase separation. We will explore the impact of this in future work.With increasing solids content and catalyst concentration, the final observed structures fill space more completely, which is reflected in their fractal properties, expressed here in the form of the correlation dimension for cluster structures and Hurst exponent for diffusion within the accessible pores. It was observed that the correlation dimension increased with both solids content and amount of activated monomers, plateauing at a value of ∼2.0 at 50% solids content, suggesting little structural change at higher solids contents, independent of catalyst concentration. It was also shown that increasing the solids content and percentage of activated monomers led to a decrease in Hurst exponent, which agrees with structures containing smaller and more restricted pores. These structural constrictions, reflected by the values of Hurst exponent, lead to pore voids that are more difficult to access externally, which affects kinetics of diffusional processes in RF gels, such as solvent exchange or gas adsorption. Materials exhibiting lower values of Hurst exponent (more restricted pores), could find uses in applications such as drug delivery systems, where a gradual emptying of the pore voids is preferential to a rapid discharge of substances from a more open pore structure.
The approach taken in this work allows a natural exploration of the range of solids content that is of experimental interest, showing the systematic trends in fractal properties, in contrast to previous models,30 developed for silica materials, where the simulation design does not attempt to follow growth from the earliest stages.
As explained above, this work presents findings using a two-dimensional version of the model developed to explore the structural consequences of the growth conditions. The two-dimensional model has the advantage of clearer visualisation and a more straightforward evaluation of the generated structures, however, we intend to implement the methodology using three dimensions in our future work. This will allow for a better representation of the real materials and provide more direct predictive capabilities, particularly replicating the pore structure found in three-dimensional networks.
Better understanding of RF gel formation can help tailor their properties for particular applications. Due to the wide range of applications for these materials, the required characteristics vary significantly as well. For adsorption we require high accessible surface area with Brownian-like diffusion, indicating low solids concentration with high catalyst concentration. However, for drug release, we might require low catalyst concentration and high solids concentration to reduce the out-diffusion of the drug. Therefore, our work to link the properties of the gel structure to its manufacture paves the way for an intelligent design of porous materials that can be tailored to the application.
6 Conclusions
This work presents a novel approach to modelling resorcinol-formaldehyde gel growth, along with the characterization of the fractal and structural properties of model structures. The cluster growth and aggregation model produces structures that are similar to those observed experimentally. The current version of the model could also capture the gelation of different gelling materials, if they are made by formation and subsequent cross-linking of spherical particles.The model, discussed here, shows that it is possible to correlate essential experimental parameters to structural features of porous organic materials, in particular:
• accessible surface area;
• accessible porosity;
• fractal properties.
Given this, we believe that the model can be used to help engineer materials with textural and structural properties tailored to their intended application.
Conflicts of interest
There are no conflicts to declare.Acknowledgements
Martin Prostredny thanks the University of Strathclyde and the Department of Chemical and Process Engineering for financial support.References
- J. Feng, C. Zhang and J. Feng, Materials letters, 2012, 67, 266–268 CrossRef CAS.
- D. M. Smith, A. Maskara and U. Boes, J. Non-Cryst. Solids, 1998, 225, 254–259 CrossRef CAS.
- H.-H. Jung, S.-W. Hwang, S.-H. Hyun, K.-H. Lee and G.-T. Kim, Desalination, 2007, 216, 377–385 CrossRef CAS.
- J. Li, X. Y. Wang, Q. H. Huang, S. Gamboa and P. J. Sebastian, J. Power Sources, 2006, 158, 784–788 CrossRef CAS.
- Z. Wu, H. Joo and K. Lee, Chem. Eng. J., 2005, 112, 227–236 CrossRef CAS.
- S. Álvarez, R. S. Ribeiro, H. T. Gomes, J. L. Sotelo and J. García, Chem. Eng. Res. Des., 2015, 95, 229–238 CrossRef.
- N. Job, F. Panariello, J. Marien, M. Crine, J.-P. P. Pirard and A. Léonard, J. Non-Cryst. Solids, 2006, 352, 24–34 CrossRef CAS.
- N. Rey-Raap, E. G. Calvo, J. A. Menéndez and A. Arenillas, Microporous Mesoporous Mater., 2017, 244, 50–54 CrossRef CAS.
- M. Prostredný, M. Abduljalil, P. Mulheran and A. Fletcher, Gels, 2018, 4, 36 CrossRef PubMed.
- S. J. Taylor, M. D. Haw, J. Sefcik and A. J. Fletcher, Langmuir, 2014, 30, 10231–10240 CrossRef CAS PubMed.
- R. W. Pekala, J. Mater. Sci., 1989, 24, 3221–3227 CrossRef CAS.
- S. A. Al-Muhtaseb and J. A. Ritter, Adv. Mater., 2003, 15, 101–114 CrossRef CAS.
- K. Z. Gaca, J. A. Parkinson and J. Sefcik, Polymer, 2017, 110, 62–73 CrossRef CAS.
- D. W. Schaefer, R. Pekala and G. Beaucage, J. Non-Cryst. Solids, 1995, 186, 159–167 CrossRef CAS.
- T. Yamamoto, T. Nishimura, T. Suzuki and H. Tamon, J. Non-Cryst. Solids, 2001, 288, 46–55 CrossRef CAS.
- C. J. Gommes and A. P. Roberts, Phys. Rev. E: Stat., Nonlinear, Soft Matter Phys., 2008, 77, 041409 CrossRef PubMed.
- A. Allahbakhsh and A. R. Bahramian, Nanoscale, 2015, 7, 14139–14158 RSC.
- M. Alshrah, M.-P. Tran, P. Gong, H. E. Naguib and C. B. Park, J. Colloid Interface Sci., 2017, 485, 65–74 CrossRef CAS PubMed.
- I. Yang, S.-G. Kim, S. H. Kwon, M.-S. Kim and J. C. Jung, Electrochim. Acta, 2017, 223, 21–30 CrossRef CAS.
- Y. Yan, M. Shi, Y. Wei, C. Zhao, L. Chen, C. Fan, R. Yang and Y. Xu, J. Nanopart. Res., 2018, 20, 260 CrossRef.
- M. Alshrah, H. E. Naguib and C. B. Park, Mater. Des., 2018, 151, 154–163 CrossRef CAS.
- E. Kinnertová and V. Slovák, J. Therm. Anal. Calorim., 2018, 134, 1215–1222 CrossRef.
- P. Meakin, Phys. Rev. Lett., 1983, 51, 1119–1122 CrossRef.
- M. Kolb, R. Botet and R. Jullien, Phys. Rev. Lett., 1983, 51, 1123–1126 CrossRef.
- P. Meakin and R. Jullien, J. Chem. Phys., 1988, 89, 246–250 CrossRef CAS.
- S. Gavalda, K. Kaneko, K. T. Thomson and K. E. Gubbins, Colloids Surf., A, 2001, 187, 531–538 CrossRef.
- S. Gavalda, K. E. Gubbins, Y. Hanzawa, K. Kaneko and K. T. Thomson, Langmuir, 2002, 18, 2141–2151 CrossRef CAS.
- V. Morales-Flórez, N. D. L. Rosa-Fox, M. Piñero and L. Esquivias, J. Sol-Gel Sci. Technol., 2005, 35, 203–210 CrossRef.
- V. Morales-Flórez, M. Piñero, N. de la Rosa-Fox, L. Esquivias, J. A. Anta and J. Primera, J. Non-Cryst. Solids, 2008, 354, 193–198 CrossRef.
- C. A. Ferreiro-Rangel and L. D. Gelb, J. Phys. Chem. B, 2013, 117, 7095–7105 CrossRef CAS PubMed.
- R. W. Pekala, C. T. Alviso, F. M. Kong and S. S. Hulsey, J. Non-Cryst. Solids, 1992, 145, 90–98 CrossRef CAS.
- H. Tamon and H. Ishizaka, J. Colloid Interface Sci., 1998, 206, 577–582 CrossRef CAS PubMed.
- V. A. Emelichev and V. G. Ovchinnikov, Cybernetics, 1985, 21, 216–221 CrossRef.
- C. S. Sharma, M. M. Kulkarni, A. Sharma and M. Madou, Chem. Eng. Sci., 2009, 64, 1536–1543 CrossRef CAS.
- M. Alshrah, L. H. Mark, C. Zhao, H. E. Naguib and C. B. Park, Nanoscale, 2018, 10, 10564–10575 RSC.
- H. S. Ma, J. H. Prévost and G. W. Scherer, Int. J. Solids Struct., 2002, 39, 4605–4614 CrossRef.
- P. Grassberger and I. Procaccia, Phys. D, 1983, 9, 189–208 CrossRef.
- B. B. Mandelbrot, Phys. Scr., 1985, 32, 257–260 CrossRef.
- T. Gneiting and M. Schlather, Soc. Ind. Appl. Math., Rev., 2001, 46, 269–282 Search PubMed.
- D. Stauffer and A. Aharony, Introduction to percolation theory, Taylor & Francis, London, 2nd edn, 1994, p. 181 Search PubMed.
- L. Anderson, PhD thesis, University of Strathclyde, 2013.
- S. J. Taylor, PhD thesis, University of Strathclyde, 2014.
- C. Lin and J. A. Ritter, Carbon, 1997, 35, 1271–1278 CrossRef CAS.
- D. Fairén-Jiménez, F. Carrasco-Marín and C. Moreno-Castilla, Carbon, 2006, 44, 2301–2307 CrossRef.
- T. Yamamoto, T. Nishimura, T. Suzuki and H. Tamon, Drying Technol., 2001, 19, 1319–1333 CrossRef CAS.
- A. Awadallah-F, A. M. Elkhatat and S. A. Al-Muhtaseb, J. Mater. Sci., 2011, 46, 7760–7769 CrossRef CAS.
- V. G. Pol, L. K. Shrestha and K. Ariga, ACS Appl. Mater. Interfaces, 2014, 6, 10649–10655 CrossRef CAS PubMed.
- O. Tange, The USENIX Magazine, 2011, vol. 36, pp. 42–47 Search PubMed.
- A. Chatterjee and D. G. Vlachos, J. Comput.-Aided Mater. Des., 2007, 14, 253–308 CrossRef.
- V. Bock, A. Emmerling and J. Fricke, J. Non-Cryst. Solids, 1998, 225, 69–73 CrossRef CAS.
- N. Job, C. J. Gommes, R. Pirard and J. P. Pirard, J. Non-Cryst. Solids, 2008, 354, 4698–4701 CrossRef CAS.
- P. Grassberger and I. Procaccia, Phys. Rev. Lett., 1983, 50, 346 CrossRef.
- P. S. Addison, Fractals and chaos: an illustrated course, CRC Press, 1997 Search PubMed.
- T. Vicsek, Fractal growth phenomena, World Scientific, 1st edn, 1989, p. 355 Search PubMed.
- M. M. Huber, H. Klein and L. Ratke, Part. Part. Syst. Charact., 2003, 20, 379–381 CrossRef.
- L. L. Latour, R. L. Kleinberg, P. P. Mitra and C. H. Sotak, J. Magn. Reson., Ser. A, 1995, 112, 83–91 CrossRef CAS.
| This journal is © The Royal Society of Chemistry 2019 |

