
 Open Access Article
 This Open Access Article is licensed under a Creative Commons Attribution-Non Commercial 3.0 Unported Licence
Dansyl acetyl trehalose: a novel tool to investigate the cellular fate of trehalose†
Alessandra Locatelli‡
a,
Luisa Iommarini‡a,
Alessandra Graziadioa,
Alberto Leonia,
Anna Maria Porcelliab,
Stefano Iotti ac,
Emil Malucellia,
Francesco Franciaa,
Giovanni Venturolia and
Giovanna Farruggia‡*ac
ac,
Emil Malucellia,
Francesco Franciaa,
Giovanni Venturolia and
Giovanna Farruggia‡*ac
aDipartimento di Farmacia e Biotecnologie (FABIT), Università degli Studi di Bologna, 40127, Bologna, Italy. E-mail: Giovanna.Farruggia@unibo.it
bCentro Interdipartimentale di Ricerca Industriale (CIRI) Scienze della Vita e Tecnologie per la Salute, Università di Bologna, 40100 Bologna, Italy
cNational Institute of Biostructures and Biosystems, Roma 00136, Italy
First published on 16th May 2019
Abstract
A fluorescent derivative of trehalose with two dansyl groups (DAT) has been synthesized. It is characterised by a large Stokes shift, good permeability in human living cells and a well detectable fluorescent signal within the cells. Notably, in intestinal cells DAT is sequestered in vesicles induced by trehalose pre-treatment and colocalizes with lipid droplets.
Trehalose is a disaccharide formed by two molecules of D-glucose linked by an α,α-1,1 bond. It occurs in prokaryotes and eukaryotes, but vertebrates lack the synthetic pathway for this sugar. Trehalose has several important functions: for instance, in insects, it represents an important energy source and the target of different signalling pathways mediated by nutrients; in plants, it is widely present, and its synthetic pathway is a sensor of the glucose availability. This sugar is also widely known for its role in organisms, like yeast, rotifers, nematodes and tardigrades, which have to cope with harsh environmental conditions, such as extreme dryness or freezing.1 The interest for the use of this sugar as a bioprotectant raised in the recent past, and, in particular, trehalose-based protocols have been devised aimed to the cryo- or lyo-preservation of mammalian cells.2–6
To exert its bioprotective effects, trehalose has to be localized both in extra- and intra-cellular compartments. In this regard, its delivery within the cells represents a challenge, because mammalian cells lack a specific transporter for this sugar. It has been proposed that the glucose carrier GLUT8 could efficiently transport this sugar, but this membrane protein has been reported to be scarcely present in mammalian cells.7 Several strategies have been proposed to overcome this hurdle, including electropermeabilization,8 overexpression in mammalian cells of the trehalose transporter (TRET1) from the anhydrobiotic larvae of the African chironomid Polypedilum vanderplanki,9 and freezing-induced osmotic stress in the presence of trehalose.3 Recently the synthesis of an engineered trehalose obtained by conjugating its hydroxyls with six acetyl groups has been reported.10 This molecule is significantly more permeable than trehalose in rat hepatocytes; furthermore, once in the cells, intracellular esterases rapidly reconvert the acetylated form to trehalose, increasing its intracellular concentration to values ten-fold larger than the extracellular concentration of the acetyl-trehalose.
In this context, the availability of fluorescent derivatives could represent an important tool to follow the intracellular fate of trehalose. However, only few trehalose fluorescent derivatives have been published so far, mainly employed in microbiological studies.11,12
The aromatic 1,1-dimethylaminonaphthalene-5-sulfonyl chloride, or dansyl chloride (DNS-Cl), represents a fluorophore with very favourable properties because of its high fluorescence quantum yield and large Stokes shift. It is widely used in peptide chemistry, and in particular as a chromatographic derivatization reagent to identify several kinds of analytes.13–18
In this paper, we describe the synthesis of dansyl acetyl trehalose (DAT), examine its spectroscopic properties, and demonstrate for the first time that it can be successfully applied to detect trehalose uptake and compartmentalization in human intestinal cell lines in specific vesicles.
The first step of our synthetic strategy (see Fig. 1) is the protection of the two primary alcoholic functions with a trityl group using triphenylmethyl chloride or trityl chloride (TrCl) as described in the literature,19 to give compound 1. The trityl group has been frequently used for the temporary protection of primary hydroxyl groups for its easy removal by treatment with weak acid.20 For the protection of secondary alcohols, it has been decided to use acetyl groups instead of benzyl groups, obtaining compound 2; the deprotection of the acetyl groups results, in fact, in addition to be simpler, faster and more efficient. Trityl deprotection of compound 2 was accomplished with iron chloride hexahydrate (FeCl3·6H2O) in methylene chloride to yield trehalose hexaacetate (compound 3). It has been reported that iron chloride hexahydrate is an effective reagent for detritylation.20 With this reagent, in fact, there were no cases of acyl migrations, breakdown of glycosidic bonds, or anomerizations. Finally, the dansylation reaction was carried out, under nitrogen atmosphere, to obtain compound 4 (DAT).
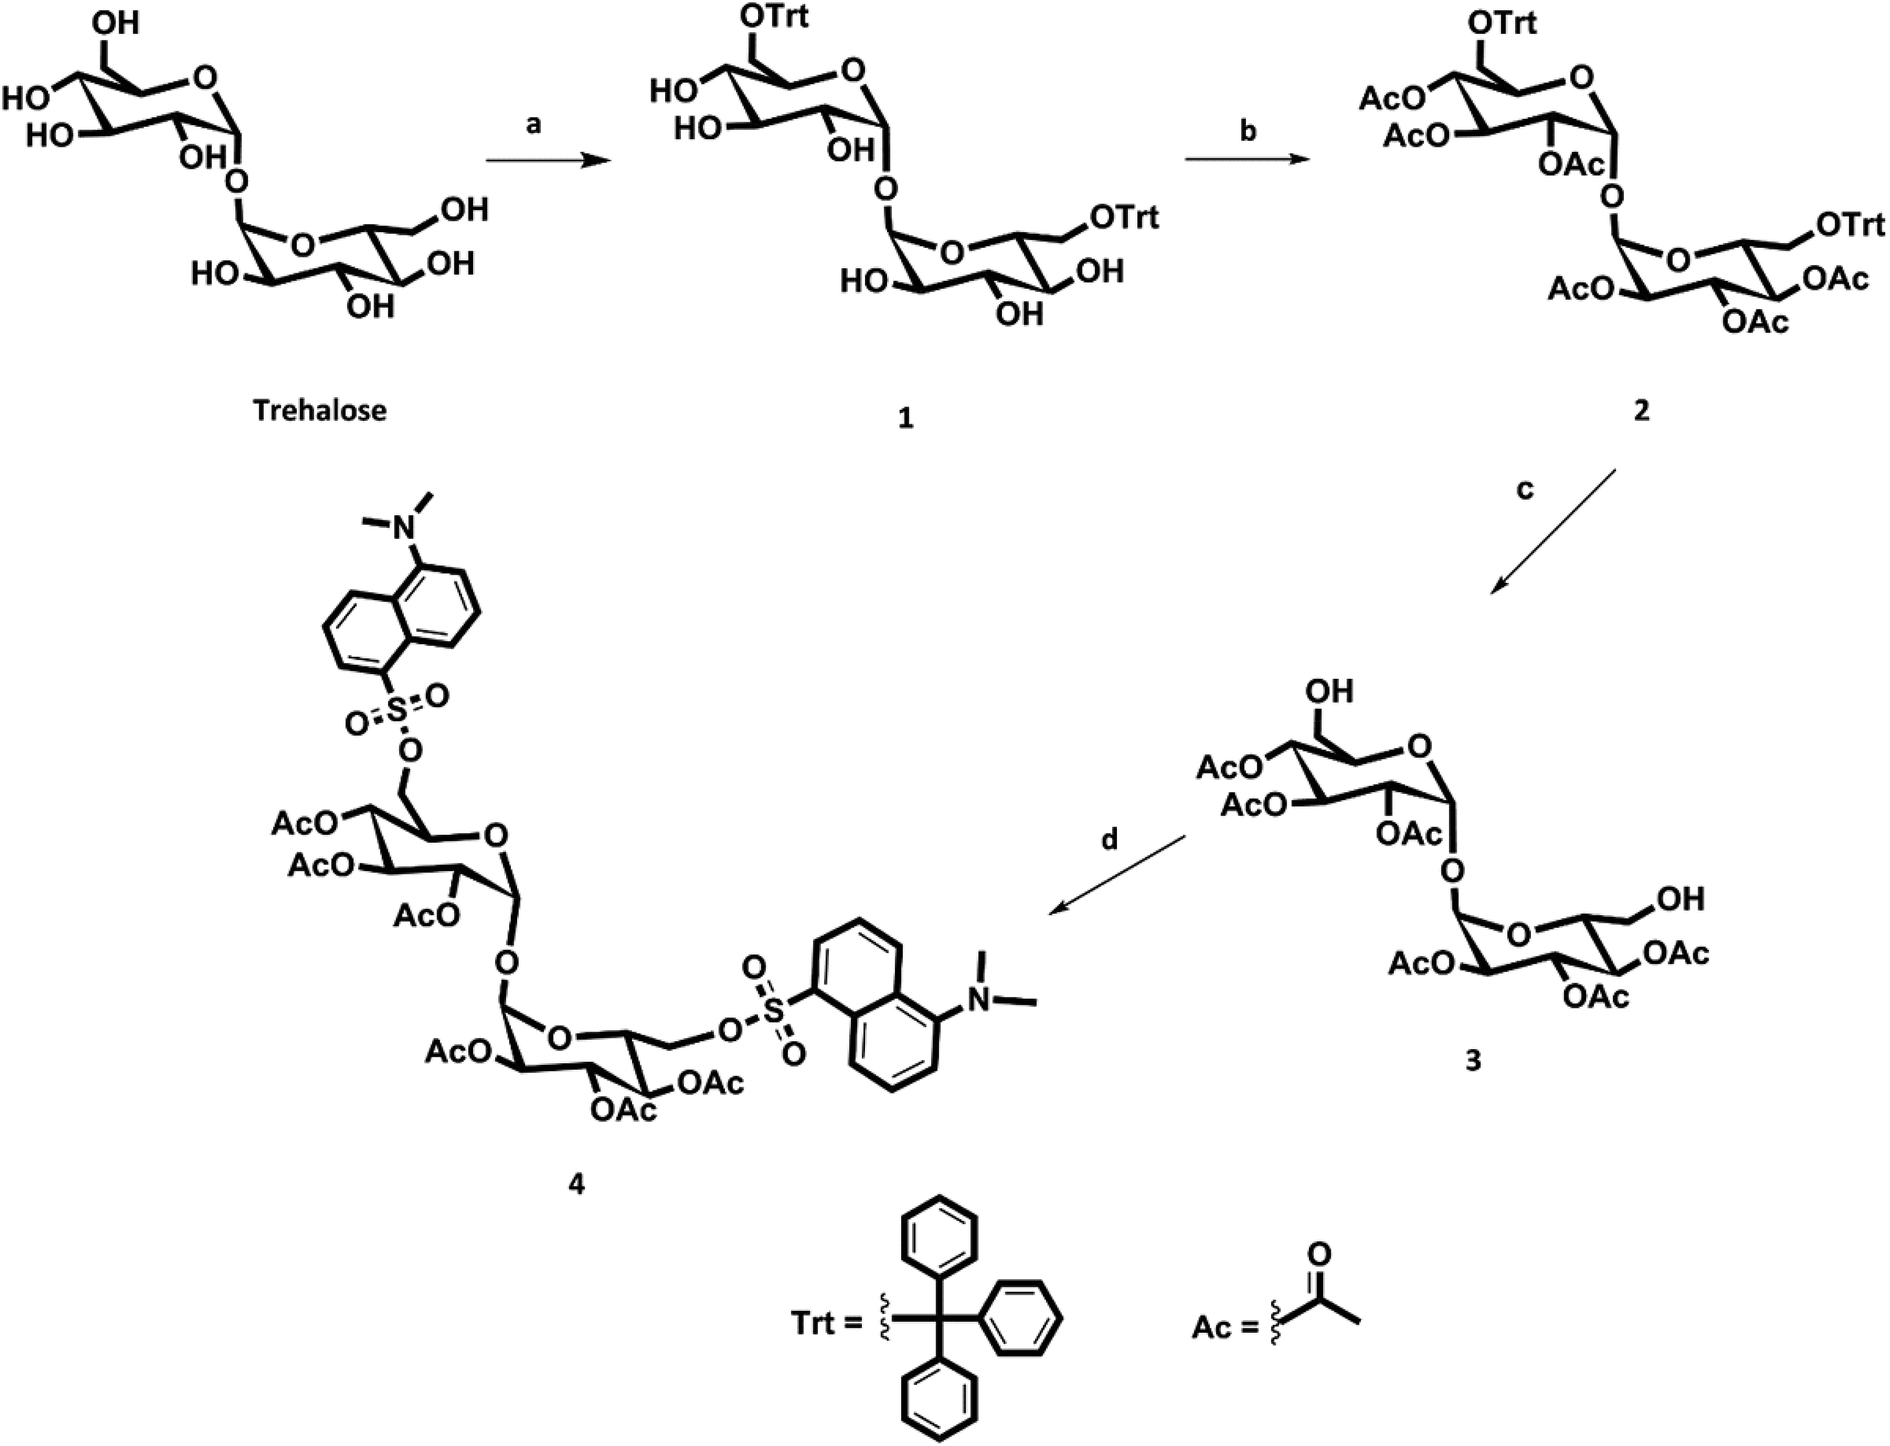 | ||
| Fig. 1 Scheme of DAT synthesis. Reagents: (a) TrCl, py, 75 °C; (b) Ac2O, TEA, DMAP, RT; (c) FeCl3·6H2O, CH2Cl2, RT; (d) DNS-Cl, TEA, DMAP, dry CH2Cl2, RT. | ||
We have assessed the spectrofluorimetric properties of DAT, by examining the effect of solvent polarity on excitation and emission spectra. In fact, it is well known that solvent polarity (static dielectric constant) can heavily affect fluorescence,21 and DNS-Cl in particular responds to different environmental conditions.17 The results are reported in Fig. 2, which compares DAT (panels A and B) with DNS-Cl (panels C and D) spectra. Table 1 summarizes the peak wavelengths (λEm and λEx) of the emission and excitation spectra, respectively.
 | ||
| Fig. 2 Fluorescence spectra of DAT (A, B) and DNS-Cl (C, D) in different solvents. (A) and (C): excitation spectra; (B) and (D): emission spectra. 10 mM stock solutions of DAT and DNS-Cl in DMSO were dissolved in the reported solvents to a 10 μM final concentration. The spectra were acquired as detailed under Materials and methods in the ESI.† | ||
| Solvent | ε | DAT | DNS-Cl | ||
|---|---|---|---|---|---|
| λEm (nm) | λEx (nm) | λEm (nm) | λEx (nm) | ||
| Chloroform | 4.8 | 500 | 353 | — | — |
| Acetone | 21 | 521 | 350 | 423 | 333 |
| Ethanol | 24 | 526 | 350 | 451 | 321 |
| Methanol | 33 | 520 | 350 | 455 | 326 |
| H2O | 80 | 500 | 356 | 488 | 320 |
| DPBS | 80 | 501 | 354 | 495 | 321 |
DNS-Cl fluorescence is heavily modulated by the solvent dielectric constant ε: upon increasing polarity, the emission spectra exhibit a red shift, with the peak moving from 423 nm in acetone to 495 nm in DPBS. Such an effect is not observed in the excitation spectra, the peaks of which range from 320 to 326 nm, with the exception of acetone, for which the excitation maximum is at 333 nm.
Interestingly, chloroform completely turns off DNS-Cl fluorescence. When dansyl is bound to acetyl trehalose, however, it loses this sensitivity to solvent polarity, as shown by the spectra reported in Fig. 2A and B. The emission and excitation peaks lay in a narrow range of wavelengths, from 500 to 526 nm, and from 350 to 356 nm, respectively. Both excitation and emission spectra of DAT are significantly red shifted in comparison to those of DNS-Cl.
In addition, the influence of the tested solvents on the fluorescence intensity is quite different in DNS-Cl and DAT: as shown in Fig. 2, panel D, DNS-Cl fluorescence emission is higher in ethanol and methanol than in aqueous solution or in acetone, being completely turned off in chloroform. On the contrary, DAT shows the highest emission in water and in chloroform and the ionic strength of the physiological saline solution DPBS faints just a little bit the fluorescence (Fig. 2, panel B). Acetone, ethanol and methanol progressively decrease the fluorescence intensity. Because of these spectral characteristics, DAT can be considered a good fluorescent dye suitable for the study of trehalose uptake and compartmentalization in cells. In aqueous solvents, as DPBS or culture medium, DAT shows λEx centred around 350 nm and λEm around 500 nm, features that allow designing applications in fluorescence microscopy or flow cytometry. Indeed, the broad emission spectra allow detecting this dye both in blue and green emission fields. The weak influence of polarity permit the detection of DAT fluorescence in all the compartments of the cell, independently from their hydrophobicity.
Furthermore, DAT exhibits a large Stokes shift between excitation and emission wavelengths (see Fig. 2 and Table 1), which makes it an excellent probe in fluorescence microscopy, especially when spectral separation is required to reduce fluorescence overlap.
When we examined the cellular uptake of DAT, it was mandatory to reduce the concentration of the fluorescent sugar added to the cells, because in culture medium, at concentrations higher than 5 μM, the dye aggregates. Furthermore, to ameliorate the dispersion of the dye in culture medium, the solution was set in a sonication bath for 3 min immediately before use. This treatment does not influence the fluorescence performance of the dye (data not shown). Incubation of three different colon cancer cell lines (LoVo, RKO and HCT116) with 1 μM DAT for 30 minutes showed a dotted pattern, that was mainly localized in body/vesicle-like structures, similar to those described by Higuchi (Fig. 3A).22 On the contrary, cells incubated with 1 μM DNS-Cl showed a faint extracellular diffused fluorescence (Fig. 3B), indicating that only DAT is specifically compartmentalized into the cells. Interestingly, HCT116 displayed very few DAT-positive intracellular vesicles compared to LoVo and RKO cells.
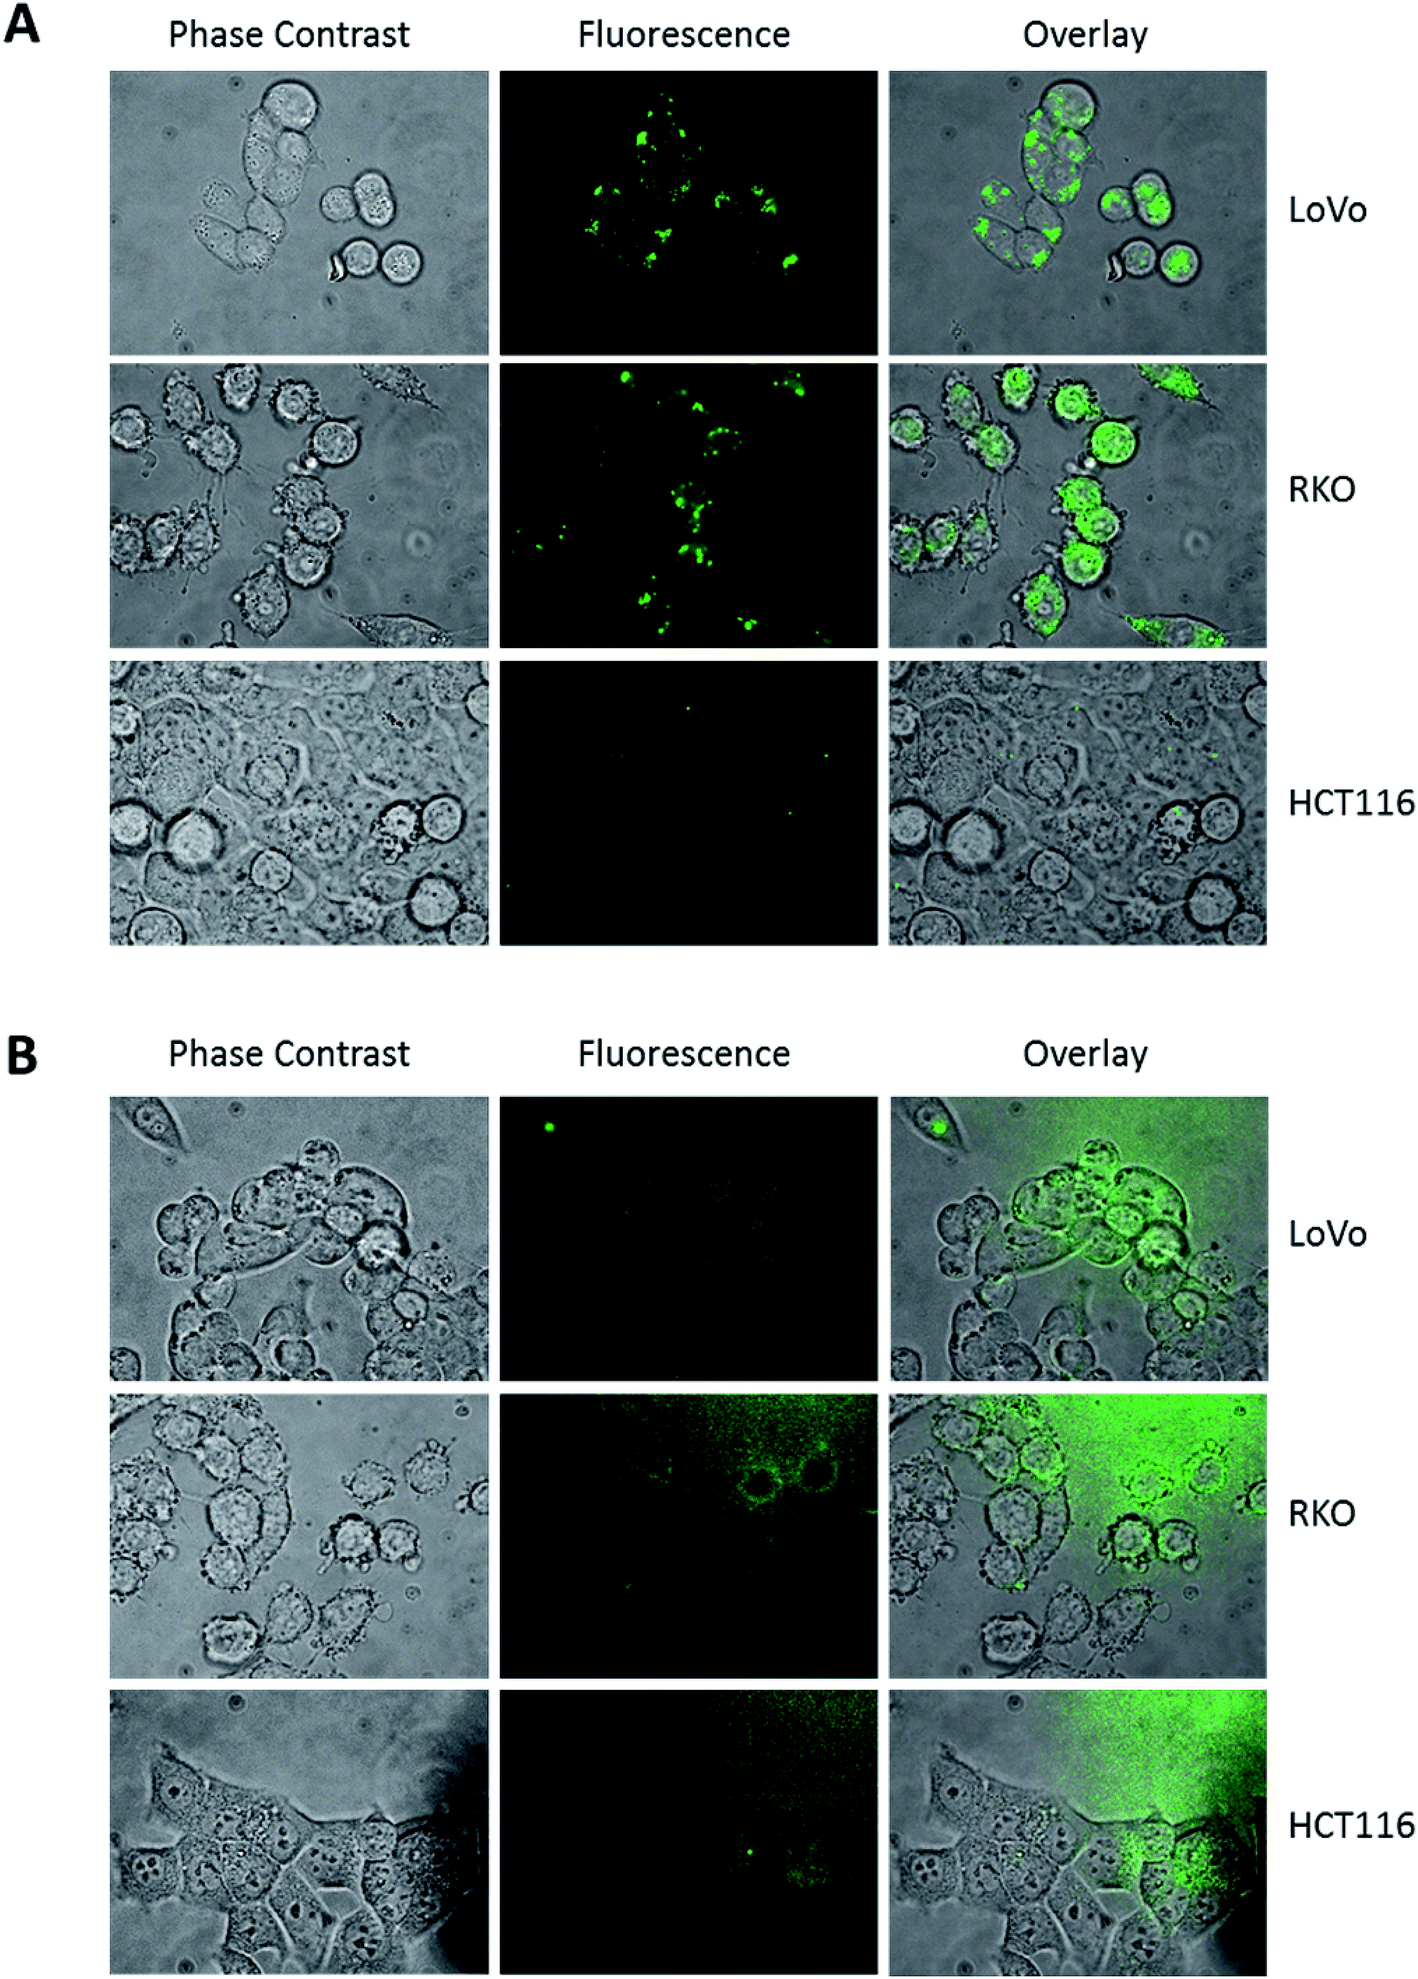 | ||
| Fig. 3 DAT and DNS-Cl intracellular localization. Representative images of LoVo, RKO and HCT116 cells incubated with DAT (A) or DNS-Cl (B) 1 μM for 30 min and evaluated in phase contrast and epifluorescence (60× magnification, exposure time 500 ms) microscopy. Overlay images represent the merge between phase contrast and fluorescence pictures. | ||
It has been reported that treatment with trehalose (likewise with other non-hydrolysable sugars as sucrose) induces vesicle formation in several cell lines, mainly but not exclusively autophagosomes.22
Hence, to trigger vesicle formation, we treated colon cancer cells with 100 mM trehalose for 16 hours before DAT addition and then analysed the pattern of its accumulation by fluorescence microscopy. Under these conditions, the accumulation of DAT into intracellular vesicles became more evident in all cell lines, including HCT116 (Fig. 4A). Moreover, when cells were treated with 100 mM trehalose, DAT fluorescence was retained in these vesicles also following incubation with DAT for 16 hours rather than 30 minutes in all the analysed cell lines (Fig. 4B). In order to identify these intracellular vesicles, we incubated cells with 100 mM trehalose for 16 hours and then we stained cells for 30 minutes with DAT and with either LysoTracker Red (LTR), a fluorescent dye specific for lysosomes, or LipidTOX Red (LT), a probe that selectively binds neutral lipids specifically staining lipid droplets. No colocalization was observed between DAT and LTR in all the analysed cell models, indicating that DAT is not accumulated in lysosomes (Fig. 5A).
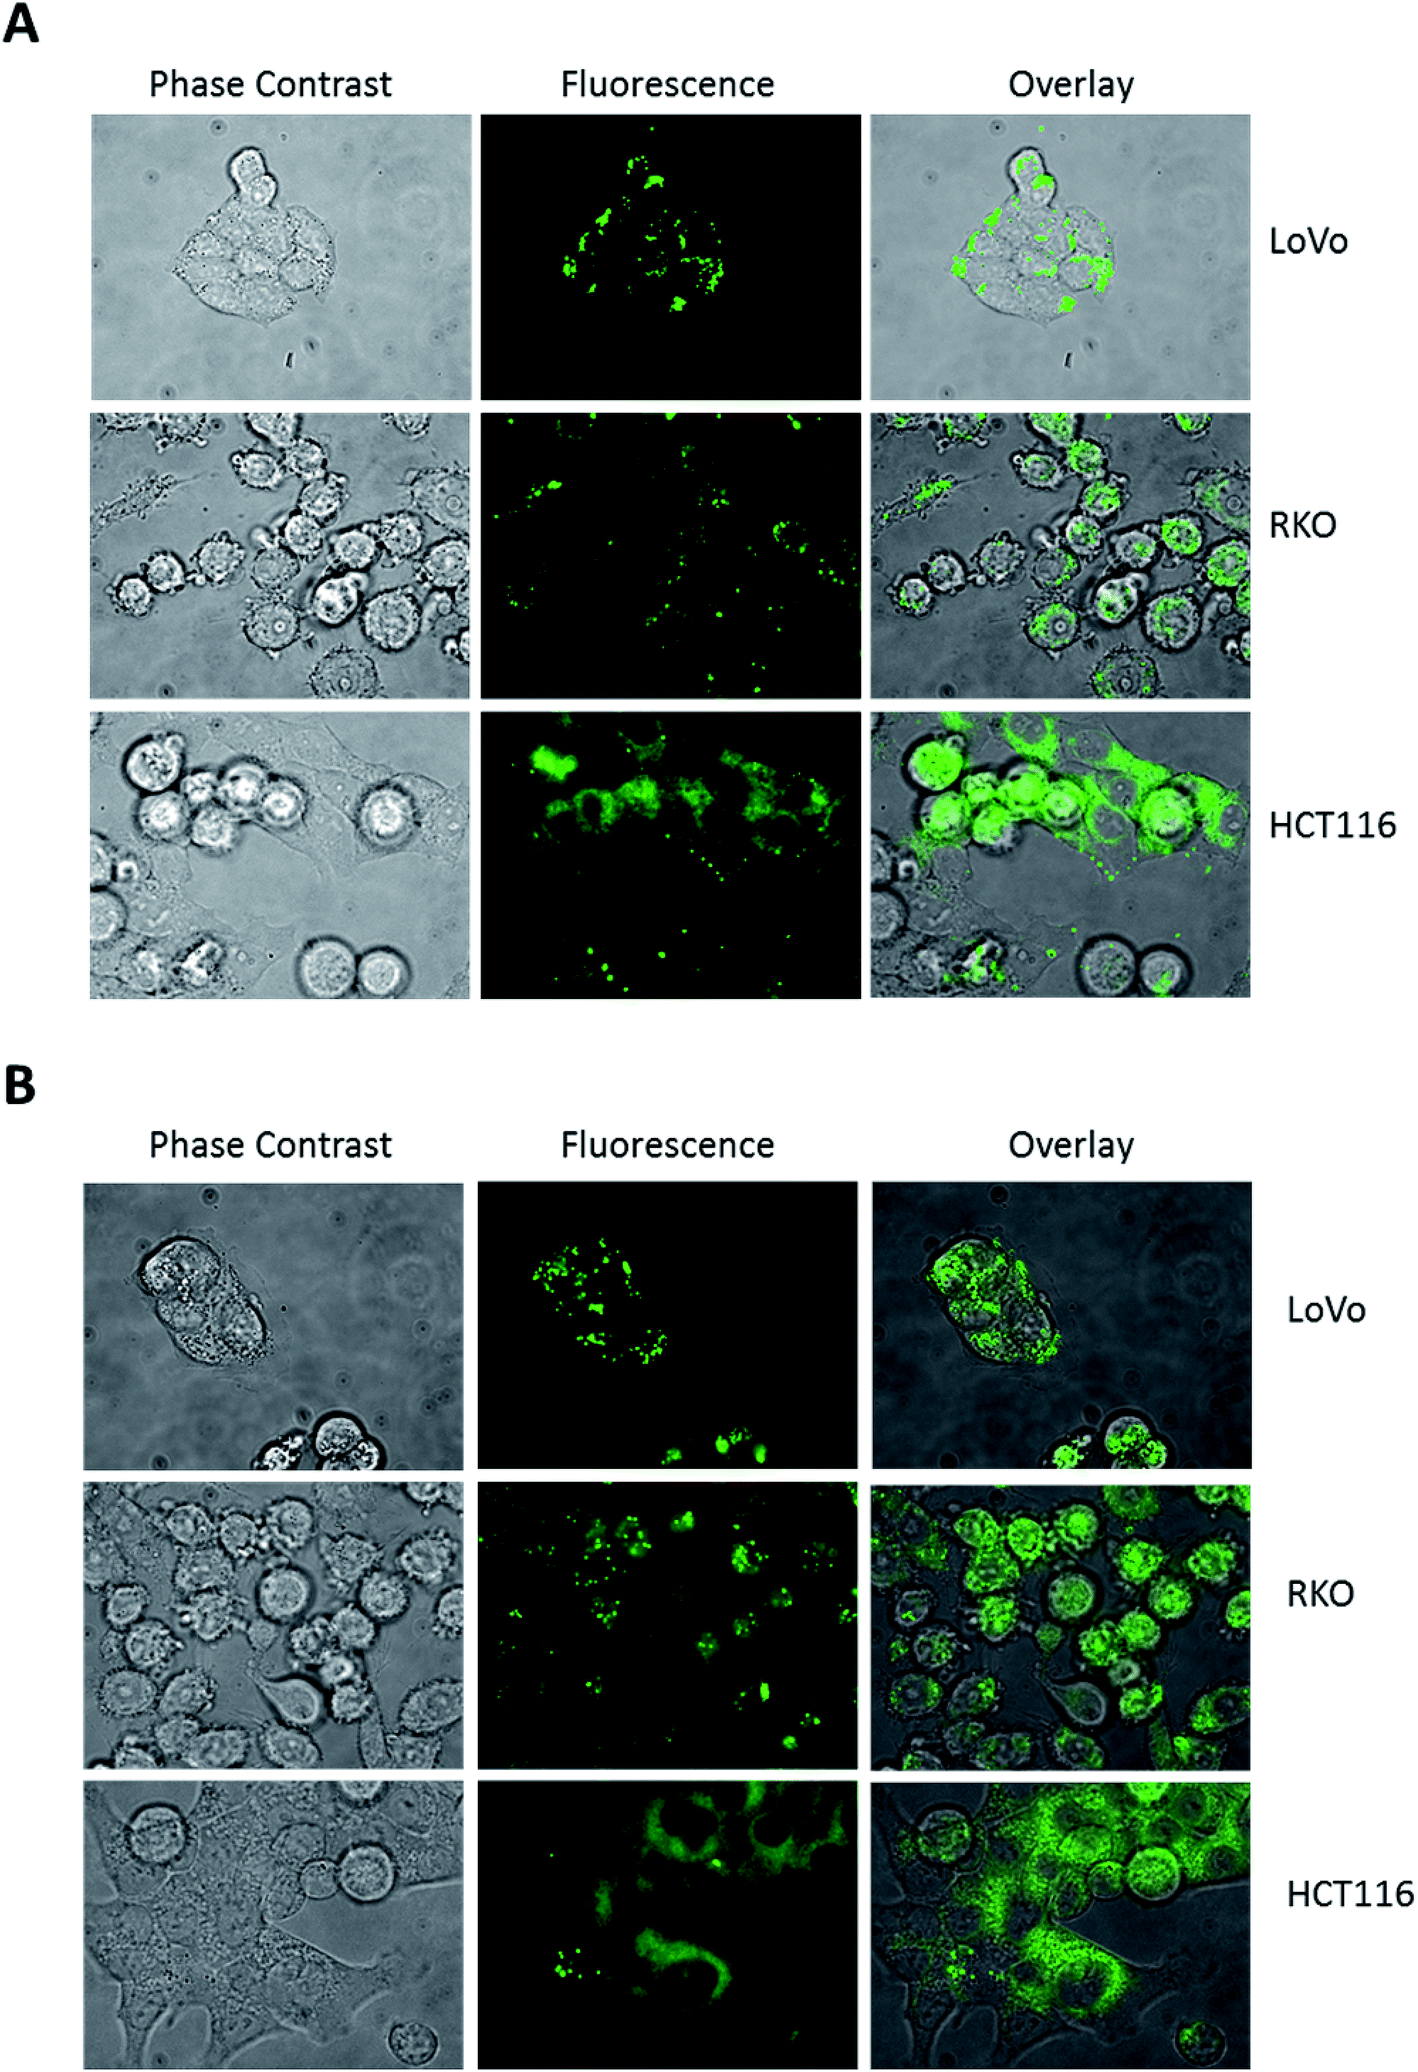 | ||
| Fig. 4 DAT intracellular localization upon trehalose treatment. Representative images of LoVo, RKO and HCT116 cells upon pre-incubation of 16 h with 100 mM trehalose and subsequent incubation with DAT 1 μM for 30 min (A) or 16 h (B), evaluated in phase contrast and epifluorescence (60× magnification, exposure time 500 ms) microscopy. Overlay images represent the merge between phase contrast and fluorescence pictures. | ||
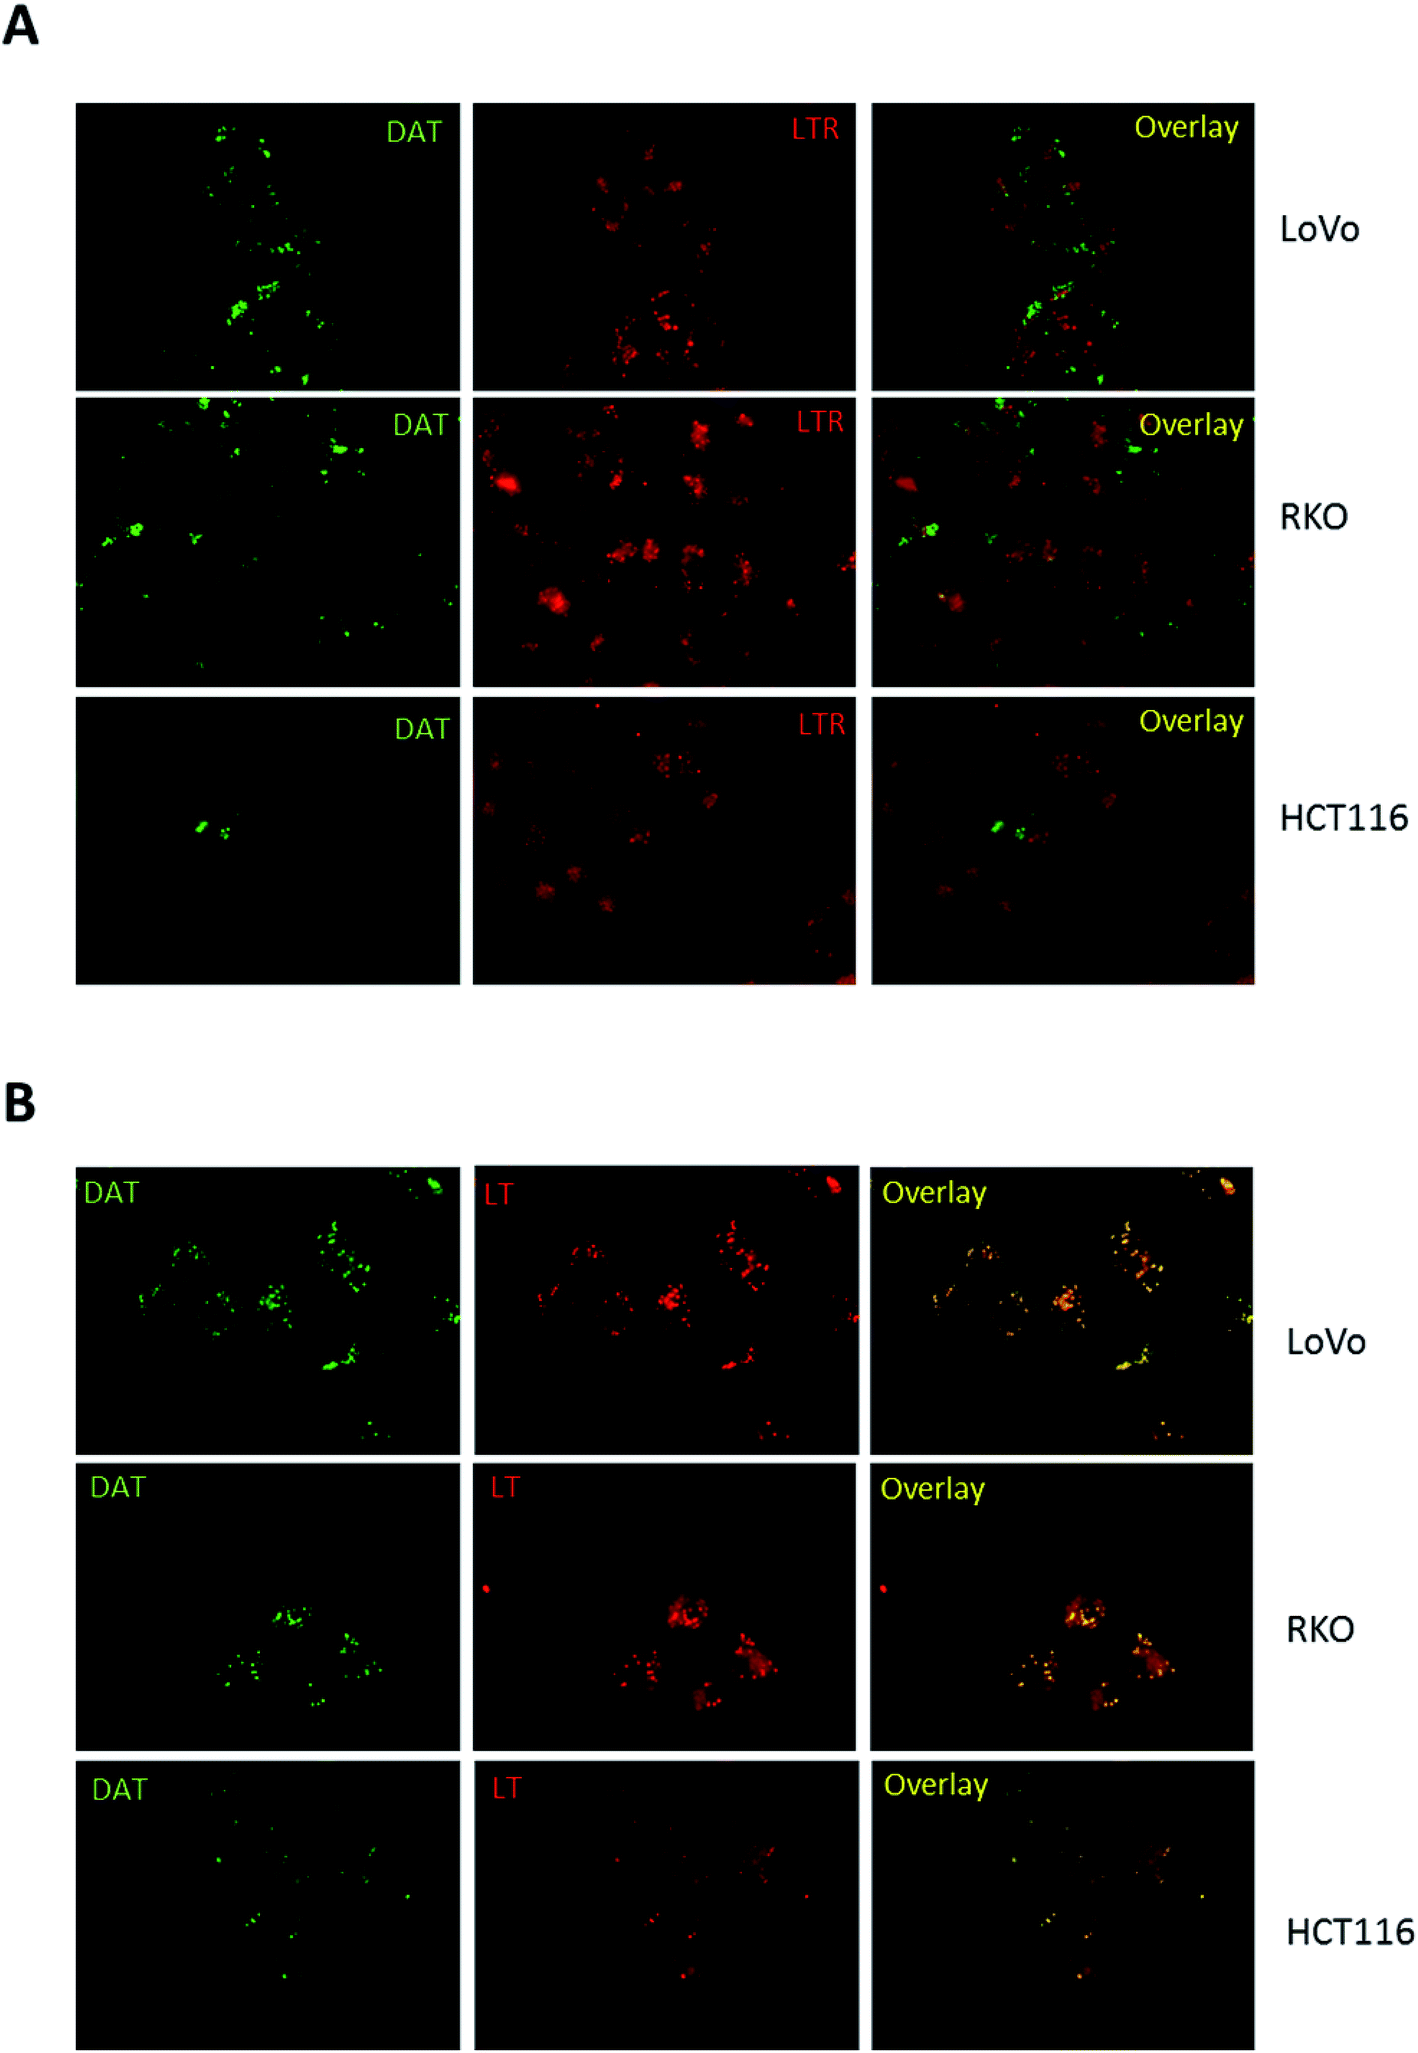 | ||
| Fig. 5 Identification of DAT-positive vesicles. Representative images of LoVo, RKO and HCT116 cells upon pre-incubation of 16 h with 100 mM trehalose and incubation for 30 min with DAT and LysoTracker Red (LTR) (A) or LipidTOX Red (LT) (B). The treatments are detailed under Materials and methods in the ESI.† Epifluorescent images were acquired at 60× magnification with the following exposure times: 500 ms for DAT, 500 ms for LTR and 200 ms for LT. Overlay images represent the merge of the two fluorescence pictures and show in panel B colocalization between DAT and LT. | ||
Conversely, the fluorescent stain of DAT perfectly merged with LT (Fig. 5B), indicating that DAT is preferentially accumulated in lipid droplets in intestinal cells. Interestingly, HCT116 showed less lipid droplets compared to LoVo and RKO cells and they were all DAT-positive, suggesting that the reduced DAT staining found in HCT116 cells was not determined by a different uptake of DAT but rather due to a natural propensity of these cells to accumulate less lipid droplets compared to the other colon cancer models. Moreover, compared to LT, DAT produced a clear staining of lipid droplets with a very low intracellular diffuse fluorescence. Overall, these data indicate that DAT is a highly selective dye for lipid droplets and that trehalose internalized within the cell is stored in the lipid droplets compartment.
In conclusion, we report a reproducible synthetic strategy to prepare a fluorescent acetylated trehalose derivative, which exhibits a good permeability in human living cells, maintaining a well detectable intracellular fluorescent signal. Furthermore, this synthesis is cost effective when compared to derivatization with other fluorochromes. The presence of acetyls facilitates the cellular uptake, as shown by the staining pattern obtained in few minutes; as proposed by Abazari,10 the cellular esterases are expected to rapidly hydrolyze the acetyl groups, thus entrapping the dansyl-trehalose within the cells. Due to the low solubility in water, DAT can be added to cell cultures only at concentrations lower than 5 μM. However its entrapment within the cells is consistent with a prompt hydrolyzation of the acetyl ester bonds by intracellular esterases, as pointed out by Abazari et al.10 The ability of trehalose to rapidly induce the formation of intracellular vesicles is paralleled by the interaction of DAT with these structures, suggesting a common route for native and fluorescent sugar. Finally, DAT fluorescence offers the advantage of being only slightly influenced by the cellular environment, maintaining a good intensity in hydrophobic or hydrophilic compartments.
This is evident from the staining of the tested intestinal cells, were different patterns are recognizable. Notably, DAT is always sequestered in vesicles induced by the sugar treatment, indicating that this compound is a promising probe for lipid droplets in living cells. Additionally, when considering that trehalose is an important player in the assembly and architecture of mycobacterial cell envelope, DAT could be profitably used as a fluorescent probe to investigate mycobacterial trehalose processing and trehalose-related mechanisms targeted by novel tuberculosis therapeutics.23
Conflicts of interest
There are no conflicts to declare.References
- L. M. Crowe, Comp. Biochem. Physiol., 2002, 131, 505–513 CrossRef.
- M. Zhang, H. Oldenhof, B. Sydykov, J. Bigalk, H. Sieme and W. F. Wolkers, Sci. Rep., 2017, 7, 6198 CrossRef PubMed.
- M. Zhang, H. Oldenhof, H. Sieme and W. F. Wolkers, Biochim. Biophys. Acta, 2016, 1858, 1400–1409 CrossRef CAS PubMed.
- K. Deb, Sci. World J., 2009, 9, 236–249 CrossRef PubMed.
- L. Keskintepe and A. Eroglu, Methods Mol. Biol., 2015, 1257, 489–497 CrossRef CAS PubMed.
- P. Loi, D. Iuso, M. Czernik, F. Zacchini and G. Ptak, Trends Biotechnol., 2013, 31, 688–695 CrossRef CAS PubMed.
- A. L. Mayer, C. B. Higgins, M. R. Heitmeier, T. E. Kraft, X. Qian, J. R. Crowley, K. L. Hyrc, W. L. Beatty, K. E. Yarasheski, P. W. Hruz and B. J. DeBosch, Sci. Rep., 2016, 6, 38586 CrossRef CAS PubMed.
- R. Shirakashi, C. M. Köstner, K. J. Müller, M. Kürschner, U. Zimmermann and V. L. Sukhorukov, J. Membr. Biol., 2002, 189, 45–54 CrossRef CAS PubMed.
- T. Uchida, M. Furukawa, T. Kikawada, K. Yamazaki and K. Gohara, Cryobiology, 2017, 77, 50–57 CrossRef CAS PubMed.
- A. Abazari, L. G. Meimetis, G. Budin, S. S. Bale, R. Weissleder and M. Toner, PloS One, 2015, 10, e0130323 CrossRef PubMed.
- K. M. Backus, H. I. Boshoff, C. S. Barry, O. Boutureira, M. K. Ptel, F. D'Hooge, S. S. Lee, L. E. Via, K. Tahlan, C. E. Barry and B. G. Davis, Nat. Chem. Biol., 2011, 7, 228–235 CrossRef CAS PubMed.
- M. Kamariza, P. Shieh and C. R. Bertozzi, Methods Enzymol., 2018, 598, 355–369 CAS.
- G. Weber, Biochem. J., 1952, 51, 155–167 CrossRef CAS PubMed.
- R. F. Chen, Arch. Biochem. Biophys., 1967, 120, 609–620 CrossRef CAS.
- L. Zhang, Y. Li, H. Zhou, L. Li, Y. Wang and Y. Zhang, J. Pharm. Biomed. Anal., 2012, 66, 356–358 CrossRef CAS PubMed.
- R. Nirogi, P. Komarneni, V. Kandikere, R. Boggavarapu, G. Bhyrapuneni, V. Benade and S. Gorentla, J. Chromatogr. B: Anal. Technol. Biomed. Life Sci., 2013, 913–914, 41–47 CrossRef CAS PubMed.
- R. P. Haugland, Handbook of fluorescent probes and research products, Molecular Probes, 2002 Search PubMed.
- D. G. Beach, H. Liu and M. A. Quilliam, Anal. Methods, 2015, 7, 1000–1007 RSC.
- J. Im, S. Kim, Y.-H. Jeong, W. Kim, D. Lee, W. S. Lee, Y.-T. Chang, K.-T. Kim and S.-K. Chung, MedChemComm, 2013, 4, 310–316 RSC.
- X. Ding, W. Wang and F. Kong, Carbohydr. Res., 1997, 303, 445–448 CrossRef CAS.
- J. R. Lakowicz, Principles of Fluorescence Spectroscopy, Springer US, 3rd edn, 2006 Search PubMed.
- T. Higuchi, J. Nishikawa and H. Inoue, J. Cell. Biochem., 2015, 116, 609–617 CrossRef CAS PubMed.
- A. Nobre, S. Alarico, A. Maranha, V. Mendes and N. Empadinha, Microbiology, 2014, 160, 1547–1570 CrossRef CAS PubMed.
Footnotes |
| † Electronic supplementary information (ESI) available. See DOI: 10.1039/c9ra01800j |
| ‡ These authors contribute equally to this work. |
| This journal is © The Royal Society of Chemistry 2019 |