 Open Access Article
Study of the magneto-electronic, optical, thermal and thermoelectric applications of double perovskites Ba2MTaO6 (M = Er, Tm)
Muskan Nabi and
Dinesh C. Gupta *
*
Condensed Matter Theory Group, School of Studies in Physics, Jiwaji University, Gwalior-474 011, India. E-mail: sosfizix@gmail.com
First published on 21st May 2019
Abstract
The structural, electronic, optical, thermodynamic and thermoelectric properties of double perovskites Ba2MTaO6 (M = Er, Tm) have been studied. These alloys stabilize in cubic structure with paramagnetic phases and structural parameters that are in good agreement with experimental results. The elastic parameters reveal both materials as being super hard and brittle in nature. The band profile displays the direct bandgap semiconducting behavior of both compounds in the spin-up channels. The optical coefficients, viz. optical conductivity, reflectivity and electron energy loss, are intended for a photon energy of up to 14 eV to perceive the optical response. The effects of temperature and pressure on the thermodynamic properties have also been evaluated via the quasi-harmonic Debye model. Post-DFT treatment was performed to explore the thermoelectric properties; both perovskites exhibit a colossal power factor of 90 × 1011 W m−1 K−2 s−1 and 5 × 85 × 1011 W m−1 K−2 s−1 for Ba2TmTaO6 and Ba2ErTaO6, respectively, at 800 K.
1 Introduction
Ceramics with layered structure represent the richest class of materials and are the subject of interest to material scientists and solid-state chemists, showing diverse physical, chemical and catalytic properties used for technological applications.1–6 They show amazingly high adaptability due to their structural and chemical flexibility with the basic formula of ABX3.7 The complex perovskites are created by ion replacements in the structure of simple perovskites. The chemical identity, coordination environment, deformation and tilting of the octahedral B-site cation define the physical and chemical behavior of these perovskites. The selection of B-site is influential for the vital interesting properties of these oxides. This site is occupied by ions of smaller radii with relatively low coordination numbers. Usually, transition/non-transition metal or rare-earth ion occupies position B.8 Generally, double perovskites have cubic Fm![[3 with combining macron]](https://www.rsc.org/images/entities/char_0033_0304.gif) m structure, possessing a regular arrangement of corner-sharing BO6 and B′O6 octahedral units, alternating along the three directions of the crystal. Due to the occupation of cation A and also cations B and B′ at different positions in the double perovskite, several structures with different space groups are possible. Due to high structural and chemical flexibility of perovskites, they possess many charming properties including high Tc superconductivity, giant magnetoresistance (CMR), ionic conductivity, catalytic properties, ferromagnetic properties, anti-ferromagnetic to ferri-magnetic ordering, and multiferroicity.9–13 These oxide structures have also achieved tremendous attention in many technological aspects and spin-electronics (spintronics), as they possess mesmerizing and supreme magneto-electronic properties. Spintronics are thought-provoking, as they show dissimilar character in different spin channels.14–16
m structure, possessing a regular arrangement of corner-sharing BO6 and B′O6 octahedral units, alternating along the three directions of the crystal. Due to the occupation of cation A and also cations B and B′ at different positions in the double perovskite, several structures with different space groups are possible. Due to high structural and chemical flexibility of perovskites, they possess many charming properties including high Tc superconductivity, giant magnetoresistance (CMR), ionic conductivity, catalytic properties, ferromagnetic properties, anti-ferromagnetic to ferri-magnetic ordering, and multiferroicity.9–13 These oxide structures have also achieved tremendous attention in many technological aspects and spin-electronics (spintronics), as they possess mesmerizing and supreme magneto-electronic properties. Spintronics are thought-provoking, as they show dissimilar character in different spin channels.14–16
A lot of work has been done on double perovskites, with position B occupied by rare-earth or transition metal elements (e.g., 3d, 4d or 5d) and the A site occupied by alkaline-earth elements (Sr and Ba),17–20 and more work is yet to be performed. Various properties including the crystal structure of Ba2LnNbO6 (where Ln = lanthanide) have been investigated.17 The magnetic and structural properties of M2LnTaO6 (M = Ba, Sr) were also provided earlier.21 They observed that Sr-based compounds possess monoclinic structure, whereas Ba-based compounds possess cubic as well as monoclinic structures. Many barium-based double-perovskites like Ba2LnNbO6 were synthesized,22 and they reported that they mostly possessed cubic structures except for ‘La’ doped alloys, which possessed tetragonal distorted structure. Ba2HoSbO6 and Ba2ErSbO6, along with other rare-earth variants (Ba2RNbO6, R = Nd, Sm, Eu, Gd, Tb, Yb), were also previously characterized.23–25 The Ho and Er variants were reported to have cubic structure with an Fm![[3 with combining macron]](https://www.rsc.org/images/entities/char_0033_0304.gif) m phase, with a = 8.417 Å for Ho and a = 8.397 Å for Er. The double perovskite A2ErSbO6 was studied for its various properties and uses.26 Nair et al.27 observed the dielectric properties of Ba2TmSbO6 and concluded that the compound had the lowest dielectric loss. Rare earth-based double perovskites have found a wide variety of applications. Double perovskites with lanthanides in the B-site have found a variety of microwave applications and can be used as dielectric resonators.28,29 Tantalum-based oxides have found an ample array of applications including piezoelectric actuators, sensors, transducers, half-metallics and photocatalytic activity.30 Ba2ErTaO6 (ref. 18 and 31) and Ba2TmTaO6 compounds have been synthesized experimentally, but no theoretical studies have been conducted so far. Thus, we investigated the structural, magnetic, thermodynamic, thermoelectric, and mechanical properties of these materials through DFT, which could possibly find scope for many applications.
m phase, with a = 8.417 Å for Ho and a = 8.397 Å for Er. The double perovskite A2ErSbO6 was studied for its various properties and uses.26 Nair et al.27 observed the dielectric properties of Ba2TmSbO6 and concluded that the compound had the lowest dielectric loss. Rare earth-based double perovskites have found a wide variety of applications. Double perovskites with lanthanides in the B-site have found a variety of microwave applications and can be used as dielectric resonators.28,29 Tantalum-based oxides have found an ample array of applications including piezoelectric actuators, sensors, transducers, half-metallics and photocatalytic activity.30 Ba2ErTaO6 (ref. 18 and 31) and Ba2TmTaO6 compounds have been synthesized experimentally, but no theoretical studies have been conducted so far. Thus, we investigated the structural, magnetic, thermodynamic, thermoelectric, and mechanical properties of these materials through DFT, which could possibly find scope for many applications.
2 Computational details
We used the full-potential linearized augmented plane wave method as embedded in Wien2k.32,33 Exchange and correlation were treated by GGA and GGA + U approximation within the Perdew–Burke–Ernzerhof of parameterization. GGA + U was used for the consideration of on-site correlation in the d and f electrons of the transition metal atoms. The effective coulomb–exchange interaction Ueff (U–J) with J = 0.001 was Ueff = 0.28 Ry for f electrons and 0.18 Ry for d-electrons. We optimized the lattice constant at the lowest energy and found it to be close to the measured value. The cut-off parameter RMTKmax, which determines the size of the basis set, was chosen to be 7.0 for energy convergence, where RMT is the smallest muffin-tin sphere radii and Kmax is the largest reciprocal lattice vector. The self-consistent calculations are considered to be converged when the integration of the absolute charge density difference between the input and output electron density is less than 0.0001e per f.u., where ‘e’ is the electron charge. We used 3000 K points in the first Brillouin zone (BZ) and performed harmonic expansion up to lmax = 10 in each atomic sphere. For thermodynamic calculation, the quasi-harmonic Debye model was used, as discussed elsewhere.34 The transport properties are calculated in the framework of the semi-classical Boltzmann theory using BoltzTraP code under constant relaxation time approximation.35 The elastic constants were also determined to check the mechanical stability of the materials.Double perovskites A2BB′O6 are driven from perovskites ABO3 by replacing half of the B cations with different B′ cations at a 1![[thin space (1/6-em)]](https://www.rsc.org/images/entities/char_2009.gif) :
:![[thin space (1/6-em)]](https://www.rsc.org/images/entities/char_2009.gif) 1 ratio. Here, the B and B′ cations are ordered in a rock salt manner, resulting in idealized Fm
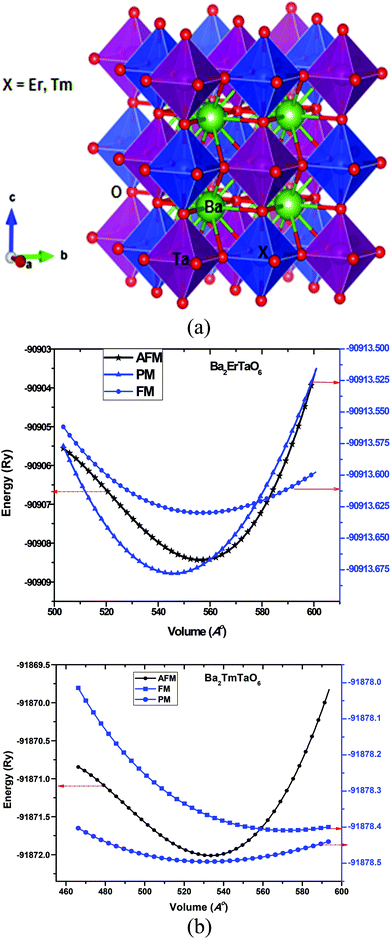
1 ratio. Here, the B and B′ cations are ordered in a rock salt manner, resulting in idealized Fm![[3 with combining macron]](https://www.rsc.org/images/entities/char_0033_0304.gif) m cubic structure with twice the length of the ABO3 perovskite subcell. The Ba-atom is 12-coordinated to oxygen atoms, while (M = Er, Tm) lies within cages of 6-oxygen atoms. The structure of Ba2MTaO6 is an extension of octahedral ErO6 and TaO6 over three dimensions with Ba occupying the hollow void. The crystal structure of the present perovskites is represented in Fig. 1a.
m cubic structure with twice the length of the ABO3 perovskite subcell. The Ba-atom is 12-coordinated to oxygen atoms, while (M = Er, Tm) lies within cages of 6-oxygen atoms. The structure of Ba2MTaO6 is an extension of octahedral ErO6 and TaO6 over three dimensions with Ba occupying the hollow void. The crystal structure of the present perovskites is represented in Fig. 1a.
3 Results and discussions
The structural, electronic, magnetic, optical, thermal and thermoelectric properties of tantalum-based double perovskites Ba2ErTaO6 and Ba2TmTaO6 are discussed below.3.1 Structural properties
The structure and geometry of Ba2MTaO6 (M = Er, Tm) compounds were calculated at equilibrium lattice parameters, which are obtained by optimizing the volume against the energy. In this process, the unit cell energy is varied with respect to volume, and the energy against volume for each unit cell was minimized by fitting the Birch–Murnaghan equation of state.36 Both rare earth-based double perovskites were found to crystallize in cubic (Fm![[3 with combining macron]](https://www.rsc.org/images/entities/char_0033_0304.gif) m) structure, as reported experimentally as well as by calculating the tolerance factor.31 The tolerance factor is calculated as:
m) structure, as reported experimentally as well as by calculating the tolerance factor.31 The tolerance factor is calculated as:where rBa is the ionic radius of a barium atom, rO is the ionic radius of an oxygen atom, rEr is the ionic radius of an erbium atom and rTm is the ionic radius of a thulium atom. Materials with τ in the vicinity of 0.9–1.0 have perfect cubic structure, while τ in the range 0.71–0.9 forms rhombohedral or orthorhombic structure. The value of the tolerance factor computed for Ba2MTaO6 (M = Er, Tm) is equal to 1.0 and lies within the cubic range. The atoms occupy positions as: Ba (0.25,0.25,0.25); M (0,0,0); Ta (0.5,0.5,0.5); and O (0.25,0,0). The compounds have been searched for stability in paramagnetic, ferromagnetic and anti-ferromagnetic phases, and both were found to be stable in the paramagnetic state with optimized lattice constants equal to 8.45 Å and 8.43 Å for Ba2ErTaO6 and Ba2MTaO6, respectively, and are in decent agreement with the previous experimental results.18,31,37,38 The optimization plots for both compounds are depicted in Fig. 1b. These plots show that they are stable in the paramagnetic state, as they owe minimum energy in this phase. The relaxed lattice constants, bulk modulus, derivatives of the bulk modulus and ground state energies are shown in Table 1.
3.2 Densities of states and electronic properties
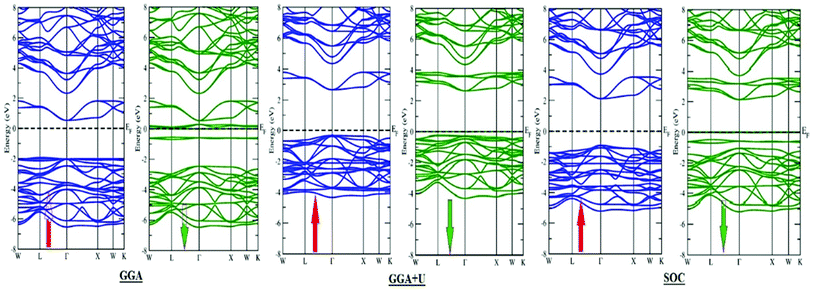
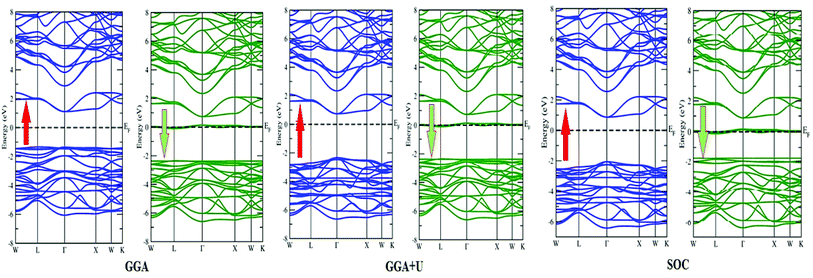
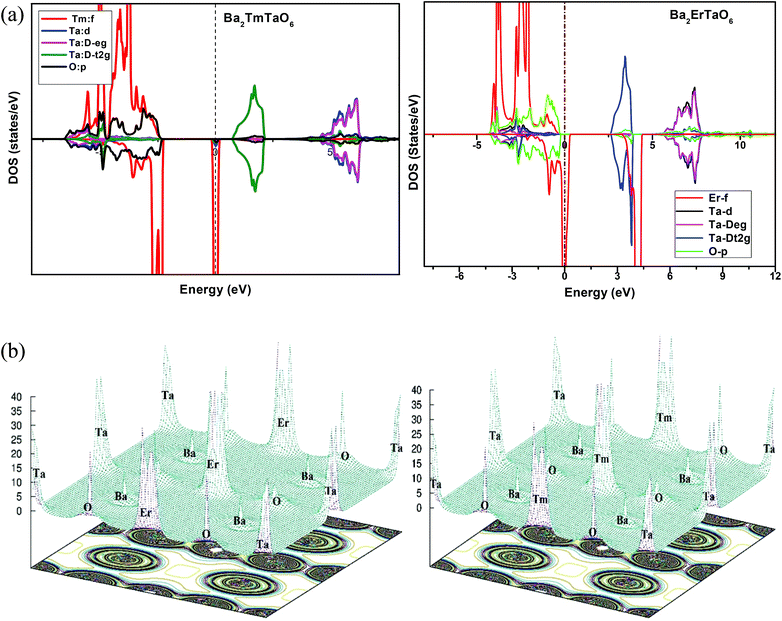
In search of smart devices for technological applications, the electronic properties of these materials were evaluated by employing GGA, SOC and GGA + U and are explained on the basis of band structure, the total density of states (DOS) and the partial density of states (PDOS). The spin-polarized band structure was calculated by GGA, SOC and GGA + U. However, GGA + U calculations were used, as it provides better treatment for correlated electrons, thus providing a better description of the band gap and magnetic properties.37 The Hubbard interaction parameter Ueff (U–J) where J = 0.001 and Ueff was changed until we obtained the correct band structure profile, and the optimized value or Ueff for f-electrons and d-electrons was set to 0.28 Ry for Er and Tm and 0.18 Ry for Ta atoms in Ba2ErTaO6 and Ba2TmTaO6, as these values provide a correct band profile and magnetic properties. The GGA calculation designates the semiconducting behavior in the spin-up state with a direct band gap of 2.50 eV in Ba2ErTaO6 and 2.40 eV in Ba2TmTaO6, while both compounds in the spin down state showed metallic nature. Upon application of spin–orbit coupling (SOC), there was no significant effect though the energy bands are shifted towards the Fermi level in the valence band. By applying the on-site Hubbard potential, the ‘U’ energy levels shift towards the Fermi level in the valence band and drift away from the Fermi level in the conduction band resulting in larger band gaps in the spin-up channel, as compared to GGA and SOC. The band gap value varies from 2.50 eV to 2.75 eV after applying GGA + U in the case of Ba2ErTaO6, while for Ba2TmTaO6, the gap changes from 2.43 eV to 2.87 eV. In the case of the spin-up channel, the separation between the conduction band and the Fermi level are 0.71 eV and 0.18 eV, and the separation between the valence band and Fermi level are 2.1 eV and 2.57 eV in Ba2ErTaO6 and Ba2TmTaO6, respectively. This energy gap is responsible for 100% spin polarization at the Fermi level for Ba2ErTaO6 and Ba2TmTaO6. The spin-polarized band structures are displayed in Fig. 2 and 3. In addition to the band structure, the total DOS within GGA, SOC and GGA + U are presented in Fig. 4–6 for both compounds. Upon comparing the DOS calculated by the GGA, SOC and GGA + U approximations for both compounds, there are no considerable differences in the majority spin states, which confirms the metallic character, while in the minority state, the power of Coulomb interaction is clearly seen from Fig. 4. In the case of Ba2MTaO6 (M = Er, Tm), the maximum contribution to the DOS comes from the f-states of Er and Tm atoms, as observed in Fig. 5. In order to perceive the contribution of each atom to the electronic structure, the projected DOS of Ba, M (M = Er, Tm), Ta and O are also calculated by GGA + U approximation and shown in Fig. 6a.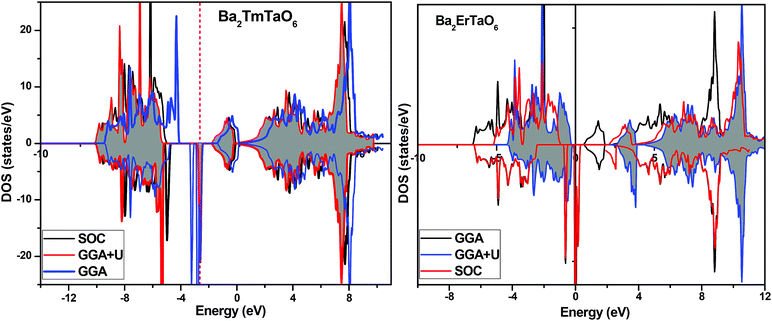 | ||
| Fig. 4 Spin-polarized total density of states (DOS) of Ba2MTaO6 (where M = Er, Tm) at the equilibrium lattice constant calculated by GGA, SOC and GGA + U methods. | ||
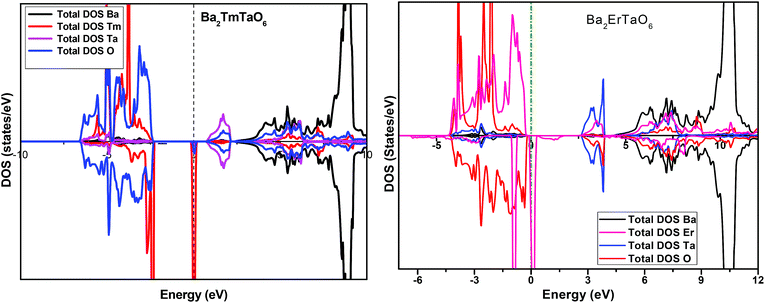 | ||
| Fig. 5 Spin-polarized total density of states (DOS) of individual atoms Ba2MTaO6 (M = Er,Tm) at the equilibrium lattice constant calculated by the GGA + U method. | ||
The basis of half-metallic nature can be well described with the help of the partial density of states plots given in Fig. 6a. The crystal field splitting removes the 5-fold degeneracy of the d-states of Ta5+ into two non-degenerate groups, triplet d-t2g states and doublet d-eg states and the f-states of the Tm3+ and Er3+ ions in the T1u, T2u, and A2u schemes. In the spin-down channel, metallic behavior ascends due to the occupation of the f-state at the Fermi level by Er and Tm ions in Ba2ErTaO6 and Ba2TmTaO6, respectively. The Ta5+ ion has no valence electrons, so the d-t2g (↑) and d-eg (↑) states are empty and reside in the conduction bands for both spin states. On the other side, Tm3+ has twelve valence electrons, two single electrons and a pair of electrons in the antibonding T1u orbital, while there are four pairs in the T2u and A2u bonding orbitals. The spin-up state is thus the majority spin channel as most valence electrons enter the channel. Only one electron enters the T1u state in a spin down orientation, making it reside at the Fermi level, which gives rise to the metallic nature in the respective spin channel. The d-orbital of Er3+ in the majority spin channel is completely occupied and remains in the valence band. The p-states of oxygen gains electrons from all other ions and are the chief contributors to the valence band. The valence band in the spin-up states arises due to the strong hybridization between the f-states of Tm and Er, the dt2g of Ta and the p-states of O. The semiconducting behavior is attributed to the nonappearance of energy states at the Fermi level in the spin-up channel.
3.3 Electron charge density
The electron charge density helps us to understand the bonding and charge sharing among the various ions. The electron charge densities calculated in the 3-D counter plots along the (111) crystallographic planes are displayed in Fig. 6b. The charge distribution around Ba is spherical, revealing the whole transfer of electrons from Ba to O, indicating the ionic character between Ba and O. Ionic bonding occurs because of the difference of the electronegativity (Pauling scale) between Ba and O atoms being 2.19. However, distribution transforms from spherical to an almost dumbbell shape along the chain of Ta–O–Tm and Ta–O–Er. Thus, this reveals the overlapping of states among Tm–O and Ta–O in Ba2TmTaO6 and Er–O and Ta–O in Ba2ErTaO6, which reflects the covalent nature of bonding between the atoms. Due to the increase in the electronegativity from Ba (0.89) to Tm (1.25), Ta (1.50), and Er (1.24) the nature of the bonding changes from ionic to covalent. From the overall charge distribution, it is evident that both the alloys have polar covalent (admixture of ionic and covalent) bonding.3.4 Magnetic properties and magnetic susceptibility
The GGA approximation usually provides the quenched orbital moment for transition-metal oxides, which results in diffusive d-orbitals accompanied by stronger interactions. By GGA + U calculation, the on-site Coulomb energy “U” was considered, and the spin moments of all transition metal atoms were expected to be enhanced due to the localization and enhanced exchange integral. So, in general, the on-site ‘U’ slightly enhances the orbital moments of the transition-metal ions in double perovskites because of the stronger orbital polarization in the d-orbital. The polarization of the spin results in the creation of significant magnetic moment by Er and Tm via the GGA + U method atoms, while other atoms display feeble magnetic moments. The main source of magnetization in Ba2MTaO6 is due to the 4f orbital. As a result, the atoms with 4f electrons carry most of the magnetic moment with a little contribution of O atoms. In the presence of diffusive 6s valence configuration and the ionic behavior of the alkaline earth metal element, the magnetic moment of the Ba atoms is negligible. The spin magnetic moment of oxygen atoms is small because of the nearly closed 2p shell. The magnetic moment of the tantalum atom is also negligibly small in spite of the stronger spin–orbit interaction in the 5d orbital. This results from the larger size of 5d orbital and thus enhanced crystal field. Thus, half-metallicity along with spin-polarized character and high magnetic moments will facilitate their application in spintronic devices.The magnetic susceptibility defines the magnetic behavior of the materials in the applied field. The magnetic susceptibility (χ) and inverse susceptibility (χ−1) for both compounds are plotted in Fig. 7. From Fig. 7, we determined that the magnetic susceptibility (χ) shows a decreasing trend with increasing temperature. In the case of Ba2ErTaO6, χ shows a considerable decrease from 50–300 K, while the change is insignificant from 300 K to 800 K. In the case of Ba2TmTaO6, χ shows a decreasing trend of up to 500 K and then remains almost constant. The decrease in the magnetic susceptibility may be due to the deterioration in the alignment of the magnetic moment due to thermal agitation. The Curie Weiss law of paramagnetism is justified by the Weiss constant (θ) for Ba2ErTaO6 and Ba2TmTaO6 at 0 K. The magnitude of the magnetic susceptibility for both compounds at room temperature for Ba2ErTaO6 is 9 × 10⁻⁹ emu mol−1 and is 8.23 × 10⁻⁹ emu mol−1 for Ba2TmTaO6, respectively. So, inverse susceptibility curves also favor the paramagnetic phase in both Ba2ErTaO6 and Ba2TmTaO6.
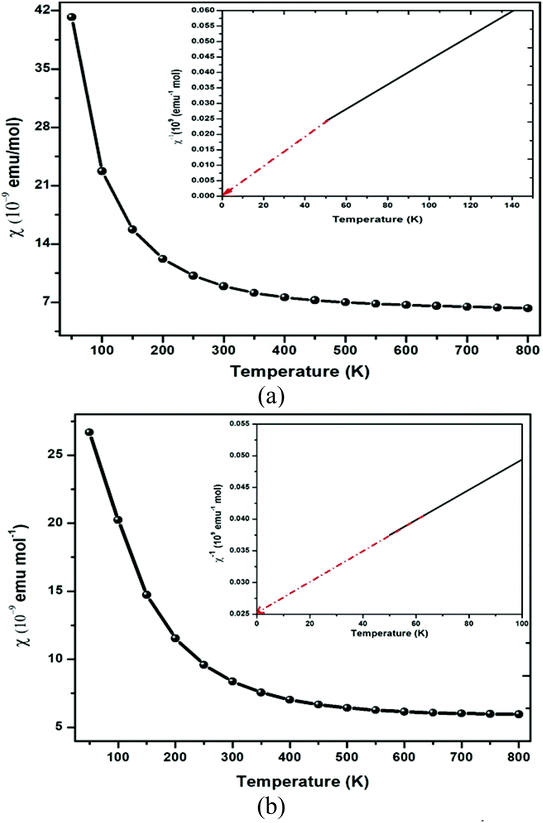 | ||
| Fig. 7 Magnetic susceptibility (χ) and inverse of magnetic susceptibility (χ−1) plot versus temperature of (a) Ba2ErTaO6 and (b) Ba2TmTaO6. | ||
3.5 Cohesive energy
Cohesive energy (Ecoh) is the energy required to split a solid into its component atoms or into elementary structural blocks. This energy plays an important role in the stability of compounds. The larger the cohesive energy of a compound, the more robust will be its stability. This energy signifies how strongly atoms are held together in solid. The general equation for the cohesive energy per atom of an alloy AxBy with x and y denoting number of A and B atoms, respectively, is given by the relation:39EAxBy is the equilibrium energy of an alloy obtained at optimization. In the case of double perovskites, the cohesive energy can be calculated as:
The calculated value per atom is 6.03 eV per atom for both compounds. The obtained values indicate that the atoms are strongly held to form the crystal.
3.6 Elastic properties
Elastic properties determine the response of the crystal to applied stress and the ability of the crystal to regain its shape upon the removal of the deforming force. Elastic properties also help to understand the mechanical stability of the compound including its strength, hardness, durability, reliability, binding forces and performance of the material. We determined the elastic constants (Cij) and other interrelated properties. For cubic crystals, the necessary criteria for existence in the stable phase were determined on the basis of the mechanical stability condition satisfying the Born–Huang stability criteria:40| C11 > 0, C44 > 0, C11 − C12 > 0, C11 + 2C12 > 0, and C12 < B < C11 |
From the computed values of Cij, it was found that both materials followed the stability criteria and were mechanically stable. By using the above elastic constants, various properties of the materials were calculated as presented in Table 2. The bulk and shear moduli, which define the hardness of the material was given by the Voigt–Hill method. The Voigt bounds of the bulk modulus (BV) and shear modulus (GV) for the cubic systems are:41
| Parameter | Ba2ErTaO6 | Ba2TmTaO6 |
|---|---|---|
| C11 | 262.79 | 263.32 |
| C12 | 33.00 | 32.25 |
| C44 | 59.44 | 60.40 |
| Cp | −26.44 | −28.15 |
| B | 109.59 | 109.27 |
| Y | 201.17 | 202.49 |
| GV | 94.82 | 95.35 |
| GR | 73.66 | 74.65 |
| G | 84.24 | 85.00 |
| ν | 0.19 | 0.19 |
| B/G | 1.30 | 1.28 |
| A | 0.51 | 0.52 |
| ρ | 19.78 | 19.96 |
| vt | 2065 | 2065 |
| vl | 3348.13 | 3573.93 |
| vm | 5673.60 | 5809.10 |
| θD | 925.83 | 950.00 |
| Tm | 2106.35 | 2109.00 |
Also, the Reuss formula for the bulk and shear moduli are:
The Hill approximation is used to calculate bulk and shear (B, G) can be calculated as:42
The Young's modulus (Y) and Poisson's ratio (ν) are calculated from Hill's bulk and shear (B, G) elastic moduli by the following equations:
The Young's modulus measures the stiffness of a material. The higher the value of Y, the more stiff the nature of the material. Ba2MTaO6 had a larger value of Y, indicating its stiff nature. Also, Y > B indicating that these alloys are super hard materials. The ductile or brittle nature of materials can be calculated by Cauchy's pressure (CP = C12 − C44), which relates the nature of atomic bonding. Materials of brittle nature with directional bonding shows a negative value of Cp and is positive for metallic bonding with ductile nature. Both these materials have negative CP, indicating the brittle nature of these compounds. Pugh's ratio (B/G) also determines the brittle or ductile nature of materials. The critical value that separates brittle and ductile materials is 1.75; the high value is associated with ductility, and the low value is associated with brittle nature. Both these compounds have (B/G) of less than the critical value verifying their brittle nature. Another criterion to confirm the ductile or brittle nature of an alloy is Poisson's ratio. The critical value of Poisson's ratio to differentiate brittle and ductile materials is 0.26. Materials with 0.26 < ν < 0.5 are regarded as ductile, while for 0.12 < ν < 0.26, they are regarded as being brittle. Since both compounds have ν = 0.19, it also confirmed their brittle nature. The measure of the degree of elastic anisotropy is given by Zener anisotropy factor,  . For a completely isotropic material ‘A’ = 1; otherwise, the material is anisotropic. Both materials having an ‘A’ of less than 1 implies the anisotropic nature of these compounds.
The Debye temperature of a material can be estimated by the classical method using average sound velocity vm:43
The average velocity vm can be approximated using longitudinal velocity (vl) and transverse velocity (vt):
Using these values, we obtained the value of θD, which is equal to 925.83 K for Ba2ErTaO6 and 950 K for Ba2TmTaO6.
The melting temperature Tm can be evaluated from elastic constants using relation:45
| Tm (K) = [553 + (5.911)C11] ± 300 K |
The calculated melting temperature of Ba2ErTaO6 came out to be 2106.35 ± 300 K and for Ba2TmTaO6 was found to be 2423 ± 300 K, respectively.
3.7 Optical properties
The optical properties are important for possible application in optoelectronics and solar cell applications. The optical properties were calculated from the frequency-dependent dielectric function ε(ω) as:| ε(ω) = ε1(ω) + iε2(ω) |
where P implies the principal value of the integral, and ω′ represents the complex angular frequency. From dielectric function, various other properties could be calculated such as refractive index (n(ω)) and coefficient of extinction (K(ω)) as:
| (ε(ω)) = (n(ω) + iK(ω))2 |
These equations led to ε1(ω) = n2(ω) − k2(ω) and ε2(ω) = 2n(ω)k(ω)
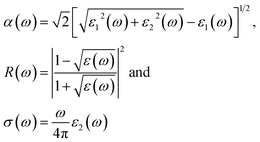
These equations can be used to obtain the values of n(ω) and k(ω). From ε1(ω) and ε2(ω), the values of the absorption coefficient α(ω), reflectivity R(ω) and optical conductivity σ(ω) are derived as:
From the total dielectric function, the energy loss function L(ω) can be calculated using
The optical absorption coefficient determines how deep light of a particular wavelength can penetrate before it is absorbed. The variation of the optical absorption coefficient α(ω) with respect to photon energy is shown in Fig. 8(a). For Ba2ErTaO6, the absorption starts from 4 eV up to 14 eV with the highest peak being at 160 × 104 cm−1 at the energy value of 11 eV. In the case of Ba2TmTaO6, the absorption starts from zero photon energy and occupies the highest peak of 170 × 104 cm−1 at 13.8 eV. Therefore, the optically active region for both these perovskites is UV, and the IR spectrum and can absorb all the frequencies in this region. The optical conductivity spectrum of Ba2MTaO6 compounds is displayed in Fig. 8(b). The optical conductivity spectrum starts from the origin and displays a highest peak at 7 eV for Ba2ErTaO6 and at 9.5 eV for Ba2TmTaO6, as seen in Fig. 8(b). These peaks are mainly due to M = Er, Tm states which play a dominant role in the overall electronic structure and optical response of the material.
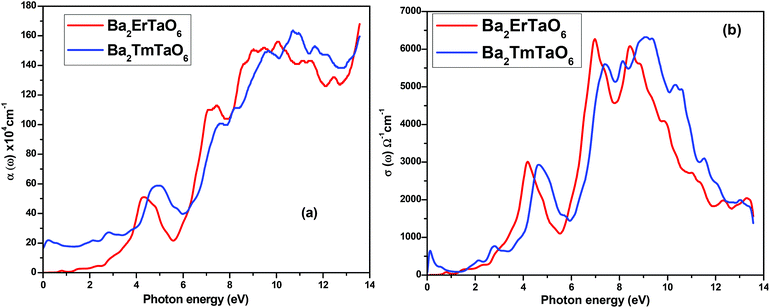 | ||
| Fig. 8 (a, b) The variation of the optical absorption coefficient and optical conductivity with photon energy for Ba2MTaO6 (M = Er, Tm). | ||
In order to understand the interaction of light with matter, it is very essential to study the nature of the refractive index and the extinction coefficient. The refractive index is obtained from the real part of dielectric function and provides information about the phase velocity, while as an imaginary part, k(ω) termed as an extinction coefficient indicates the amount of loss in the absorption when electromagnetic wave propagates through the material. The refractive index and extinction coefficients plots are shown in Fig. 9(a) and (b). From these figures, we see that the highest peak for the refractive index has a magnitude of 8 at 4.3 eV and 7 at low energy values, as seen in Fig. 9(a). The extinction coefficient is highest at 9 eV, implying that absorption is also prominent at 9 eV. Also, the extinction coefficient has a highest peak magnitude of 4 at 9 eV for Ba2ErTaO6, while it is in the low-energy region for Ba2TmTaO6, as displayed in Fig. 9(b).
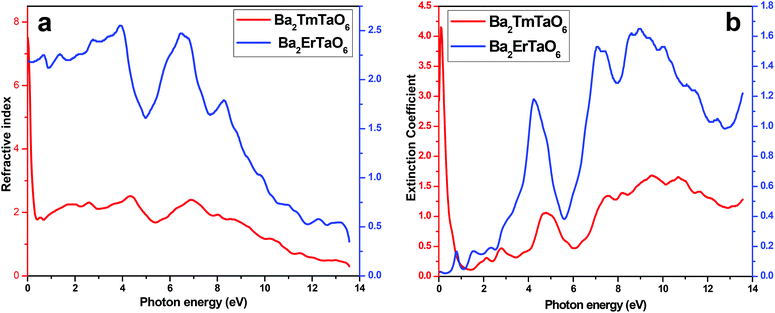 | ||
| Fig. 9 (a, b) The variation of the refractive index and extinction coefficient with photon energy for Ba2MTaO6 (M = Er, Tm). | ||
The electron energy loss as a function of photon energy is shown in Fig. 10(a). It describes the optical spectra and excitations produced by fast-moving electrons. The electron energy loss is due to electron excitations occurring when a fast-moving electron traverses through a material. The most prominent peak for both compounds is seen at about 14 eV, as shown in Fig. 10(a). The prominent peaks in the loss function versus photon energy represent the characteristic plasma resonances occurring at the plasma frequency. The spectrum of reflectivity R(ω) as a function of photon energy is shown in Fig. 10(b), which starts from the origin. Reflectivity is the ratio of the energy of the reflected wave from the surface to the energy of the wave incident on the surface. From Fig. 10(b), we see that reflectivity has a highest peak at 0.65 for Ba2TmTaO6 and at 0.6 for Ba2ErTaO6.
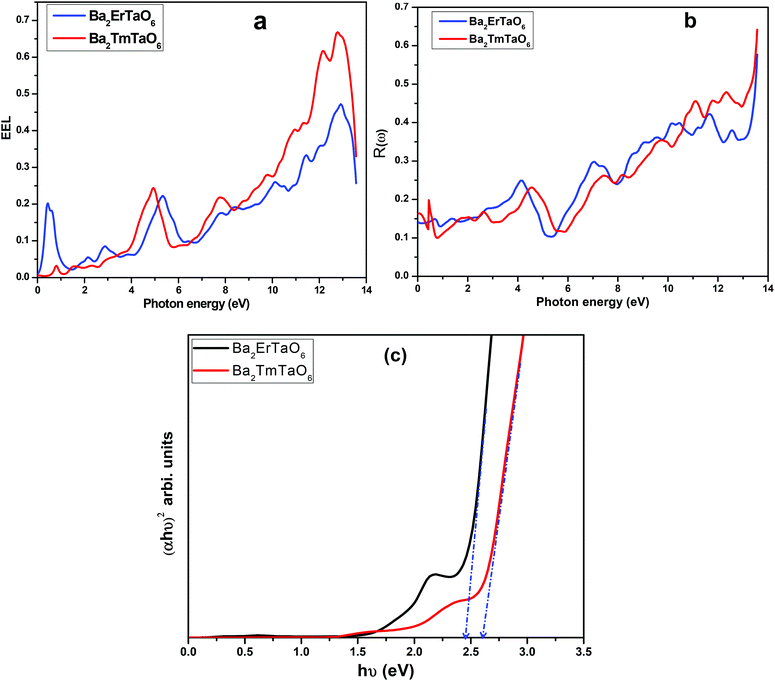 | ||
| Fig. 10 (a, b) The variation of reflectivity and electron energy loss function with photon energy for Ba2MTaO6 (M = Er, Tm). (c): (αhν)2 versus hν plots for Ba2MTaO6 (M = Er, Tm). | ||
The optical energy gaps were determined using the Tauc plots46 along with the transmission spectra data and are shown in Fig. 10(c). Bandgaps for Ba2MTaO6 (M = Er, Tm) were observed to be 2.45 eV and 2.60 eV, respectively, which are close to the optimum value obtained by the band structure calculations.
3.8 Thermodynamic properties
In this section, we present the variation of thermodynamic properties with temperature and pressure. To calculate the thermodynamic properties of layered Ba2MTaO6 (M = Er, Tm), we used the quasi-harmonic Debye model via Gibbs2.33 We studied properties such as (i) specific heat (Cv), (ii) the thermal expansion coefficient (α), and (iii) the Grüneisen parameter (γ) in the temperature range of 0–800 K and the pressure range of 0–30 GPa.(i) Specific heat (Cv): the specific heat not only provides information about vibrational properties but is also useful in many applications. Since in solids, the volume doesn't change appreciably with temperature, we have, hence, computed the specific heat at constant volume Cv in the temperature range of 0–800 K and the pressure range of 0–30 GPa, as displayed in Fig. 11. For both compounds, we observed that Cv increases with increasing temperature. This is because of the fact that with increasing temperature, the atomic vibrations become more vigorous and then reaches a constant value at high temperatures, following Dulong–Petit law. However, at low temperatures, Cv changes abruptly with temperature, obeying Debye T3 law. It can also be seen that as the pressure increases, Cv decreases, but this decrease in Cv with pressure is insignificant.
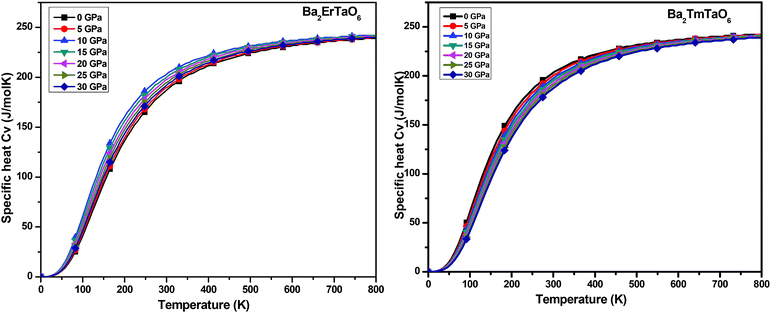 | ||
| Fig. 11 The variation of specific heat (Cv) of Ba2MTaO6 (M = Er, Tm) with temperature at different pressures. | ||
(ii) Thermal expansion coefficient (α): the thermal expansion coefficient quantity describes how the dimensions of an object change upon application of the thermal gradient. It consists of three contributions, namely phonons, conduction electrons and f electron contributions, i.e., ΔL = ΔLphonon+ ΔLe+ΔLf. It is temperature derivate of normalized length change ΔL/L. The variation of α with temperature for both compounds at various pressures is displayed in Fig. 12. We understand from this figure that α initially increases rapidly with temperature up to 550 K and then reaches an almost constant value, while the pressure dependence shows a reverse effect, i.e., the value of α decreases with increasing pressure although the change is very small. Both perovskites possess cubic symmetry, but the perovskite-type structure confers an anisometric structure. It is known that perovskite-type structures are sensitive to structural distortions; hence, both pressure and temperature can give rise to inclinations and/or the rotation of octahedral M–O6 (M = Er, Tm) and Ta–O6, elongation of the structure in certain crystallographic directions and eventual contractions in other directions. This type of response in α(T) is associated with the type of distortion or transition that occurs because of the application of temperature and pressure. Thus, in general, the thermal expansion coefficient gives a similar effect, as shown by the specific heat. Therefore, at low temperatures, α will be expressed as a summation of T-linear and T3 power law, which arises from conduction electrons and phonons, respectively.
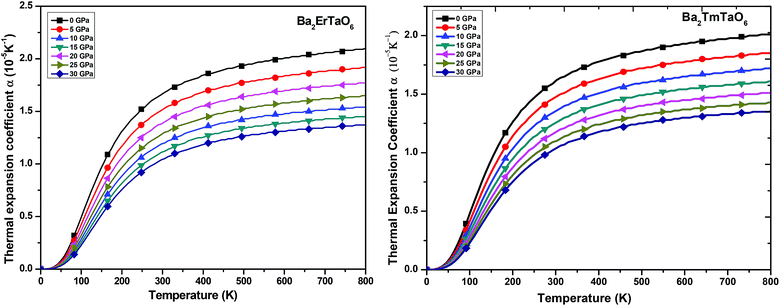 | ||
| Fig. 12 The variation of the thermal expansion coefficient of Ba2MTaO6 (M = Er, Tm) with temperature at different pressures. | ||
(iii) Grüneisen parameter (γ): the Grüneisen parameter (γ) is used to describe the anharmonic effects of the lattice. It is used to characterize the thermodynamic behavior at high temperatures and high pressures. It also shows us the macroscopic behavior of solids. The variation of γ with temperature is displayed in Fig. 13. From Fig. 13, it can be concluded that γ remains almost constant and doesn't change with temperature. The obtained values of γ at zero temperature and zero pressure for Ba2ErTaO6 is 2.13 and changes to 1.96 at 30 GPa, and for Ba2TmTaO6 it is 2.07 and decreases to 1.92 at 30 GPa.
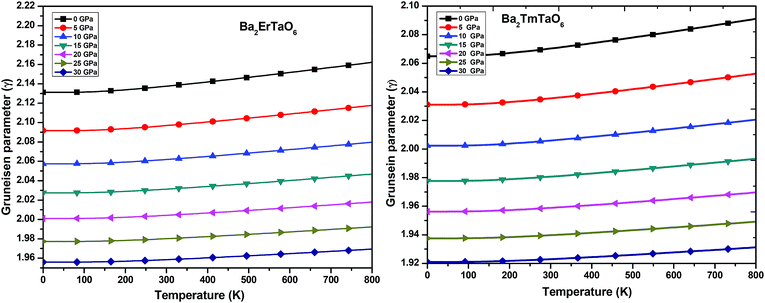 | ||
| Fig. 13 The variation of the Grüneisen parameter of Ba2MTaO6 (M = Er, Tm) with temperature at different pressures. | ||
3.9 Thermoelectric properties
For the conversion of ravage heat into useful energy worldwide, there is a search for smart thermoelectric materials that fulfill our energy demands. The effectiveness of thermoelectricity is given by the dimensionless quantity called the figure of merit (ZT). Generally, the ZT is given by ZT = S2σT/κ,47,48 where S is the Seebeck coefficient (also known as thermo-power), σ is electrical conductivity, T is the absolute temperature and κ is the total thermal conductivity. The attendance of large flat bands at the valence band corresponding to a larger effective mass and more dispersive nature at the valence band maxima dictates that these compounds shall prove to be promising materials for generating thermoelectricity. This motivated us to estimate the thermoelectric properties of these materials. From the PDOS, we see the contribution of electrons from different atomic orbitals to the Seebeck coefficient (S). The Er/Tm-f states contribute more towards the electrical conductivity and Ta-d states with a little contribution from the O-p states populating the DOS near the Fermi level. Therefore, thermally excited electrons from these orbitals will contribute to the value of S. Transport properties like electrical conductivity (σ/τ), electronic thermal conductivity (κe/τ), where τ is the relaxation time, and the Seebeck coefficient (S) are figured for both these materials. The overall ‘S’ as a function of temperature (T) for the materials is calculated via the two current model given as:49The electrical conductivity (σ) over relaxation time (τ) with temperature is reported in Fig. 14. From this figure, one can see that σ for both compounds decreases in the spin-down state, which confirms the metallic behavior. In the up-spin state, the electrical conductivity increases with temperature, confirming the semiconducting behavior and thus supports the band structure. In the case of the spin-down state of Ba2ErTaO6, the value of σ/τ decreases from 1.24 × 10²⁰ (Ω−1 m−1 s−1) at 50 K to 1.19 × 10²⁰ (Ω−1 m−1 s−1) at 800 K, while in the spin-up state, the value increases from 0.00 × 10²⁰ (Ω−1 m−1 s−1) at 50 K to 0.017 × 10²⁰ (Ω−1 m−1 s−1) at 800 K. In the case of the spin-down state of Ba2TmTaO6, the value of σ/τ decreases from 0.99 × 10²⁰ (Ω−1 m−1 s−1) at 50 K to 0.96 × 10²⁰ (Ω−1 m−1 s−1) at 800 K, while in the spin-up state, the value increases from 0.00 × 10²⁰ (Ω−1 m−1 s−1) at 50 K to 0.022 × 10²⁰ (Ω−1 m−1 s−1) at 800 K.
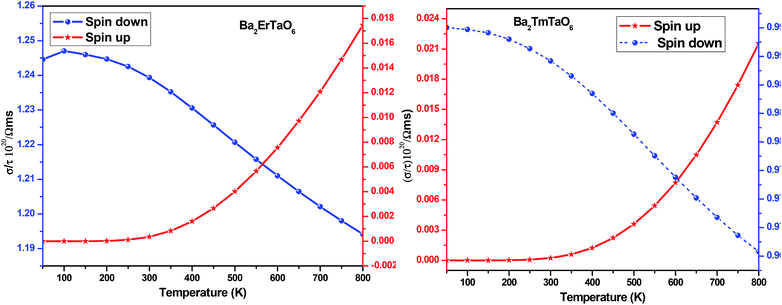 | ||
| Fig. 14 The variation of electrical conductivity (σ/τ) with temperature for Ba2ErTaO6 and Ba2TmTaO6. | ||
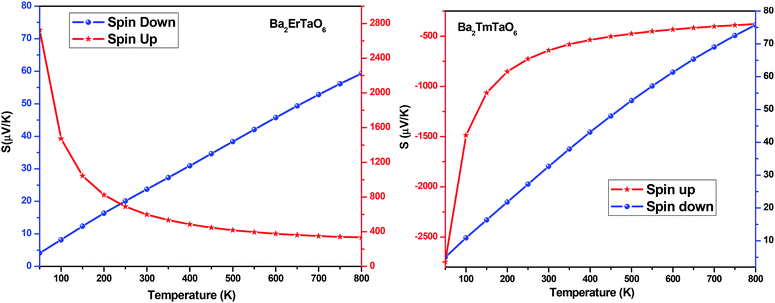
The Seebeck coefficient (S) for both compounds in both spin configurations was computed as a function of temperature and presented in Fig. 15. It was observed that in the case of Ba2ErTaO6, the Seebeck coefficient S is positive in the entire temperature range for both spin states, signifying the existence of p-type (holes) charge carriers. While in the case of Ba2TmTaO6 in the spin-up state, S as a function of temperature is negative, suggesting the existence of n-type charge carriers, in the spin-down state, S is positive, suggesting the existence of p-type charge carriers. The absolute value of S of Ba2ErTaO6 in the spin-down state increases from 5 μV K−1 at 50 K to 60 μV K−1 at 800 K, while in the spin-up state, it decreases from 2700 μV K−1 at 50 K to 300 μV K−1 at 800 K. In the case of the spin-up state of Ba2TmTaO6, the value increases from −2800 μV K−1 at 50 K to −600 μV K−1 at 800 K, while in the spin-down state, it increases from 5 μV K−1 at 50 K to 75 μV K−1 at 800 K.
The temperature variation of the total thermal conductivity (κtot) comprised of the lattice thermal conductivity (κL) and electronic thermal conductivity (κe) is shown in Fig. 16. We obtained the lattice part of thermal conductivity by the semi-classical Debye theory with the help of Slack's equation,49 where A is the physical constant (A ∼ 3.1 × 10⁻⁸), θD is the Debye temperature, γ is the Grüneisen parameter, n is the number of atoms in a primitive unit cell and ‘m’ is the average mass of all atoms in the crystal. It is clear from this figure that for Ba2ErTaO6, the electronic thermal conductivity shows an increasing trend from a small value at 100 K to 2.1 W m−1 K−1 at 800 K, while the lattice thermal conductivity decreases from 2 W m−1 K−1 at 100 K to 0.1 W m−1 K−1 at 800 K. The total thermal conductivity shows a decreasing trend from 2 W m−1 K−1 at 100 K to 2.5 W m−1 K−1 at 800 K. In the case of Ba2TmTaO6, the electronic thermal conductivity increases from a small value at 50 K to 4.2 W m−1 K−1 at 800 K, and the lattice thermal conductivity decreases from 2.6 W m−1 K−1 at 100 K to 0.1 W m−1 K−1 at 800 K. The total thermal conductivity shows a decreasing trend from 2.6 W m−1 K−1 at 50 K to 2.5 W m−1 K−1 at 800 K.
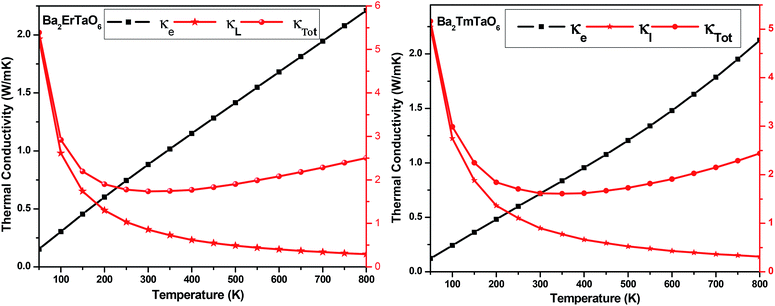 | ||
| Fig. 16 The variation of the lattice thermal conductivity (κL), electronic thermal conductivity (κe) and total thermal conductivity (κTotal) with temperature in Ba2MTaO6 (M = Er, Tm). | ||
The variation of the total Seebeck coefficient for both compounds with temperature is shown in Fig. 17(a). It can be seen from this figure that the total Seebeck coefficient increases almost linearly with temperature in both compounds and achieves a value of 60 μV K−1 for Ba2ErTaO6 and 65 μV K−1 for Ba2TmTaO6.
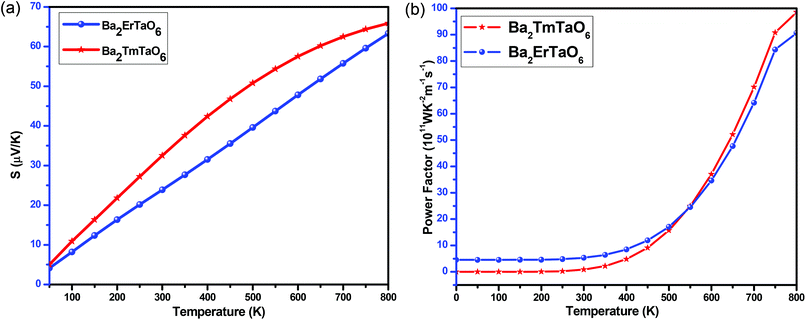 | ||
| Fig. 17 (a, b) The variation of the total Seebeck coefficient (S) and the power factor with temperature for Ba2ErTaO6 and Ba2TmTaO6. | ||
To determine the performance of both compounds, we computed the power factor (PF). Fig. 17(b) shows the dependence of the power factor on temperature and shows that the power factor increases from a small value in the case of Ba2TmTaO6 at 0 K to 90 × 1011 W m−1 K−2 s−1 at 800 K, while in Ba2ErTaO6, it increases from 5 × 10¹¹ W m−1 K−2 s−1 at 0 K to 85 × 1011 W m−1 K−2 s−1 at 800 K. Both materials hold a considerable power factor, which makes them desired for thermoelectric applications.
4 Conclusion
The overall DFT calculated structural, magneto-electronic, mechanical, optical, thermodynamic, and transport properties were calculated by the GGA + U method. Ba2ErTaO6 and Ba2TmTaO6 are stable in cubic structure with paramagnetic phases. The magnetic susceptibility curve confirms that the compounds are stable in the paramagnetic phase. The mechanical stability of the compounds was also confirmed from the elastic constants. Cauchy pressure, Pugh's and Poisson's ratio altogether confirm that both Ba2ErTaO6 and Ba2TmTaO6 are brittle in nature. The cohesive energy calculated for both materials was 6.03 eV per atom. The thermodynamic properties were calculated by the quasi-harmonic Debye model. Both materials possess high Seebeck coefficients and power factors at high temperatures. The reflectivity, electron energy loss, absorption coefficient and conductivity were also calculated. The reflectivity shows that these compounds might be useful for devices operating in the ultraviolet range of the electromagnetic spectrum. The overall properties envisioned confirm that both these alloys can find applications in thermoelectric, spintronic and optoelectronic applications.Conflicts of interest
The authors have no conflict of interest.References
- B. Fisher, K. B. Chashka, L. Patlagan and G. M. Reisner, Phys. Rev. B: Condens. Matter Mater. Phys., 2004, 70, 205109 CrossRef.
- H. Kato, T. Okuda, Y. O. Kimoto and Y. Tomioka, Phys. Rev. B: Condens. Matter Mater. Phys., 2004, 69, 184412 CrossRef.
- A. Dias, L. A. Khalam, M. T. Sebastian and R. L. Moreira, J. Solid State Chem., 2007, 180, 2143 CrossRef CAS.
- T. Shizhe, Z. Junchai, Q. Congde, J. Xiangling and J. Bingzheng, J. Rare Earths, 2006, 24, 679 CrossRef.
- M. Kobayashi, R. Katsuraya, T. Nara, Y. Tomita, H. Nakano and N. Kamegashira, J. Rare Earths, 2006, 24, 668 CrossRef.
- A. Knyazev, A. Ershova and N. Chernorukov, J. Rare Earths, 2009, 27, 4 CrossRef.
- S. Halder, Md. S. Sheikh, B. Ghosh and T. P. Sinha, Ceram. Int., 2014, 43, 11097 CrossRef.
- S. Vasala and M. Karppinen, Prog. Solid State Chem., 2015, 43, 1 CrossRef CAS.
- S. M. Rao, J. K. Srivastava, M. K. Wu, B. H. Mok, C. L. Chen, M. C. Ling, H. L. Liu, Y. Y. Chen and J. C. Ho, J. Supercond. Novel Magn., 2011, 24, 1249 CrossRef CAS.
- K. I. Kobayashi, T. Kimura, Y. Tomioka, H. Sawada and K. Terakura, Phys. Rev. B: Condens. Matter Mater. Phys., 1990, 59, 11159 CrossRef.
- S. A. Khandy and D. C. Gupta, J. Magn. Magn. Mater., 2017, 441, 166 CrossRef CAS.
- M. Li, M. J. Pietrowski, R. A. De Souza, H. Zhang, I. M. Reaney, S. N. Cook, J. A. Kilner and D. C. Sinclair, Nat. Mater., 2014, 13, 31 CrossRef CAS PubMed.
- H. Tanaka and M. Misono, Curr. Opin. Solid State Mater. Sci., 2001, 5, 381 CrossRef CAS.
- N. A. Noor, S. M. Alay-e-Abbas, M. U. Sohaib, S. M. Ghulam Abbas and A. Shaukat, J. Magn. Magn. Mater., 2015, 374, 164 CrossRef CAS.
- N. A. Noor, S. Ali and A. Shaukat, J. Phys. Chem. Solids, 2011, 72, 836 CrossRef CAS.
- N. A. Noor, S. M. Alay-e-Abbas, Y. Saeed, S. M. Ghulam Abbas and A. Shaukat, J. Magn. Magn. Mater., 2013, 339, 11 CrossRef CAS.
- W. T. Fu and D. J. W. Ijdo, J. Solid State Chem., 2006, 179, 1022 CrossRef CAS.
- Y. Doi and Y. Hinatsu, J. Phys.: Condens. Matter, 2001, 13, 4194 CrossRef.
- B. J. Kennedy, P. J. Saines, Y. Kubota, C. Minakata, H. Hano, K. Kato and M. Takata, Mater. Res. Bull., 2007, 40, 1875 CrossRef.
- S. Calder, T. Fennell, W. Kockelmann, G. C. Lau, R. J. Cava and S. T. Bramwell, J. Phys.: Condens. Matter, 2010, 22, 116007 CrossRef CAS PubMed.
- Y. Kanaiwa, M. Wakeshima and Y. Hinatsu, Mater. Res. Bull., 2002, 37, 1825 CrossRef CAS.
- L. Brixner, J. Inorg. Nucl. Chem., 1960, 15, 352 CrossRef CAS.
- P. J. Saines, B. J. Kennedy and M. M. Elcombe, J. Solid State Chem., 2007, 180, 401 CrossRef CAS.
- J. A. Aguiar, C. C. D. Silva, Y. P. Yadava, D. A. L. Tellez, J. M. Ferreira and E. Montarroyos, J. Low Temp. Phys., 1998, 117, 969 CrossRef.
- J. A. Alonso, C. Cascales, P. G. Casado and I. Rasines, J. Solid State Chem., 1997, 128, 247 CrossRef CAS.
- R. Mukherjee, S. Saha, A. Dutta and T. P. Sinha, J. Alloys Compd., 2015, 651, 222 CrossRef CAS.
- V. M. Nair, R. Jose, G. M. A. Kumar, M. M. Yusoff and P. R. S. Wariar, J. Alloys Compd., 2012, 512, 207 CrossRef CAS.
- R. Mukherjee, A. Dutta and T. P. Sinha, Mater. Sci. Semicond. Process., 2015, 39, 67 CrossRef CAS.
- A. Dias, R. G. Sa and R. L. Moreira, J. Raman Spectrosc., 2008, 39, 180 CrossRef.
- M. N. Iliev, P. Padhan and A. Gupta, Phys. Rev. B: Condens. Matter Mater. Phys., 2008, 77, 172303 CrossRef.
- R. Mukherjee, A. Dutta and T. P. Sinha, J. Electron. Mater., 2016, 45, 846 CrossRef CAS.
- K. Schwarz, P. Blaha and G. K. H. Madsen, Comput. Phys. Commun., 2002, 147, 21 CrossRef.
- P. Blaha, K. Schwarz, G. K. H. Madsen, D. Kvasnicka and J. Luitz, WIEN2k, An Augmented Plane Wave Plus Local Orbitals Program for Calculating Crystal Properties, Vienna University of Technology, Vienna, 2001 Search PubMed.
- M. A. Blanco, E. Francisco and V. Luania, Comput. Phys. Commun., 2004, 158, 57 CrossRef CAS.
- G. K. H. Madsen and D. J. Singh, Comput. Phys. Commun., 2006, 175, 67 CrossRef CAS.
- S. Yousuf and D. C. Gupta, Mater. Sci. Eng., B, 2017, 221, 73 CrossRef CAS.
- S. Dimitrovska, S. Aleksovska and I. Kuzmanovski, Cent. Eur. J. Chem., 2005, 3, 198 Search PubMed.
- S. Vasala and M. Karppinen, Prog. Solid State Chem., 2015, 43, 1 CrossRef CAS.
- A. Yakoubi, O. Baraka and B. Bouhafs, Results Phys., 2012, 2, 58 CrossRef.
- M. J. Mehl, J. E. Osburn, D. A. Papaconstantopoulos and B. M. Klein, Phys. Rev. B: Condens. Matter Mater. Phys., 1990, 41, 10311 CrossRef CAS.
- A. Reuss, Z. Angew. Math. Mech., 1929, 9, 49 CrossRef CAS.
- R. Hill, J. Mech. Phys. Solids, 1963, 11, 375 Search PubMed.
- O. L. Anderson, J. Phys. Chem. Solids, 1963, 24, 909 CrossRef CAS.
- P. Ravindran, L. Fast, P. A. Korzhavyi, B. Johansson, J. Wills and O. Eriksson, J. Appl. Phys., 1998, 84, 4891 CrossRef CAS.
- S. A. Khandy, I. Islam, D. C. Gupta and A. Laref, J. Solid State Chem., 2019, 270, 173 CrossRef CAS.
- M. Burhanuz Zaman, T. Chandel and R. Poolla, J. Electron. Mater., 2019, 48, 3194 CrossRef.
- T. M. Bhat and D. C. Gupta, RSC Adv., 2016, 6, 80302 RSC.
- T. M. Bhat and D. C. Gupta, J. Electron. Mater., 2016, 45, 6012 CrossRef CAS.
- T. M. Bhat and D. C. Gupta, J. Phys. Chem. Solids, 2018, 112, 190 CrossRef CAS.
| This journal is © The Royal Society of Chemistry 2019 |

