
 Open Access Article
 This Open Access Article is licensed under a Creative Commons Attribution-Non Commercial 3.0 Unported Licence
Enzyme immobilisation on poly-L-lysine-containing calcium phosphate particles for highly sensitive glucose detection†
Suzuka Kojima ab,
Fukue Nagataa,
Masahiko Inagakiab,
Shinichi Kugimiyab and
Katsuya Kato*a
ab,
Fukue Nagataa,
Masahiko Inagakiab,
Shinichi Kugimiyab and
Katsuya Kato*a
aNational Institute of Advanced Industrial Science and Technology, 2266-98, Anagahora, Shimo-Shidami, Moriyama-ku, Nagoya, Aichi 463-8560, Japan. E-mail: katsuya-kato@aist.go.jp; Fax: +81 52 736 7405; Tel: +81 52 736 7551
bMaterials Chemistry Course, Graduate School of Engineering, Aichi Institute of Technology, 1247 Yachigusa, Yakusa-cho, Toyota, Aichi 470-0392, Japan. E-mail: suzuka-kojima@aist.go.jp
First published on 8th April 2019
Abstract
High catalytic activities of enzymes are necessary for enzyme immobilising technology for the development of glucose sensors. The aim of this study is to synthesise two types of poly(L-lysine)-containing calcium phosphate particles (pLys-HAp) and to achieve the immobilisation of glucose oxidase (GOX) on them. The oxidation activity of GOX immobilised on these particles was more than 80% compared to that of native GOX (considered to be 100%). Additionally, the relative activity of GOX immobilised on poly-ε-lysine-containing HAp (ε-pLys-HAp) remained approximately 70% after ten cycles. Moreover, glucose detection was able to be performed in the linear range of 4–400 μM using GOX immobilised on pLys-HAp composites. In the direct electrochemistry measurement using the cyclic voltammetry (CV) method, a glassy carbon electrode (GCE) modified by ε-pLys-HAp was a good enzyme electrode and can be used for glucose detection with high sensitivity. From these results, poly(L-lysine)-containing HAp composites can be expected to be enzyme immobilisation agents with high stability and biosensors with high sensitivity.
1. Introduction
Nowadays, many people have come to problematise the increase in the number of patients having lifestyle related diseases compared to before. These lifestyle diseases include high blood pressure, diabetes mellitus, cancer, apoplectic stroke and heart disease. It is very important to discover them early before getting sick and to prevent serious illness. Sensors play key roles for early detection. In particular, the development of biosensors has flourished recently.1–6 Wu et al. suggested a sensitive electrochemical biosensor for detection of double-stranded deoxyribonucleic acid.7 Li et al. reported a fluorescence biosensor with an ultra-low limit of detection for folate receptors, which can be used for the observation of early cancer.8 In addition, Shtenberg et al. studied nanostructured porous Si sensors for the detection of heavy metal ions in water by immobilising horseradish peroxidase, laccase and multi-copper oxidase.9Glucose oxidase (GOX) is a key enzyme for biosensors and can catalyse the oxidation of glucose. For example, GOX can be used as a blood sugar level sensor for diabetic patients by measuring the glucose concentration in their blood.10,11 Insulin dependent diabetic patients need to control their blood sugar levels. Some of these sensors used as disposable sensors are growing. However, the catalytic activities of GOX are hard to stabilise during the repeated recognition of glucose. Therefore, enzyme immobilising technology that can improve the stability by immobilisation enzymes on carriers has been widely used in the present biosensor technologies.12–14
Additionally, GOX immobilising technologies15–18 have been widely used for other applications instead of blood sugar level sensors. Wang et al. published that the GOX immobilisation can be applied for biofuel cell (BFC) and used as a detector for microRNA-21 (miRNA-21).19 The BFC-based self-powered sensors utilised gold nanoparticles with bare paper fibres as bioelectrodes to wire GOX and bilirubin oxidase. The sensitive detection of miRNA-21 reached over a range of 5 fM to 100 pM with a detection limit of 2.7 fM.19 Thus, these technologies have explored the range of applications such as other biosensor and biofuel cell.20,21 It can be said that the catalytic activities of GOX become important for electrical output power and sensor sensitivity.
Hydroxyapatite (Ca10(PO4)6(OH)2, HAp) is well known as a type of a calcium phosphate compound with strong affinity for various proteins. It has been frequently reported that HAp has been used as an enzyme immobilising agent.22 Bharath et al. prepared a glucose sensor by immobilisation of GOX on reduced graphene oxide sheets with HAp nanorods modified GCE, and these sensor indicated high sensitivity and stability by amperometric glucose determination.23 In our previous study, we reported that peptide-containing calcium phosphate particles (peptide-HAp) can selectively adsorb proteins.24 The selective adsorption of proteins was the result of electrostatic interactions between peptide-HAp and the protein, and these materials were expected to work as carrier materials for proteins.24 Furthermore, the high adsorption ability of avidin on poly(α-glutamic acid) or poly(γ-glutamic acid) containing HAp (pGlu-HAp) and its efficient binding activity to biotin were also reported.25 It revealed that the morphologies of two pGlu-HAp materials showed plate-like or sheet-like particles due to the effects of peptide structure. The higher maximum adsorption amount for avidin on α-pGlu-HAp was due to the difference in the density of carboxyl groups in pGlu-HAp. In conclusion, it revealed that peptide-HAp is a useful composite for development of a biosensor.
Many researchers have reported the synthesis of silica materials in the presence of poly-L-lysine as a template.26–29 However, few researchers have reported the calcium phosphate fabricated using poly-L-lysine. Bradley et al. prepared the hydroxyapatite composited with polysaccharides (such as chondroitin sulfate and polygalacturonic acid) or poly amino acid (like poly-L-asparagine and poly-L-lysine).30 Gao et al. reported that poly-ε-lysine was introduced to the surface of bacterial cellulose nanofibers via crosslinking for bone-like apatite deposition, and its nanocomposites were expected to be adapted for applications in bone tissue engineering.31 Ding et al. synthesised poly-L-lysine/HAp/carbon nanotube hybrid biocomposite scaffolds for antibody immobilisation.32 Thus, it can be considered that these biopolymer-hydroxyapatite composites, especially poly-ε-lysine, can find wide applications.
Herein, we report that two types of poly-L-lysine (poly-α-lysine and poly-ε-lysine) were compounded with HAp to form new poly-lysine containing HAp (pLys-HAp) particles. The aim of this study was to prepare pLys-HAp composites as an enzyme immobilising agent and to immobilise large quantities of GOX with high catalytic activity and high stability. Moreover, we examined the effect of peptides having different structures for these materials and the adsorption properties. The morphologies of the as-synthesised particles were observed, and the oxidative activities were analysed by GOX immobilised on the surface of the samples. Furthermore, we investigated the application as a glucose sensor by immobilised GOX on a glassy carbon electrode (GCE).
2. Experimental
2.1 Materials
All chemicals were of analytical grade and used without further purification. ε-Polylysine (ε-pLys) with molecular weight (Mw) of 4000 was received from JNC CO., Tokyo, Japan. Poly(L-lysine hydrobromide) (α-pLys; Mw > 12![[thin space (1/6-em)]](https://www.rsc.org/images/entities/char_2009.gif) 000) was purchased from Peptide Institute, Inc. (Osaka, Japan). Calcium acetate monohydrate [(CH3COO)2Ca·H2O], diammonium hydrogen phosphate [(NH4)2HPO4], Dulbecco's PBS (−), D(+)-glucose, ethanol, 4-aminoantipyrine (4-AAP) and phenol crystals were obtained from Wako Pure Chemical Industries (Osaka, Japan). Glucose oxidase (GOX) from Aspergillus niger (isoelectric point (pI) = 4.2, Mw = 160000 Da), graphene oxide, peroxidase from horseradish (POD, pI = 7.2, Mw = 40200 Da), 8-anilino-1-naphthalenesulfonic acid (ANS) and Rhodamine B isothiocyanate (Rhodamine B) were purchased from Sigma-Aldrich Co. (St. Louis., MO, USA). The Bio-Rad protein assay dye reagent concentrate was obtained from Bio-Rad Laboratories (Hercules, CA, USA).
000) was purchased from Peptide Institute, Inc. (Osaka, Japan). Calcium acetate monohydrate [(CH3COO)2Ca·H2O], diammonium hydrogen phosphate [(NH4)2HPO4], Dulbecco's PBS (−), D(+)-glucose, ethanol, 4-aminoantipyrine (4-AAP) and phenol crystals were obtained from Wako Pure Chemical Industries (Osaka, Japan). Glucose oxidase (GOX) from Aspergillus niger (isoelectric point (pI) = 4.2, Mw = 160000 Da), graphene oxide, peroxidase from horseradish (POD, pI = 7.2, Mw = 40200 Da), 8-anilino-1-naphthalenesulfonic acid (ANS) and Rhodamine B isothiocyanate (Rhodamine B) were purchased from Sigma-Aldrich Co. (St. Louis., MO, USA). The Bio-Rad protein assay dye reagent concentrate was obtained from Bio-Rad Laboratories (Hercules, CA, USA).
2.2 Preparation of pLys-HAp particles
Poly-L-lysine-containing HAp (pLys-HAp) was synthesised as follows: poly(α-lysine) or poly(ε-lysine) (20, 30 or 40 mg) was mixed with 200 mL (NH4)2HPO4 solution (9 mM). The solution was further stirred for 30 min at 20 °C. The mixture was added to a 200 mL (CH3COO)2Ca solution (15 mM) and heated to 60 °C (heating rate of 1 °C min−1), before it was kept for 3 h at the same temperature. The solid materials were separated by centrifugation at 6000 rpm for 10 min and washed with deionised water twice. The final products were obtained via a freeze-drying process.2.3 Characterisation of synthesised pLys-HAp
Field-emission scanning electron microscopy (FE-SEM, S-4300, Hitachi Ltd., Tokyo, Japan) was used to investigate the morphologies of samples at an acceleration voltage of 10.0 kV. Transmission electron microscopy (TEM) images were taken using a JEM-2010 (JEOL Ltd., Tokyo, Japan) at an accelerator voltage of 200 kV. TriStar 3000 (Shimadzu Co., Kyoto, Japan) was used to measure the nitrogen (N2) adsorption–desorption isotherms. The specific surface area, pore volume and pore size distribution were calculated via the Brunauer–Emmett–Teller (BET) and the Barrett–Joyner–Halenda (BJH) methods. Inductively coupled plasma optical emission spectrometry (ICP-OES, IRIS Advantage, Thermo Fisher Scientific Inc., Waltham, MA, USA) was used to determine the Ca/P molar ratio of pLys-HAp. Powder X-ray diffraction spectra were obtained using a SmartLab SE/B1 (Rigaku Co., Tokyo, Japan) with CuKα radiation generated at 40 kV and 30 mA. The scanning speed was 2.0° min−1 and the 2θ range varied from 3.0° to 60.0°. Fourier-transform Infra-Red (FT-IR) spectra were measured to confirm the presence of HAp and peptide in pLys-HAp using FT/IR-4700 spectrometer (JASCO Co., Tokyo, Japan) in the range of 400–4000 cm−1. The contents of calcium, nitrogen and phosphorus of pLys-HAp were analysed using a scanning transmission electron microscopy (STEM, JEM-2100 Plus instrument operated at 200 kV, JEOL Ltd., Tokyo, Japan) and an energy dispersive X-ray spectroscopy (EDX, Noran System 7, Thermo Fisher Scientific Inc., Waltham, MA, USA) analysis. To determine the relative amount of peptide in the composites, thermogravimetry and differential thermal analysis (TG-DTA) was performed with a Thermo Plus TG 8120 (Rigaku Co., Tokyo, Japan). The reaction temperature was increased from room temperature to 1000 °C at a heating rate of 10 °C min−1. The zeta-potential of pLys-HAp was obtained using a zeta-potential analyser (ELSZ-1000, Otsuka Electronics Co., Tokyo, Japan). The particles were prepared by dispersion in 10 mM phosphate buffer (pH = 7.0) and sonication for 3 min.2.4 GOX adsorption on pLys-HAp
First, the initial GOX solution was prepared to set the concentration to 500 μg mL−1. Each 5 mg of pLys-HAp was added to different amounts of GOX solution (1–3 mL) and stirred overnight at 20 °C. The supernatant was collected by centrifugation at 6000 rpm for 10 min. The excess GOX amounts in the supernatant were calculated according to the Bradford method using Bio-Rad protein assay via UV-vis spectroscopy (Infinite F200 PRO, Tecan Group Ltd., Männedorf, Switzerland) at λ = 595 nm. The adsorption amounts of GOX was determined by subtracting the excess amounts of GOX from the initial GOX amounts using the following equation:33
 | (1) |
2.5 The amino group density in pLys-HAp
The density of amino group in pLys-HAp samples to be used by enzyme adsorption was analysed. Each pLys-HAp materials (1 mg) were mixed with 1 mL of Rhodamine B solution (40 μg mL−1). After stirring overnight at 20 °C in the dark, the precipitant was separated by centrifugation at 14000 rpm for 5 min. The solid materials were washed four times with 10 mM phosphate buffer at pH 7.0 and resuspended in 10 mM phosphate buffer (1 mL). The amino group density in the suspension was determined using a spectrofluorophotometer RF-5300PC (Shimadzu Co., Kyoto, Japan). The excitation and emission wavelengths were set as 555 and 580 nm, respectively.
2.6 Conformational changes in immobilised GOX on pLys-HAp
The changes of the three-dimensional structures of GOX by the adsorption on pLys-HAp samples were confirmed by ANS method.34–37 GOX (500 μg) was immobilised on α-pLys-HAp (40 mg) and ε-pLys-HAp (40 mg) during the overnight stirring at 20 °C. Furthermore, ANS solution (50 μg mL−1 in 10 mM phosphate buffer at pH 7.0) was added to the suspension. The mixture was incubated at 20 °C for 3 h in the dark. Finally, the fluorescence spectra were obtained by spectrofluorophotometer (the excitation wavelengths: 387 nm, the fluorescence wavelengths: 400–600 nm).2.7 The oxidative activity of GOX on pLys-HAp and enzyme kinetics
GOX was dissolved in 10 mM phosphate buffer at pH 7.0 and the concentration was set to 30 μg mL−1. Other solutions such as 4 mM glucose, 1.76% 4-AAP, 6% phenol and 1 mg mL−1 POD solution were prepared using the same buffer. Each pLys-HAp sample (1 mg) was added to 1 mL of GOX solution and the mixture was stirred overnight at 4 °C. After removing the supernatant by centrifugation at 14000 rpm for 5 min, 80 μL of 4 mM glucose and 850 μL of 10 mM phosphate buffer were mixed with the solid material. The mixture was stirred at 25 °C for 3 min, and 20 μL of 1.76% 4-AAP, 20 μL of 6% phenol and 30 μL of 1 mg mL−1 POD solution were added to the mixture. The mixture was incubated at 25 °C for 3 min and the supernatant was separated by centrifugation at 14000 rpm for 3 min. The absorbance of product in the supernatant at 500 nm was analysed with UV-vis spectrophotometer DU 800 (Beckman Coulter Inc., IN, USA).
The enzyme catalytic kinetics were measured with different concentrations of 4-AAP and calculated from the Lineweaver–Burk equation:38–41
 | (2) |
2.8 Electrochemical measurement
The direct electrochemistry of the sample modified glassy carbon electrode (GCE) was investigated by cyclic voltammetry (CV) method using automatic polarisation system HSV-110 (HOKUTO DENKO Co., Tokyo, Japan). The electrochemical measurement was carried out in a three-electrode cell consisting of the GCE, platinum wire as the counter electrode and Ag/AgCl saturated KCl as the reference electrode. The GCE was polished to obtain the mirror-like surface by alumina-in-water slurry. After cleaning with deionised water and ethanol, the electrode was dried at 25 °C.Each pLys-HAp (1 mg) was mixed with 1 mL of GOX solution (150 μg mL−1 in 10 mM phosphate buffer at pH 7.0) and stirred overnight at 20 °C. After removing the supernatant from the mixture by centrifugation at 14000 rpm for 5 min, the solid material was redispersed in 100 μL of the same buffer by sonication for 3 min. The GOX/pLys-HAp mixture (20 μL) was added to 20 μL of aluminium silicate nanotube hydrogels (imogolite)42 and 20 μL of graphene oxide, and the suspension (20 μL) was dropped on GCE. After the electrode was dried for 45 min at 25 °C, the measurements were performed in O2-saturated Dulbecco's PBS (pH 7.3) at a scan rate of 100 mV s−1 with the addition of various concentrations of glucose.
3. Results and discussion
3.1 The morphologies of pLys-HAp and their characterisation
The morphologies of the poly-lysine-containing HAp composites were analysed by FE-SEM and TEM. The particles having round tips were observed and their particle sizes were ∼60 nm as shown in Fig. 1(a–f). However, there were no significant changes in the morphologies of pLys-HAp in comparison with pure HAp by increasing the amount of peptides. It indicated that quite few peptides were included in these materials and the particle morphologies were not affected by the presence of poly-lysine.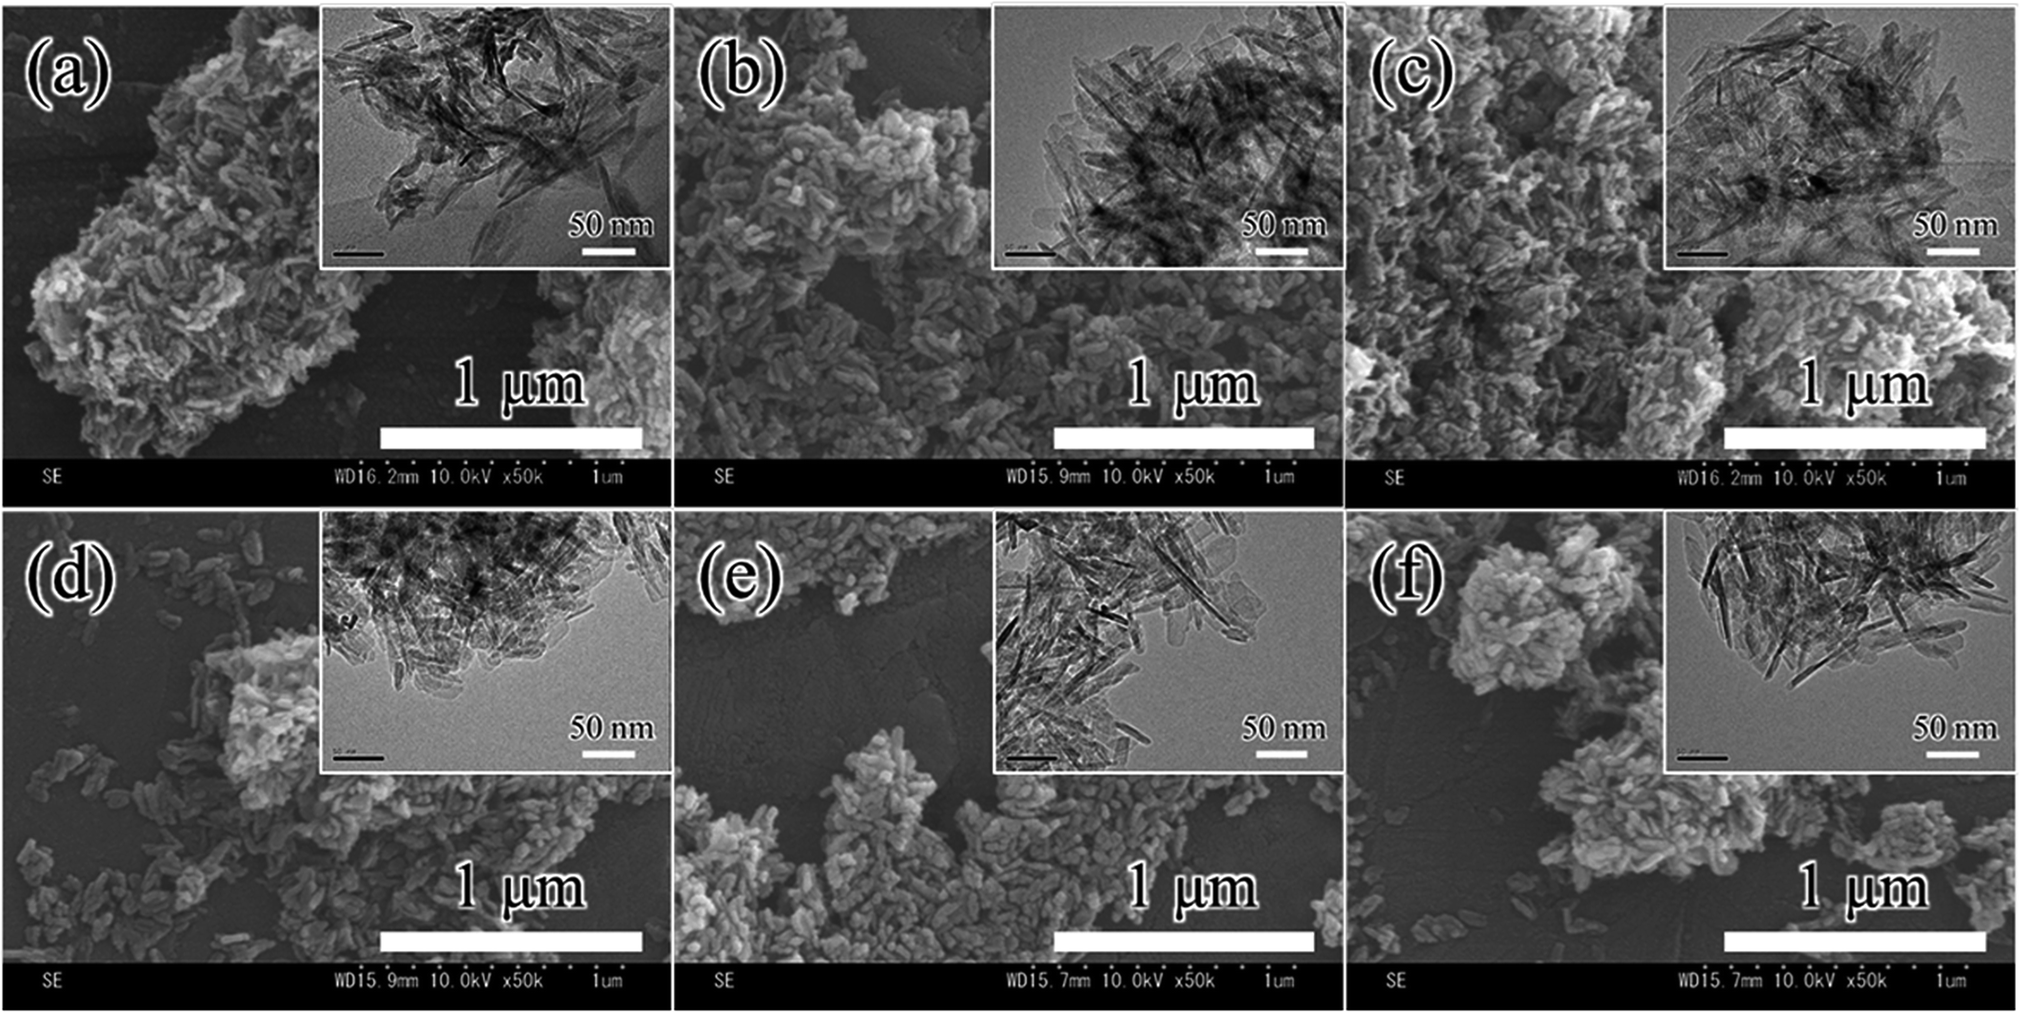 | ||
| Fig. 1 FE-SEM images of pLys-HAp composites: (a) α-pLys-HAp (20 mg), (b) α-pLys-HAp (30 mg), (c) α-pLys-HAp (40 mg), (d) ε-pLys-HAp (20 mg), (e) ε-pLys-HAp (30 mg) and (f) ε-pLys-HAp (40 mg). The insets in (a–f) show TEM images of each sample. | ||
Table 1 summarises the surface area and the pore volume of pLys-HAp. For α-pLys-HAp (20, 30 and 40 mg) and ε-pLys-HAp (20, 30 and 40 mg), the specific surface areas were 132, 145, 133, 148, 146 and 152 m2 g−1, respectively. The pore volumes of α-pLys-HAp (20, 30 and 40 mg) and ε-pLys-HAp (20, 30 and 40 mg) were 0.80, 0.93, 0.88, 0.98, 0.98 and 1.0 cm3 g−1, respectively. Moreover, the pore size distribution and the nitrogen adsorption–desorption isotherms of all pLys-HAp samples indicated type IV, as shown in Fig. S1.† Fig. S1(A)† indicates that the pores with a diameter of 30 nm were only in α-pLys-HAp (30 and 40 mg). Such pore sizes of 30 nm were appeared by increasing the amount of peptides.
| Sample | Surface areaa (m2 g−1) | Pore volumea (cm3 g−1) | Ca/P molar ratiob | Amount of peptidec (mg) | Zeta-potentiald (mV) |
|---|---|---|---|---|---|
| a The specific surface area and pore volume were calculated from the nitrogen adsorption–desorption isotherms via the Brunauer–Emmett–Teller (BET) and the Barrett–Joyner–Halenda (BJH) methods.b The Ca/P molar ratio was determined using an inductively coupled plasma optical emission spectrometry.c The relative amount of peptides in pLys-HAp composites was revealed by thermogravimetry.d The zeta-potential of composites was obtained using the electrophoretic light scattering method. The particles were prepared by dispersion in 10 mM phosphate buffer (pH 7.0) with sonication for 3 min. | |||||
| α-pLys-HAp (20 mg) | 132 | 0.80 | 1.45 | 11 | +13.9 |
| α-pLys-HAp (30 mg) | 145 | 0.93 | 1.45 | 11 | +15.4 |
| α-pLys-HAp (40 mg) | 133 | 0.88 | 1.43 | 13 | +14.0 |
| ε-pLys-HAp (20 mg) | 148 | 0.98 | 1.43 | 5.5 | +4.2 |
| ε-pLys-HAp (30 mg) | 146 | 0.98 | 1.43 | 4.1 | +2.8 |
| ε-pLys-HAp (40 mg) | 152 | 1.0 | 1.42 | 4.3 | +4.2 |
Table 1 shows the Ca/P molar ratio of pLys-HAp measured by ICP-OES. The Ca/P ratios were 1.45, 1.45, 1.43, 1.43, 1.43 and 1.42 for α-pLys-HAp (20, 30 and 40 mg) and ε-pLys-HAp (20, 30 and 40 mg), respectively. The values are lower than 1.67 (the stoichiometric ratio of HAp). From these results, it could be considered that the calcium phosphate synthesised in this study were calcium-deficient HAp or low-crystallinity HAp due to HAp and peptides composites.
The diffraction patterns of pLys-HAp composites are shown in Fig. 2(A). The characteristic reflections of all pLys-HAp at 2θ = 26.0°, 31.8°, 32.2°, 32.8°, 34.0°, 39.8°, 46.6°, 49.5° and 53.3° are indexed to the (002), (211), (112), (300), (202), (310), (222), (213) and (004) planes of HAp, respectively. All the broad peaks in the synthesised pLys-HAp are in good agreement with the Joint Committee on Powder Diffraction Standards (JCPDS) card (09-0432) for HAp. The formation of low-crystallinity HAp, thus, was indicated.43–45
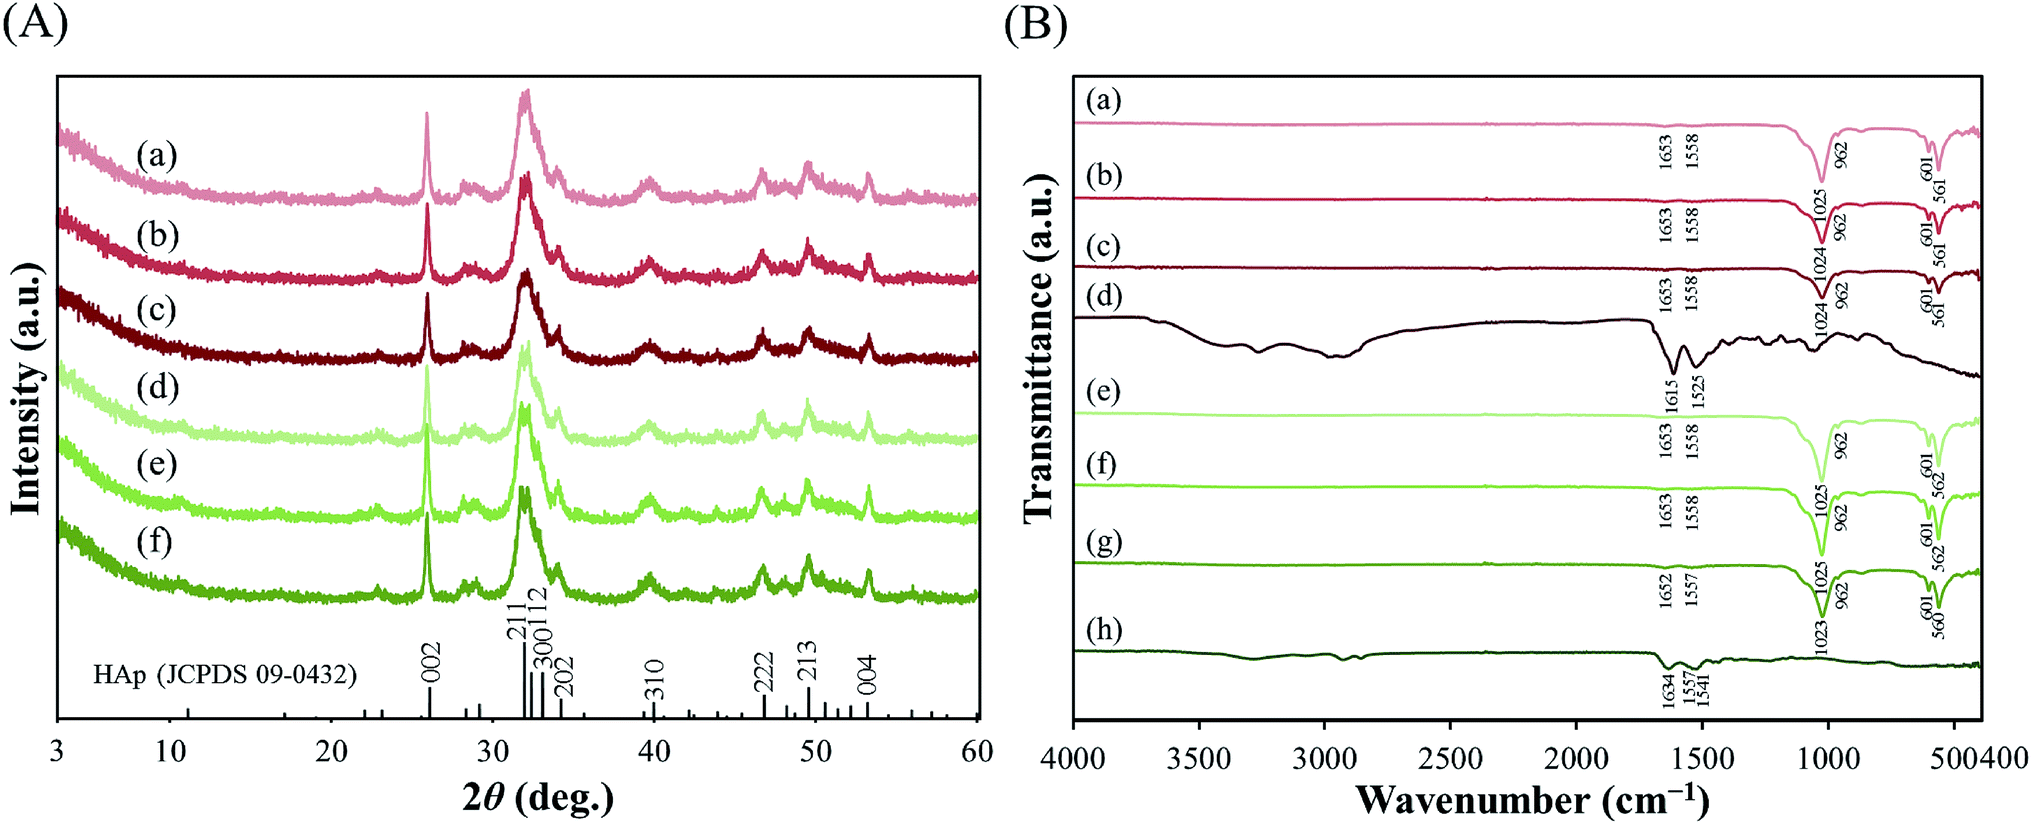 | ||
| Fig. 2 (A) X-ray diffraction patterns of (a) α-pLys-HAp (20 mg), (b) α-pLys-HAp (30 mg), (c) α-pLys-HAp (40 mg), (d) ε-pLys-HAp (20 mg), (e) ε-pLys-HAp (30 mg) and (f) ε-pLys-HAp (40 mg), respectively (JCPDS card no. 09-0432). (B) FT-IR spectra of (a) α-pLys-HAp (20 mg), (b) α-pLys-HAp (30 mg), (c) α-pLys-HAp (40 mg), (d) pure α-pLys, (e) ε-pLys-HAp (20 mg), (f) ε-pLys-HAp (30 mg), (g) ε-pLys-HAp (40 mg) and (h) pure ε-pLys, respectively. | ||
The FT-IR spectra of α-pLys, α-pLys-HAp (20, 30 and 40 mg), ε-pLys and ε-pLys-HAp (20, 30 and 40 mg) are shown in Fig. 2(B). The two strong adsorption bands observed at around 1020 and 960 cm−1 are attributed to symmetric and asymmetric bending modes of P–O in PO43− in HAp, respectively. Another two stretching bands at 600 and 560 cm−1 are assigned to O–P–O in PO43− in HAp, respectively.43–46 The stretching vibration of PO43− of HAp in all pLys-HAp were observed at around 1024, 962, 601 and 561 cm−1. For pLys, the characteristic peaks appearing from 1550 to 1485 cm−1 and from 1590 to 1660 cm−1 are the symmetric and asymmetric stretches of –NH2⋯H+ of peptide.47–51 In the pure α-pLys spectrum, the adsorption bands at 1615/1525 cm−1 are attributed to asymmetrical/symmetrical stretching vibrations of –NH2⋯H+, respectively. The bands of –NH2⋯H+ in ε-pLys occur at 1634, 1557 and 1541 cm−1. The peaks at 1485–1660 cm−1 for pLys-HAp samples were shifted to the high-wavelength side due to the combination of hydroxyapatite and peptide. These results confirmed that the as-synthesised particles consisted of HAp and pLys. Moreover, it can be considered that these pLys-HAp composed from a little amount of peptide because these peaks were not significantly changed by increasing the addition amount of peptides.
The secondary structural contents of two pLys (pure and bound with PO43−) were investigated by FT-IR analysis. Before measurement, the samples were prepared as follows: α-Lys or ε-Lys (12 mg) was mixed with 20 mL (NH4)2HPO4 solution (27 mM) and further stirring for 2 h at 20 °C. Then, the resulting product was obtained by freeze-drying. Table S1† shows that the secondary structures of pure pLys had higher β-sheet content and that of the pLys bound with PO43− was composed of other structures (α-helix, β-sheet and β-turn). In other words, it reveals that the influence of peptide structure for pLys-HAp formation was negligible.
The STEM images, EDX maps and EDX spectra of α-pLys-HAp (40 mg) and ε-pLys-HAp (40 mg) are displayed in Fig. 3 and S2.† Calcium, phosphorous and nitrogen elements can be assigned to HAp and the peptide. The STEM images showed a homogeneous distribution of nitrogen. It confirmed that the distribution of pLys in pLys-HAp particles was consistent.
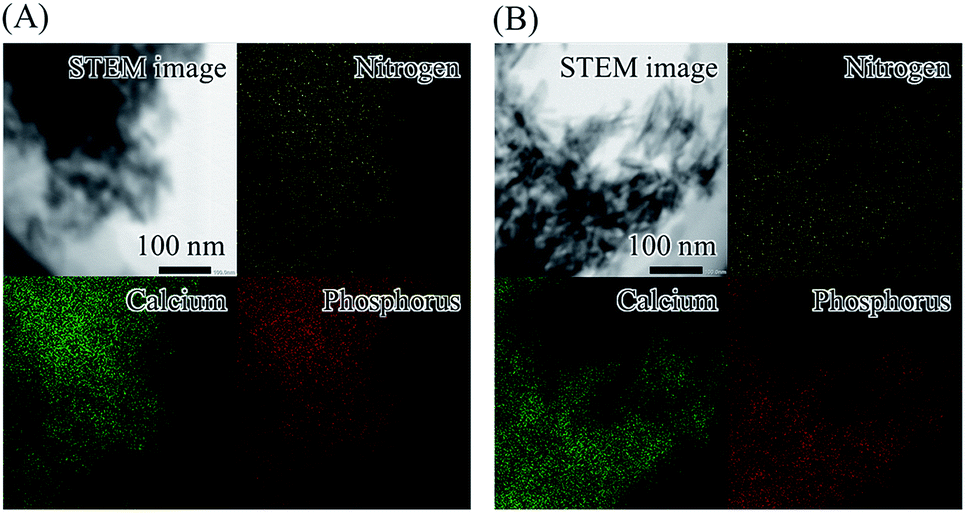 | ||
| Fig. 3 STEM images and EDX maps of elements of (A) α-pLys-HAp (40 mg) and (B) ε-pLys-HAp (40 mg). Yellow, green and red colours display nitrogen, calcium and phosphorus elements, respectively. | ||
To confirm the peptide content in composites, TG-DTA analysis was performed and the relative amounts of peptides were calculated from weight losses in the range of 200–700 °C correspond to the loss of the peptides (Fig. S3† and Table 1). For α-pLys-HAp (20, 30 and 40 mg), the relative amounts of α-pLys were 11, 11 and 13 mg, respectively. On the other hands, the ε-pLys amounts in ε-pLys-HAp (20, 30 and 40 mg) were 5.5, 4.1 and 4.3 mg, respectively. As a result, α-pLys amounts included in α-pLys-HAp were approximately 13 mg (about 7 wt% in pLys-HAp), whereas ε-pLys-HAp can be included at a maximum of 6 mg (about 3 wt% in pLys-HAp) for ε-pLys.
The zeta-potential charge of these composites is listed in Table 1. The surface charges of α-pLys-HAp with different amounts of α-pLys (20, 30 and 40 mg) are +13.9, +15.4 and +14.0 mV, respectively, while the surface potentials of ε-pLys-HAp (20, 30 and 40 mg) are +4.2, +2.8 and +4.2 mV, respectively. Taken together, the surface potentials of α-pLys-HAp were higher positively charged than that of ε-pLys-HAp. Additionally, these results can be attributed to the amount of peptides in pLys-HAp from the TG-DTA data.
3.2 Effect of the difference in the structure of the peptides on GOX adsorption
To determine the adsorption mechanism, two common isotherm models (Freundlich and Langmuir models) were taken in this study.52 Sun et al. investigated that lysozyme was adsorbed on chitosan/hydroxyapatite hybrid membrane by these models. The equilibrium data were fitted well with Freundlich isotherm models more than Langmuir isotherm models.53The Langmuir isotherm model shows that the GOX adsorption on the surface of pLys-HAp occurs by monolayer adsorption. It is expressed as
 | (3) |
In this study, the significance of Freundlich isotherm over the Langmuir isotherm is to confirm the heterogeneous adsorption on these samples. The Freundlich isotherm could be expressed using the following equation:
 | (4) |
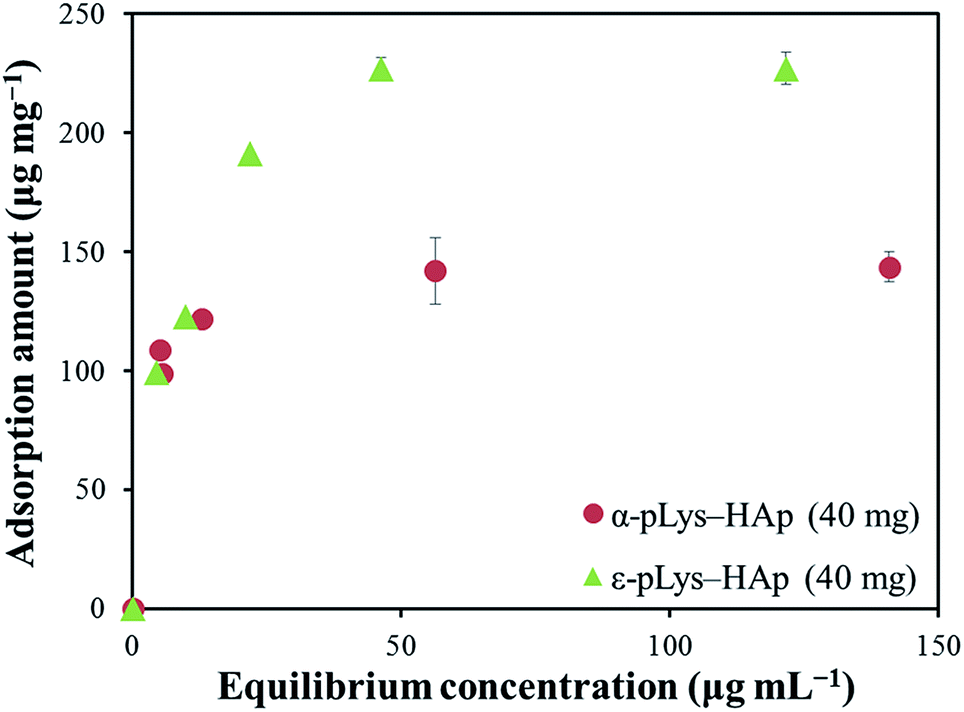
Fig. 4 shows the adsorption isotherm plots for GOX on pLys-HAp, and Table 2 presents the isotherm parameters. As can be observed, the acceptable correlation coefficients (R2) for the Langmuir models were 0.9999 and 0.9974 for α-pLys-HAp (40 mg) and ε-pLys-HAp (40 mg), respectively. Additionally, the R2 values for the Freundlich models attributed to α-pLys-HAp (40 mg) and ε-pLys-HAp (40 mg) were 0.8878 and 0.8795, respectively. A better value of R2 was obtained when Langmuir isotherm models was used. Based on linear regression, it can be considered that the Langmuir model is fitted for adsorption of GOX on α-pLys-HAp (40 mg) and ε-pLys-HAp (40 mg). From Fig. 4, the maximum adsorption capacity of GOX according to α-pLys-HAp (40 mg) and ε-pLys-HAp (40 mg) were 150 and 230 μg mg−1, respectively.
 | ||
| Fig. 4 Adsorption isotherm curves for GOX on α-pLys-HAp (40 mg) and ε-pLys-HAp (40 mg). | ||
| Sample | Langmuir parameters | Freundlich parameters | ||||
|---|---|---|---|---|---|---|
| Qma (mg mg−1) | KLb (mL mg−1) | R2 | 1/nc | KFd (ng mg−1) | R2 | |
| a Qm is the maximum adsorption capacity of GOX at equilibrium.b KL is equilibrium constant for the Langmuir models.c 1/n is Freundlich adsorption intensity constant, while ‘n’ indicates reciprocal of slope value.d KF is equilibrium constant for the Freundlich models. | ||||||
| α-pLys-HAp (40 mg) | 0.15 | 92 | 0.9999 | 0.105 | 4.02 | 0.8878 |
| ε-pLys-HAp (40 mg) | 0.24 | 31 | 0.9974 | 0.275 | 79.3 | 0.8795 |
3.3 Determination of the amino group density in pLys-HAp
To reveal the difference in the maximum capacity for GOX immobilised on pLys-HAp, the amino group density in pLys-HAp composites was evaluated using the fluorescence probe Rhodamine B with isocyanate group. The amino group densities were 16.3 and 15.9 nmol m−2 for α-pLys-HAp (40 mg) and ε-pLys-HAp (40 mg), respectively. According to these results, the densities of amino group in pLys-HAp were not changed between α-pLys-HAp (40 mg) and ε-pLys-HAp (40 mg).From these results, we can discuss about the relationship between the amino group in pLys-HAp and the amount of immobilised GOX on these materials in detail. First, we suppose that all amino groups in these composites cannot be used for enzyme and protein adsorption. Especially, there were relatively many peptides in α-pLys-HAp (Fig. S3† and Table 1), and the longer side chains in α-pLys-HAp were easy to move freely in an unsteady manner. Therefore, there is possibility that a part of amino groups formed HAp and adsorbed on the surface of HAp (something like OH− and PO43−). In contrast, it was considered that the amino groups in ε-pLys-HAp should exist on the surface of particles stably. Therefore, the amino groups in ε-pLys-HAp was capable to be efficiently used for enzyme adsorption compared with those in α-pLys-HAp. Furthermore, it revealed that there was not much difference between α-pLys-HAp and ε-pLys-HAp for the results of the amino group density calculated by Rhodamine B. The reason is that the same number of amino groups in α-pLys-HAp and ε-pLys-HAp may have been utilised for Rhodamine B adsorption owing to the low molecular weight of Rhodamine B (Mw = 536.1). Nevertheless, in the case of GOX with high Mw of 160000 Da, more amino groups used for GOX adsorption on α-pLys-HAp because the distance between the amino groups in two pLys molecules in α-pLys-HAp is closer than that in ε-pLys-HAp. Thus, it assumed that ε-pLys-HAp had high adsorption capacity of GOX using few amino groups effectively.
3.4 Analysis of conformational changes in GOX immobilised on pLys-HAp
8-Anilino-1-naphthalenesulfonic acid (ANS) is an excellent fluorescence probe for binding to the hydrophobic domains of the protein. Therefore, ANS was bound to GOX to investigate the interactions between GOX and pLys-HAp composites. Fig. 5(A) shows the fluorescence spectra of ANS-binding GOX immobilised on α-pLys-HAp (40 mg) and ε-pLys-HAp (40 mg). The three-dimensional structure of GOX was obtained determined from Protein Data Bank; ID: 1CF3. As Fig. 5(A) shows, the enhancement of the maximum emission intensity in the spectra and its blue-shift were observed for the immobilised GOX bound with ANS. These results indicated that the conformational change in GOX occurred due to the GOX immobilisation on pLys-HAp.37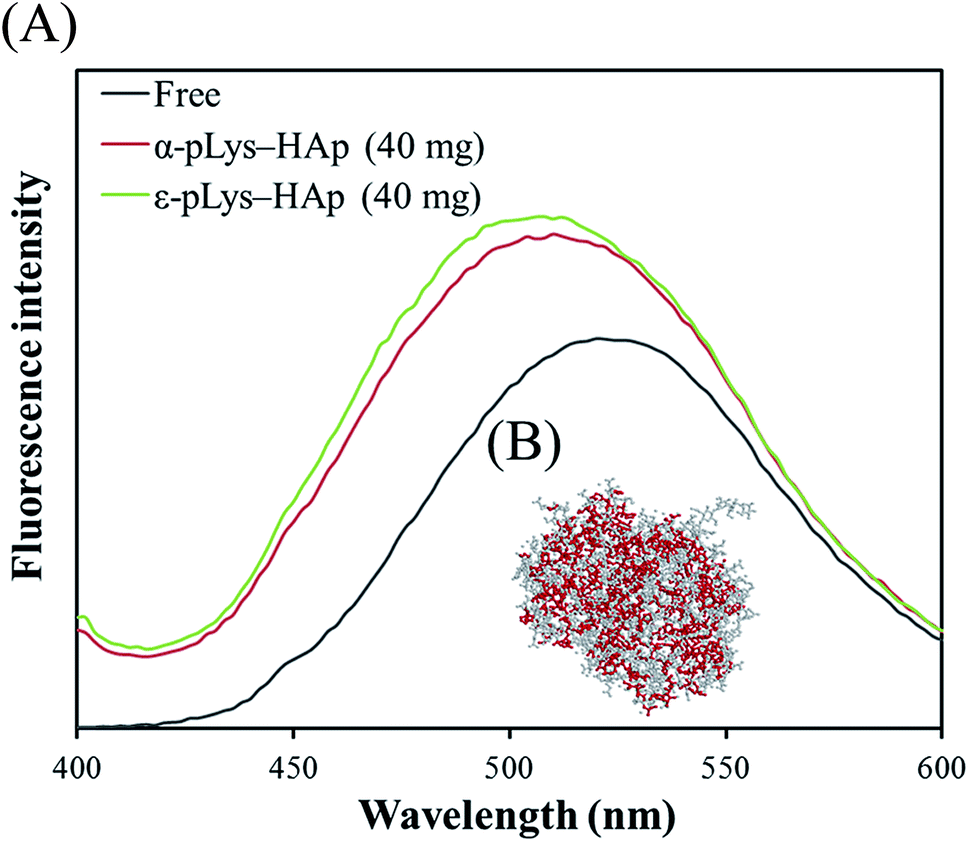 | ||
| Fig. 5 (A) Fluorescence spectra of free and immobilised GOX. (B) The three-dimensional structure of GOX was obtained from Protein Data Bank; ID: 1CF3. Hydrophobic amino residues in GOX were emphasised using red colour. | ||
3.5 Enzymatic kinetics and the catalytic activity of GOX on pLys-HAp
Fig. S4† shows the catalytic activities of GOX (free and immobilised on pLys-HAp). The relative activities of free GOX, immobilised on α-pLys-HAp (40 mg) and ε-pLys-HAp (40 mg) are 1.97, 1.57 and 1.59 mmol min−1 mg−1, respectively. Thus, the oxidation activity of GOX immobilised on these materials exhibited more than 80% compared to that of native GOX (considered to be 100%).Fig. 6 shows the Lineweaver–Burk plot and Table 3 summarises the values of Vmax, Km, Kcat and Kcat/Km. Vmax indicates the ability that how many times enzymes can catalyse a reaction per minute. Vmax in the immobilised samples is lower than the native-free one. It can be assumed that these results were caused by the conformational change in GOX immobilised on pLys-HAp (Fig. 5). However, the Km value of the immobilised GOX is lower than the native GOX, which signified a higher affinity to the substrate. The ratio of Kcat/Km signifies the catalytic efficiency, and the ratios for GOX immobilised on α-pLys-HAp (40 mg) and ε-pLys-HAp (40 mg) are slightly lower than free GOX. From these results, GOX immobilised on pLys-HAp samples suggested a high ability for enzyme catalyst.
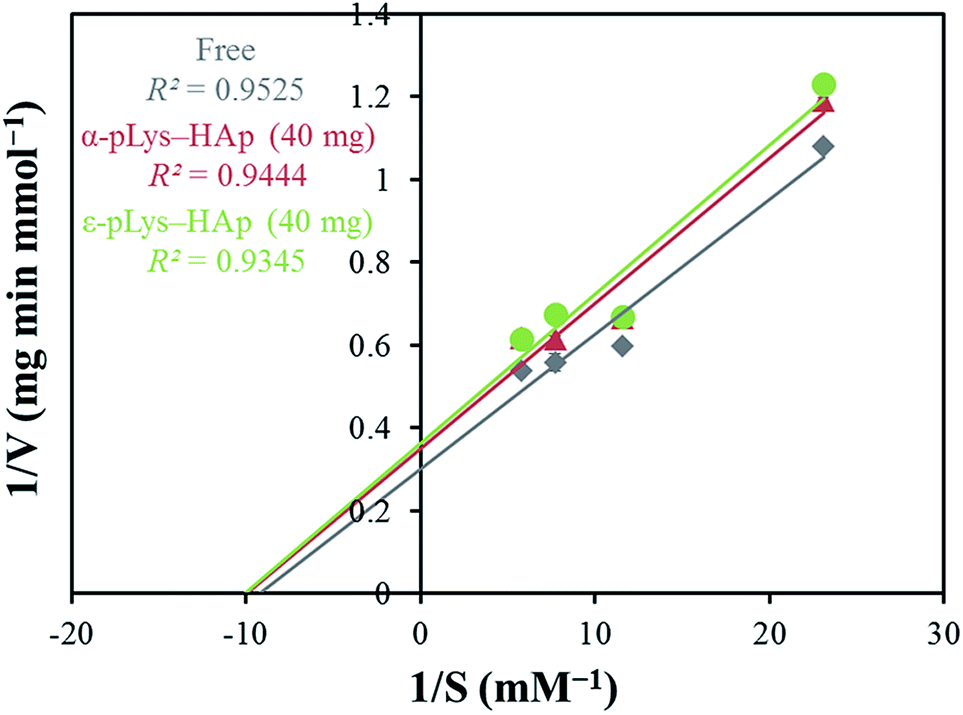 | ||
| Fig. 6 The Lineweaver–Burk plots of free and immobilised GOX. | ||
| Sample | Vmaxa (mmol min−1 mg−1) | Kmb (μM) | Kcatc (×105 min−1) | Kcat/Kmd (×103 μM−1 min−1) |
|---|---|---|---|---|
| a Vmax is the maximum velocity.b Km is Michaelis constant.c Kcat is turn over number.d Kcat/Km is specificity constant. | ||||
| Free | 3.31 | 108 | 176 | 164 |
| α-pLys-HAp (40 mg) | 2.86 | 100 | 152 | 152 |
| ε-pLys-HAp (40 mg) | 2.75 | 99.2 | 147 | 148 |
Moreover, cycling test was carried out and the remaining activity was measured after each cycle. Fig. 7 shows, the relative activity of GOX immobilised on these pLys-HAp materials was kept more than 50% of the initial activity after ten cycles. For α-pLys-HAp (40 mg), the oxidation activity remained about 80% after seven cycles. On the other hand, the remaining activity of GOX immobilised on ε-pLys-HAp (40 mg) was kept approximately 70% after ten cycles. These results verified that the pLys-HAp composites could be better candidates for immobilising carriers of enzymes with high stability. Additionally, it can be considered that these differences of enzyme stability between α-pLys-HAp (40 mg) and ε-pLys-HAp (40 mg) may have been affected by peptide structures and pores in pLys-HAp composites (Fig. S1†). First of all, a GOX molecule immobilisation on α-pLys-HAp (40 mg) was supported by many amino groups in α-pLys and pores with a diameter of 30 nm, although the relative activity was decreased by repeated washing with deionised water after seven cycles. Next, a GOX molecule immobilisation on ε-pLys-HAp (40 mg) was held by few amino groups in ε-pLys, which appeared close to the surface of composites; therefore, the remaining activity was kept high after ten cycles. The difference of the pores in composites and the distance between amino groups in two pLys molecules may become important the key roles for enzyme stability.
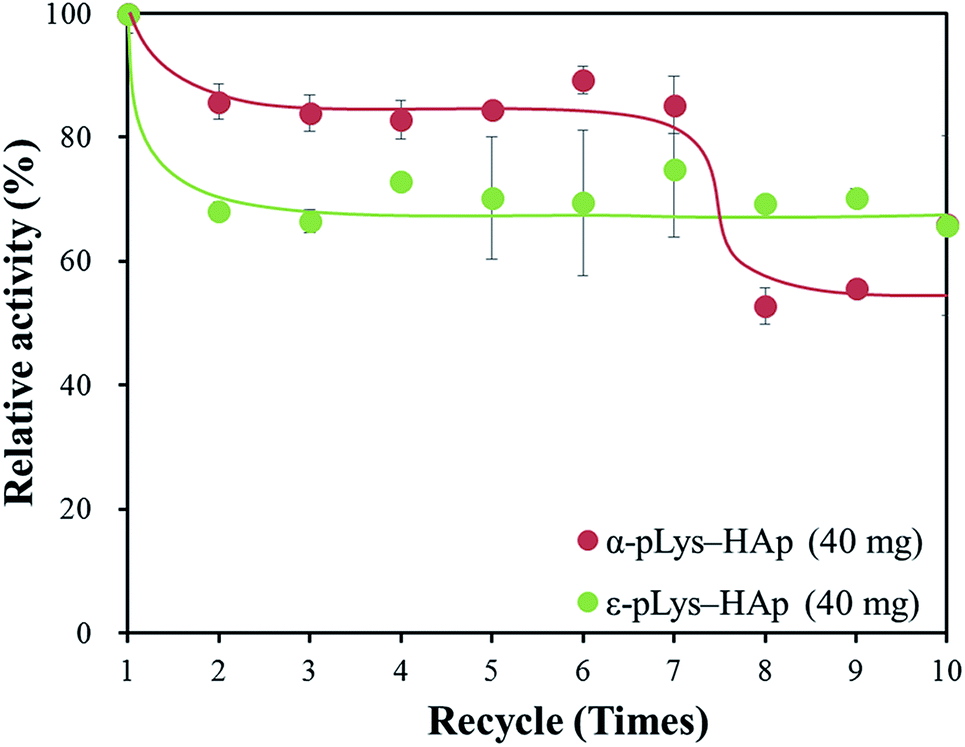 | ||
| Fig. 7 Remaining activity of GOX immobilised on pLys-HAp in cycling test. | ||
To reveal the glucose-sensitivity for GOX immobilised on pLys-HAp particles, these response were measured in the range of glucose concentration of 4–800 μM, as shown in Fig. 8. In both cases of GOX immobilised on α-pLys-HAp (40 mg) and ε-pLys-HAp (40 mg), the glucose response curves show a linear range from 4 to 400 μM of glucose with high correlation coefficients (the R2 values were 0.9980 and 0.9987 for α-pLys-HAp (40 mg) and ε-pLys-HAp (40 mg), respectively). This range in the immobilised samples was also obtained using GOX solution (native-free) with a high R2 value (0.9991). Liu et al. reported the synthesis of graphdiyne (GDY) composites with dual-enzymatic activity via immobilisation of ferrous ion and GOX on GDY sheet. A linear calibration plot between the absorbance at 450 nm and glucose concentration was shown in the range of 5–160 μM of glucose.55 It revealed that the as-synthesised α-pLys-HAp (40 mg) and ε-pLys-HAp (40 mg) could be utilised as glucose sensors with high sensitivity.
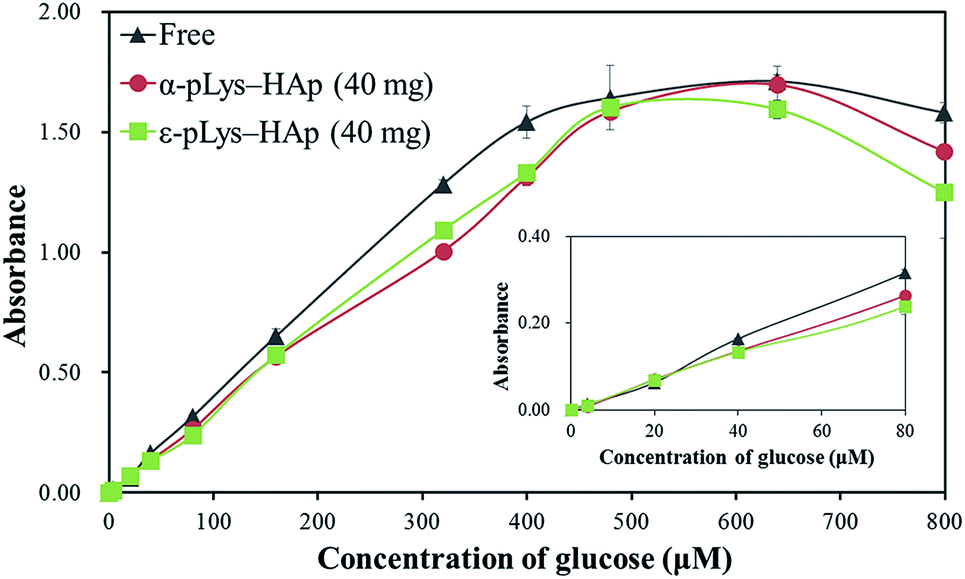 | ||
| Fig. 8 The glucose-sensitivity using GOX (free and immobilised on pLys-HAp). The inset shows the plot in the range of 4–80 μM of glucose. | ||
3.6 Detecting glucose at the graphene oxide/imogolite/GOX/pLys-HAp modified GCE
Fig. 9 shows cyclic voltammograms of graphene oxide/imogolite/GOX/pLys-HAp modified GCE. A voltammetric peak was monitored in the presence of glucose at a potential of −0.47 V. The reaction could be expressed as follows:56| Glucose + GOX(FAD) → gluconolactone + GOX(FADH2) | (5) |
| GOX(FADH2) + O2 → GOX(FAD) + H2O2 | (6) |
| O2 + 4H+ + 4e− → GOX(FAD) + 2H2O | (7) |
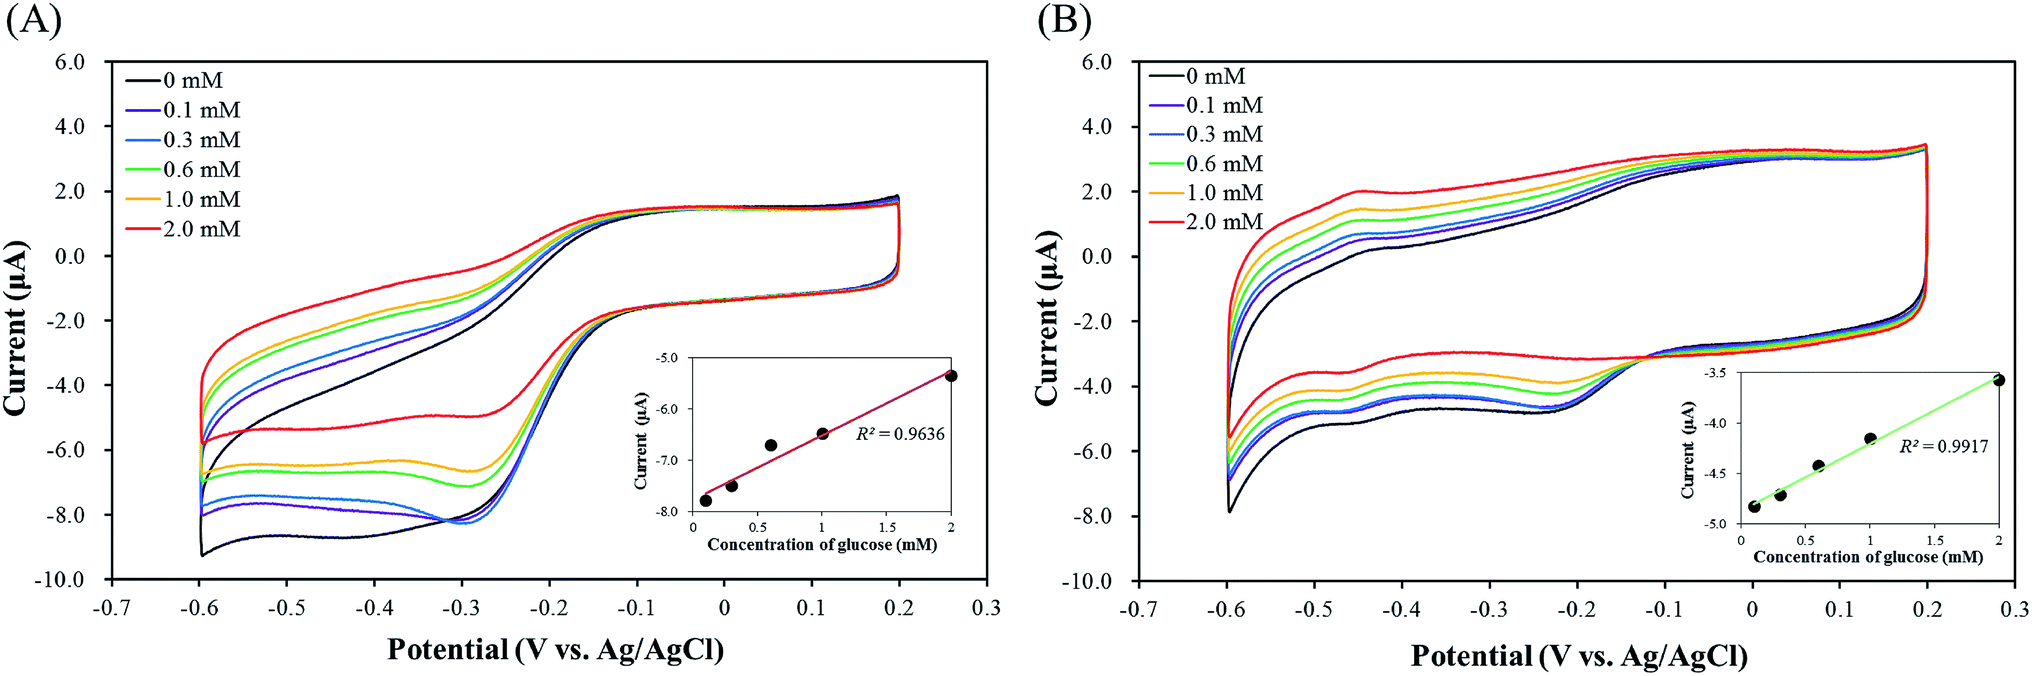 | ||
| Fig. 9 Cyclic voltammograms of (A) graphene/imogolite/GOX/α-pLys-HAp (40 mg)-modified GCE and (B) graphene/imogolite/GOX/ε-pLys-HAp (40 mg)-modified GCE for the addition of 0–2.0 mM glucose in O2-saturated Dulbecco's PBS (pH 7.3) at a scan rate of 100 mV s−1. The insets in (A) and (B) show the linear plots for the concentration of glucose vs. peak current. | ||
As Fig. 9(B) shows, a good linear relationship was observed at the range of glucose concentration between 0 and 2.0 mM, the current peak at the graphene oxide/imogolite/GOX/ε-pLys-HAp (40 mg)/GCE was linearly increased by improving the concentration of glucose (the R2 value = 0.9917). Therefore, the graphene oxide/imogolite/GOX/ε-pLys-HAp (40 mg) modified GCE is a good enzyme electrode and could be used for glucose detection with high sensitivity.
4. Conclusions
Two kinds of poly-L-lysine (α-pLys and ε-pLys) containing hydroxyapatite (pLys-HAp) were synthesised via an easy method. The amount of peptide in α-pLys-HAp is three times higher than that in ε-pLys-HAp. However, the adsorption capacity of glucose oxidase (GOX) immobilised on ε-pLys-HAp is higher than that on α-pLys-HAp. Thus, few amino groups in ε-pLys-HAp could be used for GOX adsorption effectively, while many amino groups in α-pLys-HAp were used. The oxidation activities of GOX immobilised on pLys-HAp materials were more than 80% compared to that of native GOX (considered to be 100%). Furthermore, the remaining activity of GOX immobilised on these materials was kept more than 50% of the initial activity after ten cycles. For α-pLys-HAp (40 mg), the oxidation activity remained about 80% after seven cycles, and the relative activity of GOX immobilised on ε-pLys-HAp (40 mg) was kept approximately 70% after ten cycles. The difference of the pores in composites and the distance between amino groups in two pLys molecules become important key roles for enzyme stability. GOX immobilised on pLys-HAp particles was able to detect glucose from 4 to 400 μM. From the results of the direct electrochemistry by cyclic voltammetry (CV) method, the graphene oxide/imogolite/GOX/ε-pLys-HAp (40 mg) modified GCE was a good enzyme electrode with high sensitivity for glucose detection. These results suggest that the synthesised particles could be good candidates for immobilising carriers of enzymes with high stability and for biosensors with high sensitivity.Conflicts of interest
There are no conflicts to declare.Acknowledgements
The author thanks Dr Hiroyuki Iwata, Associate Professor of Aichi Institute of Technology for his help in the STEM-EDX observation. The financial support of Grants-in-Aid for Scientific Research (C) No. 15K06474 from the Japan Society for the Promotion of Science and A-STEP (AS282I011e) from the Japan Science and Technology Agency is gratefully acknowledged.References
- A. Othman, A. Karimi and S. Andreescu, J. Mater. Chem. B, 2016, 4, 7178–7203 RSC.
- M. Sun, S. Huang, L. Chen, Y. Li, X. Yang, Z. Yuan and B. Su, Chem. Soc. Rev., 2016, 45, 3479–3563 RSC.
- C. Anichini, W. Czepa, D. Pakulski, A. Aliprandi, A. Ciesielski and P. Samori, Chem. Soc. Rev., 2018, 47, 4860–4908 RSC.
- F. Demir, B. Demir, E. E. Yalcinkaya, S. Cevik, D. O. Demirkol, U. Anik and S. Timur, RSC Adv., 2014, 4, 50107–50113 RSC.
- X. Cao, Y. Sun, Y. Ye, Y. Li and X. Ge, Anal. Methods, 2014, 6, 1448–1454 RSC.
- A. Kaffash, H. R. Zare and K. Rostami, Anal. Methods, 2018, 10, 2731–2739 RSC.
- L. Wu, X. Lu, X. Wang, Y. Song and J. Chen, Anal. Methods, 2015, 7, 3347–3352 RSC.
- D. Li, Y. Ma, Y. Zhang and Z. Lin, Anal. Methods, 2016, 8, 6231–6235 RSC.
- G. Shtenberg, N. Massad-Ivanir and E. Segal, Analyst, 2015, 140, 4507–4514 RSC.
- H. Liu, C. Tao, Z. Hu, S. Zhang, J. Wang and Y. Zhan, RSC Adv., 2014, 4, 43624–43629 RSC.
- H. Jang and D. Min, RSC Adv., 2015, 5, 14330–14332 RSC.
- Y. Luo, F. Song, X. Wang and Y. Wang, CrystEngComm, 2017, 19, 2996–3002 RSC.
- J. N. Vranish, M. G. Ancona, S. A. Walper and I. L. Medintz, Langmuir, 2018, 34, 2901–2925 CrossRef CAS PubMed.
- F. Eslamipour and P. Hejazi, RSC Adv., 2016, 6, 20187–20197 RSC.
- M. Abbasi, R. Amiri, A. Bordbar, E. Ranjbakhsh and A. Khosropour, Appl. Surf. Sci., 2016, 364, 752–757 CrossRef CAS.
- A. T. E. Vilian, S. Chen, M. A. Ali and F. M. A. Al-Hemaid, RSC Adv., 2014, 4, 30358–30367 RSC.
- S. Kumar-Krishnan, M. G. García, E. Prokhorov, M. Estevez-González, R. Pérez, R. Esparza and M. Meyyappan, J. Mater. Chem. A, 2017, 5, 7072–7081 RSC.
- A. Paul, G. Vyas, P. Paul and D. N. Srivastava, ACS Appl. Nano Mater., 2018, 1, 3600–3607 CrossRef CAS.
- Y. Wang, L. Zhang, K. Cui, S. Ge, P. Zhao and J. Yu, ACS Appl. Mater. Interfaces, 2019, 11, 5114–5122 CrossRef CAS PubMed.
- Z. Kang, K. Jiao, R. Peng, Z. Hu and S. Jiao, RSC Adv., 2017, 7, 11872–11879 RSC.
- Y. Chung, Y. Ahn, M. Christwardana, H. Kim and Y. Kwon, Nanoscale, 2016, 8, 9201–9210 RSC.
- C. Li, H. Zhang, P. Wu, Z. Gong, G. Xu and C. Cai, Analyst, 2011, 136, 1116–1123 RSC.
- G. Bharath, R. Madhu, S. Chen, V. Veeramani, A. Balamurugan, D. Mangalaraj, C. Viswanathan and N. Popandian, J. Mater. Chem. B, 2015, 3, 1360–1370 RSC.
- S. Kojima, F. Nagata, S. Kugimiya and K. Kato, Appl. Surf. Sci., 2018, 458, 438–445 CrossRef CAS.
- S. Kojima, F. Nagata, M. Inagaki, S. Kugimiya and K. Kato, New J. Chem., 2019, 43, 427–435 RSC.
- K. M. Hawkins, S. S.-S. Wang, D. M. Ford and D. F. Shantz, J. Am. Chem. Soc., 2004, 126, 9112–9119 CrossRef CAS PubMed.
- M. M. Tomczak, D. D. Glawe, L. F. Drummy, C. G. Lawrence, M. O. Stone, C. C. Perry, D. J. Pochan, T. J. Deming and R. R. Naik, J. Am. Chem. Soc., 2005, 127, 12577–12582 CrossRef CAS PubMed.
- Y. Zhu, W. Meng, H. Gao and N. Hanagata, J. Phys. Chem. C, 2011, 115, 13630–13636 CrossRef CAS.
- S. B. Hartono, W. Gu, F. Kleitz, J. Liu, L. He, A. P. J. Middelberg, C. Yu, G. Q. M. Lu and S. Z. Qiao, ACS Nano, 2012, 6, 2104–2117 CrossRef CAS PubMed.
- J. V. Bradley, L. N. Bridgland, D. E. Colyer, M. J. Duer, T. Friščić, J. R. Gallagher, D. G. Reid, J. N. Skepper and C. M. Trasler, Chem. Mater., 2010, 22, 6109–6116 CrossRef CAS.
- C. Gao, Y. Wan, X. Lei, J. Qu, T. Yan and K. Dai, Cellulose, 2011, 18, 1555–1561 CrossRef CAS.
- Y. Ding, J. Liu, X. Jin, H. Lu, G. Shen and R. Yu, Analyst, 2008, 133, 184–190 RSC.
- T. Kaneko, F. Nagata, S. Kugimiya and K. Kato, Ceram. Int., 2018, 44, 20581–20585 CrossRef CAS.
- D. Sarkar, RSC Adv., 2013, 3, 24389–24399 RSC.
- D. K. Ban and S. Paul, Colloids Surf., B, 2016, 146, 577–584 CrossRef CAS PubMed.
- F. Wang, X. Wang, M. Zhang, A. Huang and L. Ma, Int. J. Biol. Macromol., 2018, 117, 532–537 CrossRef CAS PubMed.
- K. Nakanishi, M. Tomita, H. Nakamura and K. Kato, J. Mater. Chem. B, 2013, 1, 6321–6328 RSC.
- X. Cao, Y. Li, Z. Zhang, J. Yu, J. Qian and S. Liu, Analyst, 2012, 137, 5785–5791 RSC.
- K. Nakanishi, M. Tomita and K. Kato, RSC Adv., 2014, 4, 4732–4735 RSC.
- A. T. E. Vilian and S. Chen, RSC Adv., 2014, 4, 50771–50781 RSC.
- L. Wang, Y. Zeng, A. Shen, Y. Fu, L. Zeng and J. Hu, RSC Adv., 2016, 6, 86025–86033 RSC.
- K. Kato, K. Inukai, K. Fujikura and T. Kasuga, New J. Chem., 2014, 38, 3591–3599 RSC.
- V. K. Mishra, B. N. Bhattacharjee, D. Kumar, S. B. Rai and O. Parkash, New J. Chem., 2016, 40, 5432–5441 RSC.
- W. Amer, K. Abdelouahdi, H. R. Ramananarivo, M. Zahouily, A. Fihri, K. Djessas, K. Zahouily, R. S. Varma and A. Solhy, CrystEngComm, 2013, 16, 543–549 RSC.
- W. Fang, H. Zhang, J. Yin, B. Yang, Y. Zhang, J. Li and F. Yao, Cryst. Growth Des., 2016, 16, 1247–1255 CrossRef CAS.
- X. Zhao, Y. Zhu, F. Chen, B. Lu, C. Qi, J. Zhao and J. Wu, CrystEngComm, 2013, 15, 7926–7935 RSC.
- R. Gonzalez-McQuire, J. Chane-Ching, E. Vignaud, A. Lebugle and S. Mann, J. Mater. Chem. B, 2004, 14, 2277–2281 RSC.
- V. Humblot, C. Méthivier and C. Pradier, Langmuir, 2006, 22, 3089–3096 CrossRef CAS PubMed.
- Z. Sun, G. Zhang, X. Wang, Z. Gao, X. Cheng, S. Zhang and D. Xu, Cryst. Growth Des., 2009, 9, 3251–3259 CrossRef CAS.
- V. G. Demillo and X. Zhu, J. Mater. Chem. B, 2015, 3, 8328–8336 RSC.
- Y. Choi, N. Thongsai, A. Chae, S. Jo, E. B. Kang, P. Paoprasert, S. Y. Park and I. In, J. Ind. Eng. Chem., 2017, 47, 329–335 CrossRef CAS.
- H. E. Khal and N. H. Batis, New J. Chem., 2015, 39, 3597–3607 RSC.
- J. Sun, L. Wu and J. Chen, Cellulose, 2016, 23, 3861–3874 CrossRef CAS.
- K. Y. Foo and B. H. Hameed, Chem. Eng. J., 2010, 156, 2–10 CrossRef CAS.
- J. Liu, X. Shen, D. Baimanov, L. Wang, Y. Xiao, H. Liu, Y. Li, X. Gao, Y. Zhao and C. Chen, ACS Appl. Mater. Interfaces, 2019, 11, 2647–2654 CrossRef CAS PubMed.
- C. Chen, Q. Xie, D. Yang, H. Xiao, Y. Fu, Y. Tan and S. Yao, RSC Adv., 2013, 3, 4473–4491 RSC.
Footnote |
| † Electronic supplementary information (ESI) available. See DOI: 10.1039/c9ra01764j |
| This journal is © The Royal Society of Chemistry 2019 |