 Open Access Article
Cinchona alkaloids as natural fetal hemoglobin inducing agents in human erythroleukemia cells
Fizza Iftikhar a,
Hamad Ali
 a and
Syed Ghulam Musharraf
 *ab
*ab
aDr Panjwani Center for Molecular Medicine and Drug Research, International Center for Chemical and Biological Sciences, University of Karachi, Karachi-75270, Pakistan. E-mail: musharraf1977@yahoo.com; Fax: + 92 21 34819018-9; Tel: +92 21 34824924-5 Tel: +92 21 34819010
bH. E. J. Research Institute of Chemistry, International Center for Chemical and Biological Sciences, University of Karachi, Karachi-75270, Pakistan
First published on 4th June 2019
Abstract
Pharmacologically mediated reactivation of γ-globin gene with an increase in fetal hemoglobin production, is a cost effective experimental therapeutic intervention for the management of β-hemoglobinopathies. Investigation of new pharmacological agents as HbF inducers from natural resources is desirable to develop safe and effective HbF inducers. We evaluated selected cinchona alkaloids (cinchonidine and quinidine) for their potential of erythroid differentiation and augmentation of fetal hemoglobin production. K562 cells were used as in vitro experimental model. Erythroid differentiation of K562 cells was studied using a benzidine assay, and total hemoglobin was estimated through a calorimetric method. Whereas, quantitative real-time PCR (qRT-PCR) was used to analyse γ-globin gene expression, and flow cytometry and immunofluorescence microscopy for evaluating HbF production. Cinchona alkaloids showed dose dependent erythroid differentiation, time driven cellular proliferation, with kinetics of hemoglobin accumulation in K562 cells. The findings of qRT-PCR showed an increase in expression of γ-globin mRNA content (3.17-fold in cinchonidine and 2.03-fold increase in quinidine treated K562 cells), accompanied by an increase in fetal hemoglobin production. Altogether, this study demonstrates that cinchona alkaloids can be used as therapeutic agents in treating β-thalassemia after further biological investigation.
1. Introduction
β-Thalassaemia is a blood-borne chronic hereditary disease, with a high prevalent rate in the Mediterranean region, Africa, Middle and South East Asia. Worldwide, more than 200 different β-globin gene mutations have been reported in the scientific literature.1 The disruption of closely regulated globin chains (α and β-globin) of hemoglobin (Hb) results in anomalous Hb molecules and ineffective red blood cell (RBC) production, which causes a high turnover rate of RBCs and anemia.2 The conventional therapy for β-thalassaemia is blood transfusion which decreases the disease morbidity and mortality, but recurrent blood transfusion is a comprehensive source of iron accumulation and several other secondary complications.3,4 Current promising methods of treatment include bone marrow transplant (BMT) and gene therapy. Both BMT and gene therapy seem to be unaffordable to economically backwards patients due to high clinical costs and are associated with many problems including finding HLA matching compatibility, transplant rejection, carcinogenesis, and procedure-related toxicity.5,6The hallmark of current molecular strategies is centred on the pharmacological mediated reactivation of γ-globin gene to produce fetal hemoglobin (HbF) in treating sickle cell anemia (SCA) and β-thalassemia.7,8 HbF expression in β-thalassaemia decreases the accumulation, and precipitation of α-globin chains and subsequently compensates globin chains imbalance. Several studies have reported the clinical significance of production of HbF in hemoglobinopathies. However, hydroxyurea (HU) is the only FDA approved HbF inducer for sickle cell anemia (SCA).9–11 Most of the investigated HbF inducers are chemotherapeutic agents such as HU, 5-azacytidine, cisplatin, and decitabine have been documented for their potential to enhance HbF levels. However, their modest response rate in some patients, variable efficacy, carcinogenic property and their toxic profile limits their usefulness in clinical practices.12–15 In recent years, much effort has been contributed to apply the potential of compounds from natural resources in treating hemoglobinopathies by HbF production. Some potent natural inducers of erythroid differentiation on K562 cells includes resveratrol (100 μM),16 rapamycin (10 nM),17 angelicin (400 μM),18 mithramycin (20 nM),19 cucurbitacin D (12.5 ng mL−1),20 tallimustine (500 nM),21 and distamycin (50 μM).22 These compounds are well documented for their erythroid differentiation and induction ability on human erythroleukaemic K562 cell line and HbF production in primary human erythroid precursor cells from normal and β-thalassaemia patients.23 The beneficial effect of this therapeutic approach prompted us to extent the mining of more naturally occurring compounds that are capable of erythroid differentiation and production of fetal hemoglobin.
Cinchona species are rich in many biologically active quinolone type alkaloids, which mainly includes diastereomeric pairs quinine/quinidine and cinchonine/cinchonidine and are collectively termed as “cinchona alkaloids”.24,25 These alkaloids are well known for their antimalarial activity.26 Apart from antiplasmodial effect, their in vitro anti-trypanosomal, anti-amoebic and anti-arrhythmic activities have already been reported.27–29 These previous findings for native cinchona alkaloids prompted us to investigate the possible erythroid cell proliferation and HbF inducing effects of cinchonidine and quinidine on K562 cells. In this study, we used K562 cells as an in vitro model to determine the erythroid differentiation, γ-globin gene expression and HbF-inducing effect of cinchonidine and quinidine with the aim to find potent HbF producing agents for the efficient management of β-thalassemia.
2. Materials and methodology
2.1. Preparation of solutions
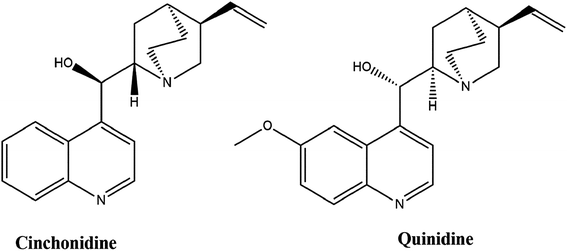
Cinchonidine (MP Biomedicals, CA) and HU (Sigma, USA) were solubilized in sterile deionized H2O, whereas, quinidine (MP Biomedicals, CA) was solubilized in dimethyl sulfoxide (DMSO) (Sigma, France) and stored at −20 °C. Stock solutions were prepared at 20 mM for each treating agent. These stocks were further diluted to the indicated concentrations in culture medium prior to experimentation. The DMSO concentration was adjusted to <0.1% for the experimental culture medium.30 HU was used at optimal concentration of 200 μM as a positive control and untreated cells were used as negative control. The chemical structure of cinchonidine and quinidine is shown in Fig. 1.2.2. K562 cell culture and treatment protocol
Human erythroleukemia K562 cells (CCL-243) were obtained from the American Type Culture Collection (ATCC). K562 cells were cultured in RPMI-1640 medium (Gibco BRL, USA), supplemented with 10% FBS-fetal bovine serum (Sigma, USA) and 1% penicillin–streptomycin (Sigma, USA) under a humidified atmosphere with 5% CO2 at 37 °C.31 The cells were seeded in 96-well plate at 4 × 10³ cells per mL and treated with different concentrations of treated compounds. The medium of the culture was not changed during treatment. All experiments were repeated at least thrice. The concentration of cinchonidine and quinidine was optimized at 10 and 20 μM, respectively, in mechanistic studies of our pilot experiments.2.3. Benzidine hemoglobin staining
In order to determine erythroid differentiation in K562 cells, benzidine assay has been performed and the proportion of benzidine positive cells were counted at day five of the treatment.32 Briefly, the cells were washed with phosphate buffer solution (PBS) and suspended in a solution containing 0.2% benzidine hydrochloride (Peking, China) in 0.5 M glacial acetic, acid (Labscan, Thailand) with 10% H2O2 (Sigma, USA), and incubated 5–10 min in dark.33 Cells were observed and microphotograph were taken by using inverted microscope (Micros, Austria). At least 3 optical fields containing 100–200 cells were analysed. Cells appeared in intense green colour indicates positive (Hb containing) cells, and were expressed as percentage positive cells with respect to the total cells.342.4. Trypan blue dye exclusion assay
The effects of compounds on cell growth and proliferation of cells was determined by the trypan blue dye exclusion assay. Cell growth was determined on daily basis till the day 5 of culture, by taking equal volumes of cell suspensions and trypan blue (Biosera, France) using haemocytometer (Merrifield, Germany). Blue cells that accumulated dye indicates dead cells. Cellular proliferation inhibition was calculated by using formula:| Cellular proliferation inhibition (%): [(dead cells count/total cell count) × 100] |
2.5. In vitro cytotoxic activity assay
The conventional in vitro calorimetric assay using Alamar Blue (AB) has been conducted for rapid screening of cellular growth, viability, mitochondrial and metabolic activity.35,36 Cells were seeded in 96-well plate with inducing agents (cinchonidine and quinidine) at the various concentrations (200, 100, 50, 20, 10 and 1 μM) for periods of up to 48 h. Briefly, 10 μL of AB solution (25 mg/100 mL in PBS) were added to the treated K562 cells, followed by 4 h incubation. Cell growth was determined by measuring fluorescence of the cell number per mL at the respective excitation and emission wavelength of 560 and 590 nm using Spectramax M5e multi-mode microplate reader (Molecular Devices, USA) with Softmax pro software (Molecular Devices, USA). Percent cell viability was determined as a percentage of untreated controls by using following formula.37| % Cell viability = [(Ft − Fb)/(Fc − Fb) × 100], |
2.6. Determination of total hemoglobin (THb)
The quantification of total hemoglobin was determined by using hemoglobin assay kit (Sigma, USA) according to the manufacturer's instructions. Briefly, equal numbers of cells were washed with ice-cold PBS thrice, and lysed in 0.2% Triton X-100 in 100 mM potassium phosphate tribase (lysis buffer) for 20 min. The lysates were centrifuged for at 1500 rpm for 15 min. The 25 μL of supernatant was then mixed with reagent for 5 min at room temperature. The absorption was measured at 400 nm. The data from experimentally determined absorbance values of calibrator in relation to the known concentration of hemoglobin were mapped on a graph to obtain regression equation. Hb concentration was determined and was represented as mean ± SEM of three independent experiments.2.7. RNA isolation
Total RNA of treated K562 cells (106 cells) were isolated using TRIzol; (Invitrogen Corporation, Baltics-UAB, Lithuania) incubated for 5 min at room temperature for complete homogenization of the samples, followed by addition of chloroform (0.2 mL mL−1), mixed vigorously for 15 s, incubated for 10 min at room temperature and centrifuged at 12![[thin space (1/6-em)]](https://www.rsc.org/images/entities/char_2009.gif) 000g for 15 min at 4 °C. The aqueous phase was transferred to a RNase-free tubes followed by addition of isopropanol. The samples were centrifuged at 12
000g for 15 min at 4 °C. The aqueous phase was transferred to a RNase-free tubes followed by addition of isopropanol. The samples were centrifuged at 12![[thin space (1/6-em)]](https://www.rsc.org/images/entities/char_2009.gif) 000g for 15 min at 4 °C. The RNA pellet was then washed by 75% absolute ethanol, air-dried, resuspended in RNase-free water, and stored at −80 °C. RNA concentration and purity was determined by nano drop (ThermoFisher Scientific, USA) and integrity was checked by agarose gel electrophoresis.38
000g for 15 min at 4 °C. The RNA pellet was then washed by 75% absolute ethanol, air-dried, resuspended in RNase-free water, and stored at −80 °C. RNA concentration and purity was determined by nano drop (ThermoFisher Scientific, USA) and integrity was checked by agarose gel electrophoresis.38
2.8. Quantitative real-time reverse-transcription polymerase chain reaction (qRT-PCR)
This robust and precise technique allows the specific quantification of cDNA synthesized from mRNA templates.39 First-strand cDNA was synthesized from 1 μg of total RNA using RevertAid First Strand cDNA synthesis kit (Invitrogen corporation, Baltics-UAB, Lithuania) according to the manufacturer's instructions. For qRT-PCR, the reaction mixture contained: 10 μL; VeriQuest SYBR Green qPCR Master Mix (2X) (affymetrix Inc., USA), 2 μL; cDNA, 1 μL; forward primer (20 μmoL L−1), 1 μL; reverse primer (20 μmoL L−1), and nuclease-free water was added to a final volume of 20 μL. The reaction parameters used were 95 °C for 10 min (Taq activation); for amplification 95 °C for 15 s (denaturation), 60 °C for 60 s (annealing and extension); and repeated for 40 cycles on an 8-tube Stratagene Mx3000P PCR System (Agilent Technologies, Santa Clara, CA, US). The housekeeping gene, human glyceraldehyde-3-phosphate dehydrogenase (GAPDH) was used for qRT-PCR normalization. The primers used were designed according to NCBI sequences using Prime 3.0 software v.4.1.0 (Whitehead Institute, USA).40 The Primer sequence for GAPDH was forward primer 5′-CCA GAA CAT CAT CCC TGC CT-3′ and reverse primer 5′-CCT GCT TCA CCA CCT TCT TG-3′ and for human γ-globin forward primer was, 5′-TTC CTG GCA GAA GAT GGT-3′ and reverse primer 5′-AGC TCT GAA TCA TGG GCA GT-3'. Specificity of formed PCR products was confirmed by melting curve analysis. The relative gene expression levels of each transcript were expressed as the average fold change compared with the corresponding control using the 2−ΔΔCt method.41,422.9. Determination of fetal hemoglobin by flow cytometry
For cytoplasmic HbF analysis 2 × 10⁵ cells from cinchonidine and quinidine treated cultures were collected at day 5 of treatment. Cells were washed with PBS, and fixed with 0.05% glutaraldehyde for 10 min, and then washed three times in PBS. Cells permeabilization was done with 0.1% non-ionic detergent (Triton X-100) for 5 min, followed by repeated washing step. Cells were pre-blocked by incubation with 5% bovine serum albumin (BSA) in PBS for 15 minutes at room temperature, and washed thrice with PBS. The cells were then incubated with 5 μL of phycoerythrin (PE)-conjugated monoclonal HbF antibodies (Life technologies, Frederick, USA) in 80 μL of PBS with 0.1% BSA and incubated in the dark for 15 min at room temperature. Cells were then washed twice with PBS and resuspended in flow cytometry buffer (0.1% BSA in PBS) for flow cytometry analysis. Stained cells were analysed, 10![[thin space (1/6-em)]](https://www.rsc.org/images/entities/char_2009.gif) 000 events were recorded using flow cytometer (BD FACSCanto II, USA) using BD CellQuest Pro (BD Biosciences, USA). The fractional percentages of gated cell populations among the total cells represent the averages of two to four biological replicates. The data was processed by flowing software ver.2 (Turku, Finland) and represented as fluorescence intensities on overlay histogram.
000 events were recorded using flow cytometer (BD FACSCanto II, USA) using BD CellQuest Pro (BD Biosciences, USA). The fractional percentages of gated cell populations among the total cells represent the averages of two to four biological replicates. The data was processed by flowing software ver.2 (Turku, Finland) and represented as fluorescence intensities on overlay histogram.
2.10. Immunocytochemistry staining
For immunocytochemistry (ICC) experiments cells with 4 × 10³/mL seeding density were treated with optimal differentiating dose of quinidine, cinchonidine and HU for 5 days' incubation in 6-well plate. Post-incubation, cells were washed with PBS, and fixed using 4% paraformaldehyde for 20 min and washed with ice-cold PBS. After fixation, permeabilization of cells done by 0.1% Triton X-100, followed by PBS washing. Cells were then blocked in a 5% BSA solution at room temperature. Immunostaining was performed with Anti-HbF-PE antibody at a 1![[thin space (1/6-em)]](https://www.rsc.org/images/entities/char_2009.gif) :
:![[thin space (1/6-em)]](https://www.rsc.org/images/entities/char_2009.gif) 200 dilutions for 1 h incubation at room temperature in dark and washed to remove the unattached cells. Cell nuclei were stained with 4′,6-diamidino-2-phenylindole, dihydrochloride-DAPI (Invitrogen-Dregon, USA). Cells were mounted on glass microscopic slides and analysed by fluorescence microscope (Nikon, Japan) using NIS Elements software (Nikon, Japan). Images from three different fields were captured and fluorescence intensity was quantified using the ImageJ software ver. 1.5 (NIH, USA).
200 dilutions for 1 h incubation at room temperature in dark and washed to remove the unattached cells. Cell nuclei were stained with 4′,6-diamidino-2-phenylindole, dihydrochloride-DAPI (Invitrogen-Dregon, USA). Cells were mounted on glass microscopic slides and analysed by fluorescence microscope (Nikon, Japan) using NIS Elements software (Nikon, Japan). Images from three different fields were captured and fluorescence intensity was quantified using the ImageJ software ver. 1.5 (NIH, USA).
2.11. Statistical analysis
All statistical analysis was carried out by using SPSS 20 software (IBM Corporation, USA) and mapped by using GraphPad Prism 6.0 software (GraphPad, USA). The data was reported as mean ± standard error of mean (SEM) of independently repeated experiments (n ≥ 3). Data was analysed by two-tailed Student's t-test and one-way ANOVA. To see the multiple comparisons, Bonferroni post hoc test was also performed. P < 0.05 was considered statistically significant.3. Results
3.1. Cinchona alkaloids promotes cell growth and erythroid differentiation of K562 cells
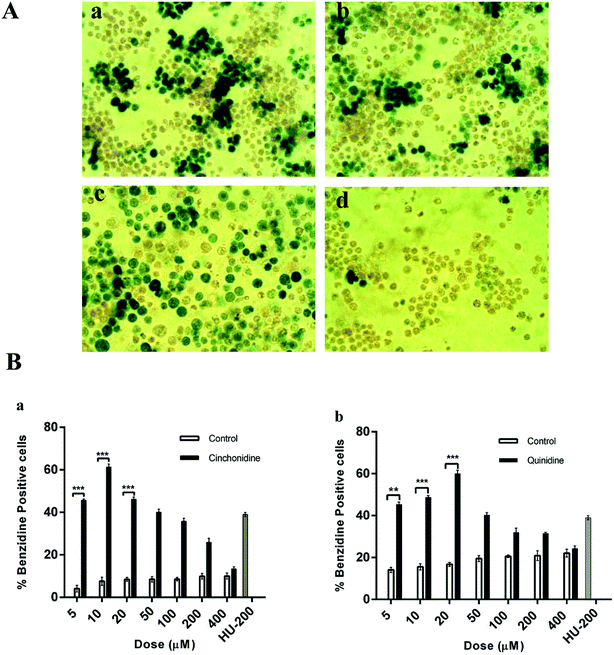
The dose-dependent cell differentiation and proliferation of K562 cells is observed in cinchonidine and quinidine treated culture as compared to untreated cells (Fig. 2).The pictorial view indicates darker intensities (green colour) of Hb containing benzidine positive cells and presented as qualitative comparison of benzidine-positive induced cells (green colour) and un-induced (colourless) cells. Cinchonidine and quinidine treated cells showed highest erythroid induction of K562 cells (Fig. 2A). The proportion of benzidine positive cells at various concentrations of cinchonidine and quinidine, revealed dose dependent erythroid differentiation of K562 cells. Cinchonidine showed greater percent of Hb containing benzidine-positive cells at 10 μM. Similarly, most effective differentiation was observed at 20 μM of quinidine after 5 days of incubation (Fig. 2B). The rate of erythroid differentiation induced by cinchonidine (10 μM) and quinidine (20 μM) was 61.25 ± 1.43% and 60.0 ± 1.59%, respectively, similar to the maximal effect of 200 μM of HU as 61.49 ± 0.50%. Data was represented as mean ± SEM for three independent experiments. P < 0.05 was found statistically significant.
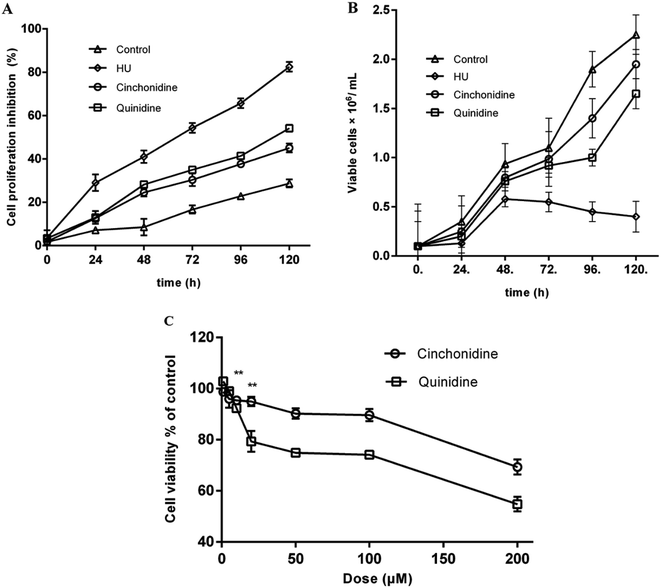
The appreciable time-dependent cell proliferation, and growth pattern were observed by trypan blue dye exclusion assay. In second set of experiments, treated K562 cells with previously indicated concentration of cinchonidine and quinidine showed non-antiproliferative effects of these agents (Fig. 3A). At day 0, cinchonidine showed the inhibition of 1.88 ± 1.25%, closer to the inhibition rate of untreated cell (1.66 ± 0.99%). Whereas, quinidine also showed lesser inhibition as 3.38 ± 1.02% in K562 cells. However, with the passage of time the cellular growth is decreased with inhibition rate as 45.06 ± 2.02, and 54.15 ± 1.58 for cinchonidine and quinidine, respectively, at day 5. Overall, the significantly lesser inhibitory effect of cinchonidine and quinidine were observed; when compared to HU (200 μM), which caused up to 85% inhibition of cellular proliferation. The comparative analysis to evaluate the effects of cinchonidine and quinidine on cellular growth (no. of cells grown) were also assessed in time dependent manner (Fig. 3B). HU was found to have cell growth inhibition at day 3 of the treatment. Whereas, inhibitory effects of cinchonidine and quinidine was only noticed when treated for longer period of time.
3.2. Evaluation of cell viability and cytotoxicity by AB assay
Cinchonidine and quinidine showed decrease in cellular proliferation with increased in compound concentration (Fig. 3C). Cell viabilities were represented as percent of control and data was expressed as mean ± SEM for experiments (n ≥ 3). The growth pattern of cells revealed a precise concentration-dependent response of cinchonidine and quinidine, and showed strengthen proliferative effects of these agents at lower concentrations. Interestingly, inhibition of cellular growth is only observed at doses >100 μM.3.3. Total hemoglobin accumulation mediated by cinchona alkaloids
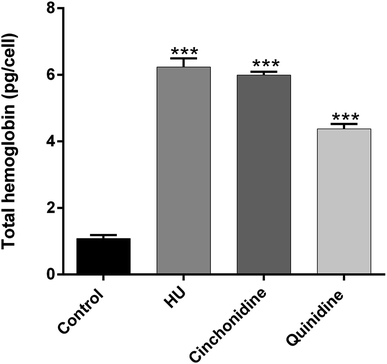
The accumulation of total hemoglobin in pg per cell for cinchonidine and quinidine in comparison of non-treated control group and hydroxyurea (positive control) is presented in Fig. 4. Cinchonidine at 10 μM exerted a maximal effect of THb formation as 6.34 ± 0.59 pg per cell; comparatively similar to THb production by HU at 200 μM (6.43 ± 0.62 pg per cell). Whereas, quinidine (20 μM) also show significant accumulation of total hemoglobin as 4.376 ± 0.27 pg per cell than untreated K562 cells. These results supports that erythroid differentiation of K562 cells is associated with increased in total hemoglobin production.3.4. Cinchona alkaloids induced γ-globin gene expression in K562 cells
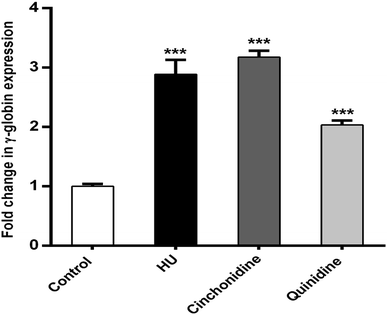
In correspondence of erythroid differentiation and hemoglobinization effects of cinchonidine and quinidine on K562 cells. The qRT-PCR analysis was performed to determine the expression of γ-globin mRNA in K562 cells by using 2−ΔΔCt method. The results illustrate that cinchonidine treated K562 cells augmented significant increase (P < 0.05) in γ-globin expression to 3.17 ± 0.11-fold, quinidine to 2.03 ± 0.07-fold, and HU to 2.88 ± 0.24-fold, when compared to untreated cells using GAPDH as a reference gene. Taken together, cinchona alkaloids mediated significant expression of γ-globin gene is observed from data (Fig. 5). Data is represented as mean fold change ± SEM for at least three independent experiments. RT-Graphs also indicate greater fold increase of γ-globin in cinchona alkaloids and HU treated cells compared to un-induced (control) group.3.5. Cinchonidine and quinidine augment HbF production in K562 cells
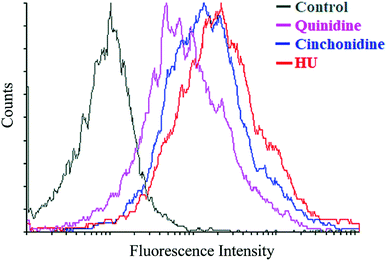
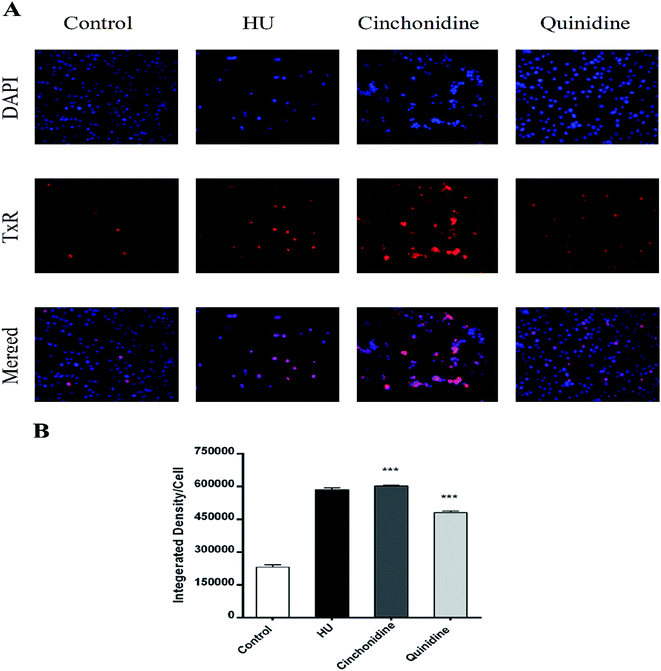
To correlate the qRT-PCR data, flow cytometry and immunofluorescence staining was also performed. FACS analysis showed that treatment of cells with cinchona alkaloids shows increase in F-cells (5–10 fold). In general, a greater increase in HbF production was observed than mRNA levels, demonstrating the effectiveness of cinchonidine and quinidine to augment HbF production in K562 cells (Fig. 6). The immunofluorescence microscopy also showed higher production of HbF induced K562 cells (red) in comparison to total no. of cells (blue) in cinchonidine and quinidine treated cells (Fig. 7A). For each set of treatment integrated density/cell were also quantified using ImageJ and statistical analysis were applied using one-way ANOVA and Bonferroni post hoc test analysis (P < 0.05) (Fig. 7B). These data demonstrated the activation of γ-globin associated with increase in HbF-positive K562 cells after cinchonidine and quinidine treatment.4. Discussion
Hematological disorders like thalassemia and SCA causing a greater health burden particularly, to the countries who are facing a high ratio of carriers and affected individuals. In addition, high costs of modern therapeutic modalities (BMT and gene therapy) and complications related to recurrent blood transfusion limited their effectiveness in economically low income countries.43 For this purpose, several studies have shaped the research efforts to consider pharmacologically mediated stimulation of HbF by potential therapeutic agents.44 Considerable progress has been made to expand the world of these therapeutic HbF inducing agents using cell lines, erythroid progenitor cells from normal donor and β-thalassemia patients, animal models and clinical trials in β-hemoglobinopathies.45In this study, we investigated the potential of cinchona alkaloids (cinchonidine and quinidine) for their ability of erythroid differentiation and fetal hemoglobin production in K562 cells. K562 cells are widely employed as in vitro model for screening of new potent HbF inducing agents, and to evaluate the molecular mechanism.46 Under standard culture condition the cells exhibit low proportion of Hb containing cells, but they showed their commitment towards erythroid lineage; when stimulated with various inducing compounds. Up to date, several HbF inducers have been investigated, but their clinical usefulness is limited because of partial response and unwanted side effects.14,43,47,48 The limitation to the use of HU and other cytotoxic inducers owes the requirement of other HbF-inducing compounds having potential of erythroid differentiation and augmentation of HbF, apparently with lower cytotoxic effects.
The preliminary screening of cinchona alkaloids on K562 cells showed dose-dependent response, cinchonidine and quinidine effectively differentiate K562 cells at 10 μM and 20 μM, respectively. Cinchona alkaloids treated cells showed marked up elevation of the percent benzidine positive (hemoglobin producing) cells as 61.25 ± 1.43% and 60.0 ± 1.59% in cinchonidine and quinidine treated cells respectively, which was significantly higher (P < 0.05) than untreated cells and consistent with HU. Of note, the optimal doses of cinchonidine and quinidine apparently did not show any inhibitory effect on the growth of K562 cells. In contrast, HU at 200 μM which caused similar effect on cell differentiation and HbF induction significantly inhibit cellular proliferation. Further validation for cytotoxic effects has been done by Alamar Blue assay, which outlined the persistent viable effects of cinchonidine and quinidine treated cells than HU. Following erythroid induction, total hemoglobin accumulation was also assessed by treating cells with indicated inducing concentration. Hb accumulation is cinchonidine directed peculiarity. Erythroid differentiation was found to be associated with higher expression of γ-globin mRNA and HbF production in both cinchonidine and quinidine treated K562 cells. The quantitative RT-PCR analysis shows constitutive higher fold change of γ-globin to 3.17 ± 0.11 of cinchonidine treated cells and quinidine to 2.03 ± 0.07 fold in 3 independent experiment in triplicates (P < 0.05). Further experiments employing immunocytochemistry and flow cytometry was also examined. The data obtained from these experiments were fully in agreement with qRT-PCR analysis, revealing preferential increase in production of fetal hemoglobin. The findings of this study showed promising HbF inducing activity of cinchonidine and quinidine, it may have practical impact to inline it as compensatory and potent therapeutic agent for the efficient management of β-thalassemia.
5. Conclusion
In this study, the rationale of using safe and effective therapeutic agents for HbF induction has been presented. Our data demonstrated that cinchona alkaloids with all their biological importance documented till now, showed powerful erythroid differentiation in K562 cells, which is paralleled well with increased γ-globin gene expression and HbF production without any prominent inhibitory effects on the cells than the reference drug (HU). However, our observations would only serve as groundwork for anticipating potential of cinchona alkaloids to augment HbF production. Further investigation on erythroid progenitors from normal donor and β-thalassemia patients, and on animal model is crucial to predict the accurate therapeutic effects in living system.Author contributions
FI actively performed all experimental work including preparation of samples, interpretation of data and wrote the manuscript. HA assisted with the processing of experimental design and reviewing of the manuscript. SGM proposed the study design, provided conceptual and technical guidance, and assisted in preparation and writing of the manuscript.Conflicts of interest
Authors confirm that there are no known conflicts of interest associated with this publication and there has been no significant financial support for this work that could have influenced its outcome.Abbreviations
| AB | Alamar Blue |
| ANOVA | Analysis of variance |
| Anti-HbF-PE antibody | Anti-HbF-phycoerythrin conjugated monoclonal antibodies |
| ATCC | American Type Culture Collection |
| BMT | Bone Marrow Transplant |
| BSA | Bovine Serum Albumin |
| cDNA | Complementary DNA |
| DAPI | 4′,6-Diamidino-2-phenylindole, dihydrochloride |
| DMSO | Dimethyl sulfoxide |
| DNA | Deoxyribonucleotide acid |
| FACs | Fluorescence-activated cell sorting |
| FBS | Fetal Bovine Serum |
| FDA | Food and Drug Administration |
| GAPDH | Glyceraldehyde-3-phosphate dehydrogenase |
| H2O2 | Hydrogen peroxide |
| Hb | Hemoglobin |
| HbF | Fetal hemoglobin |
| HLA | Human Leukocyte Antigen |
| HU | Hydroxyurea |
| ICC | Immunocytochemistry |
| mRNA | Messenger RNA |
| NCBI | National Center for Biotechnology Information |
| NIH | National Institutes of Health |
| NIS-Elements Software | Nikon Instruments Software |
| PBS | Phosphate Buffer Saline |
| qRT-PCR | Real-time polymerase chain reaction |
| RBC | Red Blood Cell |
| RNA | Ribonucleotide acid |
| RPMI-1640 medium | Roswell Park Memorial Institute medium |
| SCA | Sickle Cell Anemia |
| SEM | Standard Error of Mean |
| THb | Total Hemoglobin |
| UAE | United Arab Emirates |
| USA | United States of America |
Acknowledgements
The authors are thankful to Dr Bushra Taj for her technical assistance in flow cytometry analysis. This work was supported by Dr Panjwani Center for Molecular Medicine and Drug Research, ICCBS, University of Karachi.References
- M. Kosaryan, K. Vahidshahi, H. Karami, M. A. Forootan and M. Ahangari, Hemoglobin, 2007, 31, 453–462 CrossRef CAS PubMed.
- H. Darvishi Khezri, E. Salehifar, M. Kosaryan, A. Aliasgharian, H. Jalali and A. Hadian Amree, Adv. Pharmacol. Sci., 2016, 2016, 3046373 Search PubMed.
- E. Vichinsky, E. Butensky, E. Fung, M. Hudes, E. Theil, L. Ferrell, R. Williams, L. Louie, P. D. Lee and P. Harmatz, Am. J. Hematol., 2005, 80, 70–74 CrossRef PubMed.
- K. K. Bhattacharyya and U. B. Mondal, Asian Journal of Medicine and Health, 2017, 2(1), 1–5 CrossRef.
- J.-A. Ribeil, S. Hacein-Bey-Abina, E. Payen, A. Magnani, M. Semeraro, E. Magrin, L. Caccavelli, B. Neven, P. Bourget and W. El Nemer, N. Engl. J. Med., 2017, 376, 848–855 CrossRef CAS PubMed.
- M. C. Walters, R. Storb, M. Patience, W. Leisenring, T. Taylor, J. E. Sanders, G. E. Buchanan, Z. R. Rogers, P. Dinndorf and S. C. Davies, Blood, 2000, 95, 1918–1924 CAS.
- K. M. Musallam, A. T. Taher, M. D. Cappellini and V. G. Sankaran, Blood, 2013, 121, 2199–2212 CrossRef CAS PubMed.
- N. F. Olivieri and D. Weatherall, Hum. Mol. Genet., 1998, 7, 1655–1658 CrossRef CAS PubMed.
- T. R. Kinney, R. W. Helms, E. E. O'Branski, K. Ohene-Frempong, W. Wang, C. Daeschner, E. Vichinsky, R. Redding-Lallinger, B. Gee and O. S. Platt, Blood, 1999, 94, 1550–1554 CAS.
- Y. Watanapokasin, S. Chuncharunee, D. Sanmund, W. Kongnium, P. Winichagoon, G. P. Rodgers and S. Fucharoen, Exp. Hematol., 2005, 33, 1486–1492 CrossRef CAS PubMed.
- M. M. Okam, S. Shaykevich, B. L. Ebert, A. M. Zaslavsky and J. Z. Ayanian, Medical Care, 2014, 52, 612 CrossRef PubMed.
- M. L. Randi, E. Ruzzon, F. Tezza, G. Luzzatto and F. Fabris, Platelets, 2005, 16, 181–184 CrossRef CAS PubMed.
- J. J. Strouse, S. Lanzkron, M. C. Beach, C. Haywood, H. Park, C. Witkop, R. F. Wilson, E. B. Bass and J. B. Segal, Pediatrics, 2008, 122, 1332–1342 CrossRef PubMed.
- N. Bianchi, C. Zuccato, I. Lampronti, M. Borgatti and R. Gambari, J. Evidence-Based Complementary Altern. Med., 2009, 6, 141–151 CrossRef PubMed.
- S. P. Perrine, S. A. Castaneda, M. S. Boosalis, G. L. White, B. M. Jones and R. Bohacek, Ann. N. Y. Acad. Sci., 2005, 1054, 257–265 CrossRef CAS PubMed.
- E. Fibach, E. Prus, N. Bianchi, C. Zuccato, G. Breveglieri, F. Salvatori, A. Finotti, M. Lipucci di Paola, E. Brognara and I. Lampronti, Int. J. Mol. Med., 2012, 29, 974–982 CAS.
- G. Feriotto, N. Marchetti, V. Costa, P. Torricelli, S. Beninati, F. Tagliati and C. Mischiati, Fitoterapia, 2018, 127, 173–178 CrossRef CAS PubMed.
- I. Lampronti, N. Bianchi, M. Borgatti, E. Fibach, E. Prus and R. Gambari, Eur. J. Haematol., 2003, 71, 189–198 CrossRef CAS PubMed.
- N. Bianchi, F. Osti, C. Rutigliano, F. G. Corradini, E. Borsetti, M. Tomassetti, C. Mischiati, G. Feriotto and R. Gambari, Br. J. Haematol., 1999, 104, 258–265 CrossRef CAS PubMed.
- K. Liu, H. Xing, S. Zhang, S. ming Liu and M. chiu Fung, Blood Cells, Mol., Dis., 2010, 45, 269–275 CrossRef CAS PubMed.
- N. Bianchi, C. Chiarabelli, M. Borgatti, C. Mischiati, E. Fibach and R. Gambari, Br. J. Haematol., 2001, 113, 951–961 CrossRef CAS PubMed.
- N. Bianchi, M. Borgatti, E. Fibach, E. Prus, C. Zuccato, G. Breveglieri, P. G. Baraldi, R. Romagnoli and R. Gambari, Int. J. Mol. Med., 2009, 23, 105–111 CAS.
- N. Y. H. Ng and C. H. Ko, Int. Scholarly Res. Not., 2014, 2014, 123257 Search PubMed.
- M. Frederich, M.-P. Hayette, M. Tits, P. De Mol and L. Angenot, Antimicrob. Agents Chemother., 1999, 43, 2328–2331 CrossRef CAS PubMed.
- A. Murauer and M. Ganzera, J. Chromatogr. A, 2018, 1554, 117–122 CrossRef CAS PubMed.
- A. Leverrier, J. Bero, J. Cabrera, M. Frédérich, J. Quetin-Leclercq and J. A. Palermo, Eur. J. Med. Chem., 2015, 100, 10–17 CrossRef CAS PubMed.
- J. Achan, A. O. Talisuna, A. Erhart, A. Yeka, J. K. Tibenderana, F. N. Baliraine, P. J. Rosenthal and U. D'Alessandro, Malar. J., 2011, 10, 144 CrossRef CAS PubMed.
- H. Ginsburg and E. Deharo, Malar. J., 2011, 10, S1 CrossRef PubMed.
- K. Kacprzak, P. Ruszkowski, L. Valentini, A. Huczyński and D. Steverding, Chem. Biol. Drug Des., 2018, 92, 1778–1787 CrossRef CAS PubMed.
- G. Da Violante, N. Zerrouk, I. Richard, G. Provot, J. C. Chaumeil and P. Arnaud, Biol. Pharm. Bull., 2002, 25, 1600–1603 CrossRef CAS.
- R. Gambari, F. Amelotti and R. Piva, Experientia, 1985, 41, 673–675 CrossRef CAS PubMed.
- N. Ueki, L. Zhang and M. J. Hayman, Mol. Cell. Biol., 2004, 24, 10118–10125 CrossRef CAS PubMed.
- C. Mischiati, A. Sereni, I. Lampronti, N. Bianchi, M. Borgatti, E. Prus, E. Fibach and R. Gambari, Br. J. Haematol., 2004, 126, 612–621 CrossRef CAS PubMed.
- D. Zhang, E. Cho and J. Wong, Cell Res., 2007, 17, 804 CrossRef CAS PubMed.
- T. Kuda and T. Yano, Food Control, 2003, 14, 455–461 CrossRef.
- S. N. Rampersad, Sensors, 2012, 12, 12347–12360 CrossRef CAS PubMed.
- F. Hanif, K. Perveen, H. Jawed, A. Ahmed, S. M. Malhi, S. Jamall and S. U. Simjee, Cancer Cell Int., 2014, 14, 133 CrossRef PubMed.
- J. Sambrook, Molecular Cloning: A Laboratory Manual, 1981, 7, pp. 12–17, 52 Search PubMed.
- C. A. Heid, J. Stevens, K. J. Livak and P. M. Williams, Genome Res., 1996, 6, 986–994 CrossRef CAS PubMed.
- A. Untergasser, I. Cutcutache, T. Koressaar, J. Ye, B. C. Faircloth, M. Remm and S. G. Rozen, Nucleic Acids Res., 2012, 40, e115 CrossRef CAS PubMed.
- C. Chiarabelli, N. Bianchi, M. Borgatti, E. Prus, E. Fibach and R. Gambari, Haematologica, 2003, 88, 826–827 CAS.
- N. Bianchi, M. Borgatti and R. Gambari, Minerva Biotecnologica, 2003, 15, 137 Search PubMed.
- R. Gambari and E. Fibach, Curr. Med. Chem., 2007, 14, 199–212 CrossRef CAS PubMed.
- B. S. Pace and S. Zein, Dev. Dyn., 2006, 235, 1727–1737 CrossRef CAS PubMed.
- N. F. Olivieri, D. C. Rees, G. D. Ginder, S. L. Thein, J. S. Waye, L. Chang, G. M. Brittenham and D. J. Weatherall, Ann. N. Y. Acad. Sci., 1998, 850, 100–109 CrossRef CAS PubMed.
- G. Stamatoyannopoulos, A. W. Nienhuis, P. Leder and P. Majerus, The molecular basis of blood diseases, Saunders, 3 edn, 1987 Search PubMed.
- T. Rutherford, J. Clegg and D. Weatherall, Nature, 1979, 280, 164 CrossRef CAS PubMed.
- M. Bradai, M. T. Abad, S. Pissard, F. Lamraoui, L. Skopinski and M. de Montalembert, Blood, 2003, 102, 1529–1530 CrossRef CAS PubMed.
| This journal is © The Royal Society of Chemistry 2019 |

