 Open Access Article
Black titania nanotubes/spongy graphene nanocomposites for high-performance supercapacitors
Dalia M. El-Gendyab,
Nabil A. Abdel Ghany *b and
Nageh K. Allam
 *a
*a
aEnergy Materials Laboratory, School of Sciences and Engineering, The American University in Cairo, New Cairo 11835, Egypt. E-mail: Nageh.allam@aucegypt.edu
bPhysical Chemistry Department, National Research Centre, Dokki, Cairo 12622, Egypt. E-mail: na_manakhly@yahoo.co.uk
First published on 23rd April 2019
Abstract
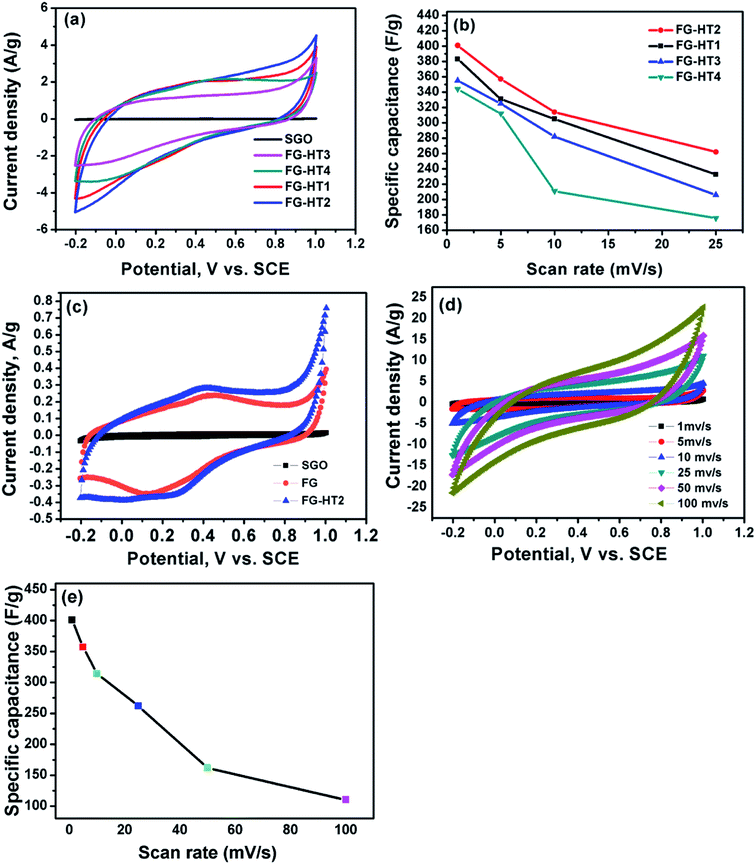
A simple method is demonstrated to prepare functionalized spongy graphene/hydrogenated titanium dioxide (FG-HTiO2) nanocomposites as interconnected, porous 3-dimensional (3D) network crinkly sheets. Such a 3D network structure provides better contact at the electrode/electrolyte interface and facilitates the charge transfer kinetics. The fabricated FG-HTiO2 was characterized by X-ray diffraction (XRD), FTIR, scanning electron microscopy (FESEM), Raman spectroscopy, thermogravimetric analysis (TGA), UV-Vis absorption spectroscopy, and transmission electron microscopy (TEM). The synthesized materials have been evaluated as supercapacitor materials in 0.5 M H2SO4 using cyclic voltammetry (CV) at different potential scan rates, and galvanostatic charge/discharge tests at different current densities. The FG-HTiO2 electrodes showed a maximum specific capacitance of 401 F g−1 at a scan rate of 1 mV s−1 and exhibited excellent cycling retention of 102% after 1000 cycles at 100 mV s−1. The energy density was 78.66 W h kg−1 with a power density of 466.9 W kg−1 at 0.8 A g−1. The improved supercapacitor performance could be attributed to the spongy graphene structure, adenine functionalization, and hydrogenated titanium dioxide.
Introduction
Electrochemical supercapacitors have attracted great attention lately due to their high power density, reversibility, and long cycle life.1 Based on their charge storage mechanism, supercapacitors can be classified into two types: electric double-layer capacitors (EDLCs) and pseudocapacitors. While EDLCs store energy physically by charge accumulation at the electrode/electrolyte interface,2 pseudocapacitors (battery-type) store energy chemically by fast and reversible faradaic reactions at the electrode surface.3 The pseudocapacitive materials, such as metal oxides and conducting polymers,4,5 can achieve relatively higher capacitance than EDLCs. However, they are limited by the low cyclability due to the structural degradation of the electrodes during the faradaic reactions.6 To this end, carbonaceous materials loaded with metal oxides or polymers are widely investigated as alternatives,7–9 including carbon nanotubes (CNTs), activated carbons (AC), graphite, graphene oxide, and graphene. These materials have been actively used due to their advantages, including ease of fabrication and workability under a wide temperature range. Different modifications have applied to those materials to increase their surface area and tailor their pore size distribution (PSD), resulting in an improvement of their energy and power densities.8,9Specially, graphene-based materials are given much consideration as an effective electrode material owing to their unique properties, such as high specific surface area, excellent chemical stability, electrical and mechanical properties, and the large scale production of graphene.10–12 To this end, the Hummers' method is widely used to produce graphene oxides (GO).13 However, the poor electrical conductivity of GO reduces the efficiency of charge transfer and reduces long cycle life.14 These problems can be overcome by removing partially the O-containing groups via chemical reduction or by thermal annealing.15,16 Also, by using reducing agents such as (hydrazine, dimethyl hydrazine, and NaBH4) to prepare the graphene. This method is harmful to the environment and the resulted graphene has a strong tendency to restack due to the π–π interactions.17,18 Therefore, an easy, eco-friendly process to reduce GO is urgently required. Carbon based materials have the high specific surface area, high electrical conductivity, and highly stable. But, carbon based material suffer from low energy density. Compared to, transition metal oxides have high specific capacitance and energy densities. For examples ruthenium, oxide-based materials used to supercapacitors application have high specific capacitance but are more expensive than the other metal oxides such as MnO2, Co3O4, TiO2, and SnO2. Therefore, it is rational to combine low-cost metal oxides with carbon materials to obtain high energy density and high power density through the preparation of a composite.19,20
Herein, a simple method is confirmed to prepare functionalized spongy graphene/hydrogenated titanium dioxide composites to prevent graphene sheets from restacking together, resulting in interconnected, porous 3D network crinkly sheets. Such 3D network structure provides better contact at the electrode/electrolyte interface and facilitates the charge transfer kinetics. Functionalized spongy graphene/hydrogenated titanium dioxide has been produced by functionalization of the graphene oxide with adenine. Afterward hydrothermal, functionalized spongy graphene oxide (FGO) with HTiO2 was obtained, which helps to prevent the stacking between graphene interlayers. The FG-HTiO2 electrodes showed high performance upon their use in electrochemical capacitor assembly.
Experimental methods
Materials
Graphite powder (<20 μm) and Nafion 117 solution (5%) were purchased from Sigma Aldrich. Sulphuric acid (H2SO4, 99%) from Sham Lab. Hydrogen peroxide (H2O2, 30% w/v) from LOBA Chemie, absolute ethanol and HCl (33%) were purchased from El-Nasr Pharmaceutical Company, Egypt. Finally, potassium permanganate (KMnO4, 99%), from Arabic Laboratory Equipment Co., Ti foils (99.5% purity, 0.1 mm thickness) were purchased from Sigma Aldrich and, before anodization, cleaned by sonicating in acetone, ethanol, and followed by washing with deionized (DI) water and drying in air. The electrolytes were HClO4 purchased from Sigma Aldrich, and all the solutions were prepared from reagent-grade chemicals and deionized water. Adenine (Merck) was used directly without further purification. Distillated water was used for washing the products.Synthesis of spongy graphene oxide (SGO)
GO was prepared from natural graphite using a modified Hummers' method.21 In a typical experiment, graphite (1.5 g), NaNO3 (1.5 g) and H2SO4 (70 ml) were mixed and stirred in an ice bath. Subsequently, 9 g of KMnO4 were added slowly. The reaction mixture was warmed to 40 °C and stirred for 1 h. Water (100 ml) was then added and the temperature was increased to 90 °C for 30 min. Finally, 300 ml of water were added slowly, followed by the slow addition of 10 ml of 30% H2O2. The reaction mixture was filtered and washed with 0.1 M HCl and water. The GO precipitate was dispersed in a water/methanol (1![[thin space (1/6-em)]](https://www.rsc.org/images/entities/char_2009.gif) :
:![[thin space (1/6-em)]](https://www.rsc.org/images/entities/char_2009.gif) 5) mixture and purified with three repeated centrifugation steps at 10
5) mixture and purified with three repeated centrifugation steps at 10![[thin space (1/6-em)]](https://www.rsc.org/images/entities/char_2009.gif) 000 rpm for 30 min. The purified sample was dispersed in deionized water and centrifuged at 2500 rpm and finally washed with deionized water and sonicated for 1 hour to obtain highly exfoliated graphene oxide. The GO precipitate was dispersed in water/methanol mixture and purified with repeated centrifugation steps at 10
000 rpm for 30 min. The purified sample was dispersed in deionized water and centrifuged at 2500 rpm and finally washed with deionized water and sonicated for 1 hour to obtain highly exfoliated graphene oxide. The GO precipitate was dispersed in water/methanol mixture and purified with repeated centrifugation steps at 10![[thin space (1/6-em)]](https://www.rsc.org/images/entities/char_2009.gif) 000 rpm for 30 min. Note that washing with 0.1 M HCl and water resulted in highly exfoliated GO sheets. To prepare SGO, GO solution (4 mg l−1) was frozen at −18 °C for 2 days. After the GO solution was completely frozen, the tube was peregrinated to a freeze-dryer and dried at a temperature of −53 °C and a pressure of 10 Pa for 3 days.22
000 rpm for 30 min. Note that washing with 0.1 M HCl and water resulted in highly exfoliated GO sheets. To prepare SGO, GO solution (4 mg l−1) was frozen at −18 °C for 2 days. After the GO solution was completely frozen, the tube was peregrinated to a freeze-dryer and dried at a temperature of −53 °C and a pressure of 10 Pa for 3 days.22
Preparation of adenine-functionalized graphene oxide
GO (0.1 g) was dispersed in distilled water (10 ml), then (0.3 g) adenine and equimolar amount of NaOH in distilled water (10 ml) were added. The mixture was stirred for 24 h. The resulted precipitate was centrifuged, washed well with water/ethanol mixture and finally dried at 60 °C.23Preparation of TiO2 and hydrogenated TiO2 (H-TiO2) nanotubes powder
Pieces Ti foil (1 cm × 1 cm) was anodized in 0.1 M HClO4 aqueous electrolyte in a two-electrode cell with the titanium foil as the working electrode and a platinum foil as the counter electrode at 25 °C and a constant potential of 20 V. Finally, the foil was converted into TiO2 nanotube powder. Later, the as-grown TiO2 nanotube powder (white precipitate) was washed several times with DI water, collected by centrifugation, and lastly oven-dried at 60 °C about 15 h.24 Eventually, a white powder was obtained and to produce well-defined crystalline structures, sample A was annealed at 550 °C under air, while sample B was annealed at 550 °C under hydrogen to compare structures of powders for 2 h with a heating rate of 30 °C min−1 using Advantec KM-100 electric muffle furnaces.Preparation of functionalized graphene-hydrogenated titanium (FG-HTiO2)
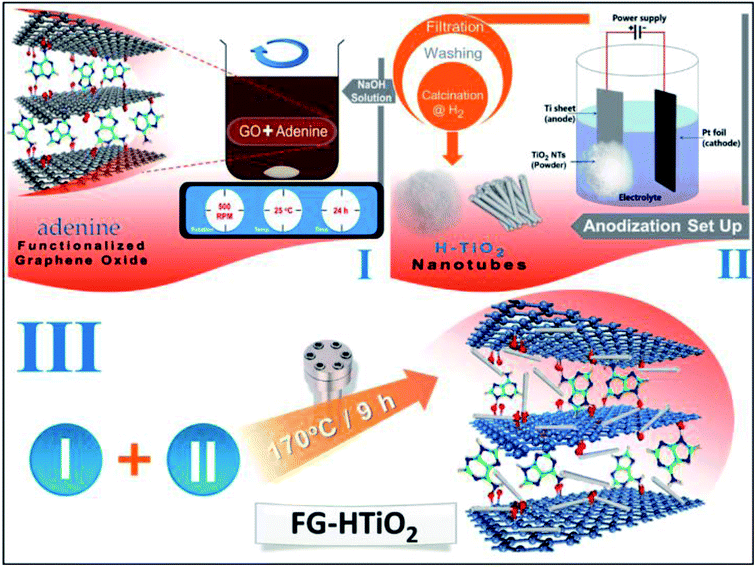
The functionalized graphene-hydrogenated TiO2 was prepared by the hydrothermal reduction method. Briefly a specific amount of functionalized graphene oxide powder with hydrogenated TiO2 equivalent to 10, 20, 25 and 30 wt% from FGO mass were added to a 100 ml conical flask containing 40 ml of deionized water and sonicated for 30 min to obtain a homogeneous dispersion; the samples were named as FG-HT1, FG-HT2, FG-HT3 and FG-HT4, respectively. The solutions were transferred to a Teflon-lined autoclaves and heated at 170 °C for 8 h, and then left to cool at room temperature to get grey product. These products were washed several times with deionized water and collected through centrifugation. Finally, the solid products were dried in an oven at 60 °C. The steps are summarized in Scheme 1.Preparation of electrodes and electrochemical measurements
Glassy carbon (GC) electrode (5.0 mm diameter) was polished with alumina nanopowder and rinsed with deionized water. Fresh dispersion of the sample was prepared for each experiment by dispersing 5.0 mg of the FG powder in 0.5 ml Nafion 117 solution (1%) by ultra-sonication for 30 min. Then 10 μl suspension of the material was cast onto the surface of the electrode with a micropipette, finally, the working electrode was dried at 60 °C for 10 min and left to cool down. All the electrochemical measurements were done in a three-electrode system: where the working electrode was made from a glassy carbon disk, the standard calomel electrode (SCE) and platinum wire were used as reference and counter electrodes, respectively. The electrochemical measurements were carried out in 0.5 M H2SO4 using Auto lab-302N electrochemical workstation (Metrohm). The cyclic voltammetry (CV) measurements were done in the potential range −0.2 to 1 V at various scan rates (1–100 mV s−1). Galvanostatic charge/discharge measurements were run from −0.2 to 1 V at current densities of 0.8, 1, 2, 3, A g−1.Characterization techniques
The crystal structure of the prepared materials was examined by X-ray diffraction (XRD, XPERT-PRO-Analytical) with Cu Kα radiation (λ = 1.54 Å). The surface morphology was investigated by field-emission scanning electron microscope (FESEM-Zeiss SEM Ultra-60). The morphology of the samples was investigated using high-resolution transmission electron microscope (HRTEM, JOEL JEM-2100) operating at an accelerating voltage of 120 kV. The infrared (IR) spectra were recorded using a JASCO spectrometer (FT/IR-6300 type A) in the range 400–4000 cm−1. UV/Vis spectrophotometric measurements were made using a Shimadzu 2040 spectrophotometer. Raman measurements were performed using a micro-Raman microscope with an excitation laser beam wavelength of 325 nm. The weight loss of the samples was collected by TGA thermal analyzer (TA TGA-Q500) from room temperature to 800 °C at a heating rate 10 °C min−1 in nitrogen atmosphere, the time-dependent anodization currents were recorded using a computer controlled Keithley 2000 multimeter and Advantec KM-100 electric muffle furnaces.Results and discussion
Fig. 1 shows FESEM images of the fabricated materials. Fig. 1a depicts the surface of the fabricated spongy graphene oxide (SGO), indicating a great increase in the thickness of the layers, which is possibly due to the formation of oxygen groups in the basal plane of graphene. Upon the addition of adenine, Fig. 1b, the graphene becomes more exfoliated with further increase in volume, resulting in flake-like structure with wrinkled edges and crumbled graphene morphology. Fig. 1c shows typical SEM images of the side and close-up top view of the nanotubes powder prepared in HClO4 electrolyte by rapid breakdown anodization. The tubes are well-arranged and produce very promptly in dense bundles of approximately 20–25 μm in length with average nanotube diameter of 24 nm. Fig. 1d shows an FESEM image of the hydrogenated titanium dioxide nanotubes (H-TiO2 NTs) grown on FG. The intercalation of H-TiO2 nanotubes between graphene layers plays an effective role to accumulate a large amount of ion salts on the surface of the electrode. Moreover, this unique morphology is useful to prevent the aggregation of the graphene sheets. The EDS spectrum of the graphene-hydrogenated TiO2 hybrid nanocomposite is shown in Fig. 1e, indicating the presence of carbon (C), titanium (Ti), and oxygen (O) elements. The Ti and O elements originated from the TiO2 nanoparticles, and the C was contributed by the graphene nanosheets. The corresponding TEM images, Fig. 1f showing the graphene-hydrogenated TiO2 hybrid nanostructure is a smooth and transparent surface with a nanotubular structure of TiO2 nanotubes.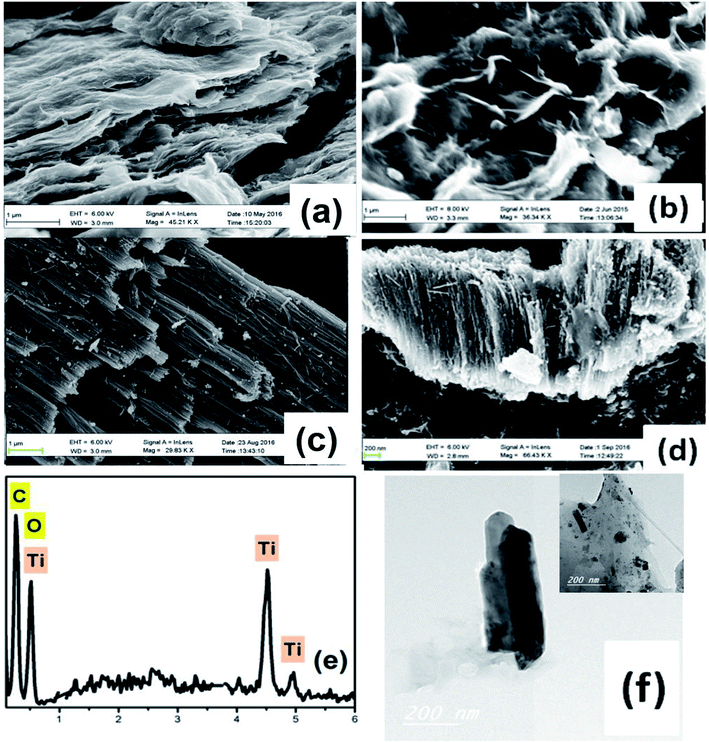 | ||
| Fig. 1 FESEM images of (a) spongy GO, (b) FGO, (c) HTiO2, (d) FG-HTiO2, (e) EDS image and, (f) the TEM image of FG-HTiO2 of the functionalize graphene-hydrogenated TiO2 hybrid nanostructure. | ||
Fig. 2a shows the XRD pattern of pristine and H![[thin space (1/6-em)]](https://www.rsc.org/images/entities/char_2009.gif) :
:![[thin space (1/6-em)]](https://www.rsc.org/images/entities/char_2009.gif) TiO2 samples, revealing major peaks at 2Θ of 25.3 37.84, 48.07, 53.95 and 55.10, with d of 3.51, 2.37, 1.89, 1.69, and 1.66 Å corresponding to diffraction from (101), (044), (200), (105) and (211) planes of the tetragonal anatase TiO2 phase, respectively. Note that the hydrogenation process does not change the crystalline phase of TiO2. However, the intensity and the peaks of hydrogenated TiO2 is higher than that of pristine TiO2 and the crystallite size of H
TiO2 samples, revealing major peaks at 2Θ of 25.3 37.84, 48.07, 53.95 and 55.10, with d of 3.51, 2.37, 1.89, 1.69, and 1.66 Å corresponding to diffraction from (101), (044), (200), (105) and (211) planes of the tetragonal anatase TiO2 phase, respectively. Note that the hydrogenation process does not change the crystalline phase of TiO2. However, the intensity and the peaks of hydrogenated TiO2 is higher than that of pristine TiO2 and the crystallite size of H![[thin space (1/6-em)]](https://www.rsc.org/images/entities/char_2009.gif) :
:![[thin space (1/6-em)]](https://www.rsc.org/images/entities/char_2009.gif) TiO2 (31.8 nm) is larger than that of pristine TiO2 (23.6 nm), indicating the creation of oxygen vacancies upon hydrogen annealing leading to the formation of Ti3+.25 Fig. 2b compares the XRD patterns of pristine graphite, SGO, FG, HTiO2 and FG-HTiO2. An intense peak centred at 2Θ = 26.5° was observed for graphite. The broad peak observed in the XRD pattern of SGO centred at 2Θ = 12° proves the formation of abundant oxygen-containing groups by the oxidation process. After functionalization and hydrothermal treatment, the SGO is reduced and converted into FG, as indicated by the new characteristic peak at 2θ = 24.8°. Notably, in case of HTiO2 nanocomposite, the main peak appeared at 2θ = 25.1° indexed to the anatase phase of TiO2 and the main characteristic peak of FG at 25.0° leads to an overlap with the (101) peak of anatase TiO2 at 25.1.26
TiO2 (31.8 nm) is larger than that of pristine TiO2 (23.6 nm), indicating the creation of oxygen vacancies upon hydrogen annealing leading to the formation of Ti3+.25 Fig. 2b compares the XRD patterns of pristine graphite, SGO, FG, HTiO2 and FG-HTiO2. An intense peak centred at 2Θ = 26.5° was observed for graphite. The broad peak observed in the XRD pattern of SGO centred at 2Θ = 12° proves the formation of abundant oxygen-containing groups by the oxidation process. After functionalization and hydrothermal treatment, the SGO is reduced and converted into FG, as indicated by the new characteristic peak at 2θ = 24.8°. Notably, in case of HTiO2 nanocomposite, the main peak appeared at 2θ = 25.1° indexed to the anatase phase of TiO2 and the main characteristic peak of FG at 25.0° leads to an overlap with the (101) peak of anatase TiO2 at 25.1.26
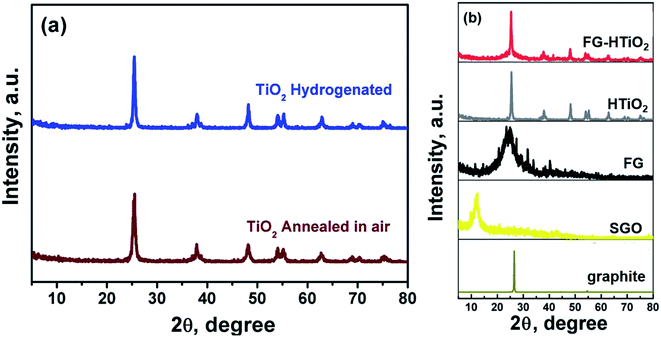 | ||
| Fig. 2 XRD patterns of (a) air- and H2-annealed TiO2, and (b) pristine graphite, SGO, FG, HTIO2 and FG-HTiO2. | ||
Fig. 3a compares the FTIR spectra of air and hydrogen-annealed titania samples, showing similar absorption features in the range 500–4000 cm−1. Note the appearance of OH absorption bands near 3400 cm−1, owing to a bridging OH group (Fig. 3b). The peaks at ∼3700 cm−1 can be ascribed to the presence of the O–H stretching and wagging modes. The strength of the terminal O–H mode is reduced when white TiO2 is changed to black TiO2 upon hydrogen annealing. Note that incorporated hydrogen into the TiO2 probably does not passivize a significant number of O dangling bonds as this would otherwise increase the absorption.26 Fig. 3b also shows the spectra of GO, FGO, FG, and FG-HTiO2. The broad band centred around 3563 cm−1 can be assigned to O–H stretching vibrations ν(OH2) attributed to adsorbed water. The other bands appeared at 1725 cm−1 can be attributed to the stretching vibrations ν(C![[double bond, length as m-dash]](https://www.rsc.org/images/entities/char_e001.gif) O) of COOH group corresponding to carbonyl and carboxyl groups, the band at 1621 cm−1 attributed to in-plane vibration (C
O) of COOH group corresponding to carbonyl and carboxyl groups, the band at 1621 cm−1 attributed to in-plane vibration (C![[double bond, length as m-dash]](https://www.rsc.org/images/entities/char_e001.gif) C) from un-oxidized sp2 CC bonds, the intense band at 1378 cm−1 corresponding to O–H deformation of C–OH group, and the band at 101 cm−1 attributed to ν(C–O) stretching vibrations mode.26 The peak at 1725 cm−1 almost disappears and the peak emerged at 1637 cm−1 is characteristic of the C
C) from un-oxidized sp2 CC bonds, the intense band at 1378 cm−1 corresponding to O–H deformation of C–OH group, and the band at 101 cm−1 attributed to ν(C–O) stretching vibrations mode.26 The peak at 1725 cm−1 almost disappears and the peak emerged at 1637 cm−1 is characteristic of the C![[double bond, length as m-dash]](https://www.rsc.org/images/entities/char_e001.gif) O stretching in the amide group, which cannot be found in the spectrum of GO. Stretching of the amide C–N appears as a strong peak at 1188 cm−1. The peaks at 1560 and 1618 cm−1 are characteristic of graphene vibration, and the peak attributed to the OH and NH stretching groups at 3475 cm−1 confirm the covalent functionalization of the neat graphite by adenine, assuring the successful functionalization process. The peak at 3415 cm−1 is attributed to N–H stretching.27 These results demonstrate that adenine molecules were covalently bonded to GO by the amide linkage. The peak observed at 651 cm−1 corresponds to the Ti–O–Ti vibration of the TiO2 phase.28 For the graphene-TiO2 hybrid nanostructure, the intensities of the bands corresponding to the oxygen functional groups were reduced compared to GO, signifying the reduction of oxygen in the as-prepared graphene-TiO2 hybrid nanostructures. The strong band observed at 588 cm−1 indicated the Ti–O–C vibration.28 Note that the peak intensity of the C–O and C–O–C (epoxide) groups, respectively, decreased in FGO, FG, and FG-HTiO2 after the hydrothermal reduction with HTiO2 that resulted in FG-HTiO2.
O stretching in the amide group, which cannot be found in the spectrum of GO. Stretching of the amide C–N appears as a strong peak at 1188 cm−1. The peaks at 1560 and 1618 cm−1 are characteristic of graphene vibration, and the peak attributed to the OH and NH stretching groups at 3475 cm−1 confirm the covalent functionalization of the neat graphite by adenine, assuring the successful functionalization process. The peak at 3415 cm−1 is attributed to N–H stretching.27 These results demonstrate that adenine molecules were covalently bonded to GO by the amide linkage. The peak observed at 651 cm−1 corresponds to the Ti–O–Ti vibration of the TiO2 phase.28 For the graphene-TiO2 hybrid nanostructure, the intensities of the bands corresponding to the oxygen functional groups were reduced compared to GO, signifying the reduction of oxygen in the as-prepared graphene-TiO2 hybrid nanostructures. The strong band observed at 588 cm−1 indicated the Ti–O–C vibration.28 Note that the peak intensity of the C–O and C–O–C (epoxide) groups, respectively, decreased in FGO, FG, and FG-HTiO2 after the hydrothermal reduction with HTiO2 that resulted in FG-HTiO2.
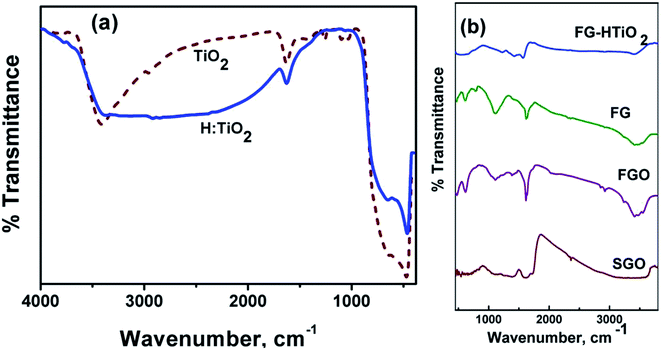 | ||
| Fig. 3 FT-IR spectra of (a) air- and H2-annealed TiO2, and (b) pristine graphite, SGO, FG, HTIO2 and FG-HTiO2. | ||
Raman spectroscopy is an effective process to examine the structural features of carbon-based materials. Fig. 4a shows the Raman spectra for air and hydrogen-annealed TiO2 electrodes. The peak intensity of hydrogenated TiO2 was lower than that of the air-annealed counterpart. The Raman peaks at 144 cm−1 and 636 cm−1 were shifted to a higher frequency, indicating the formation of oxygen vacancies due to the hydrogen annealing, in agreement with Liu et al. who proposed the formation of Ti3+.29 The intensity ratio of the D and G bands (ID/IG) is a convenient parameter for the determination of the sp2 domain size of carbon structures containing sp3 and sp2 domains. GO exhibited the G band at 1576 cm−1 and the D band at 1354 cm−1. While the intensity of the D band for FG-HTiO2 was increased compared to that of SGO, the G band is still prominent and the ID/IG ratio is 0.99 with the ID/IG ratio of FG-HTiO2 being 1.01. The higher ID/IG ratio of FG-HTiO2 (1.01) than that of SGO (0.99) indicates the reduction in the size of the in-plane sp2 domains. The notable bands located at 147 (Eg), 402 (B1g), 513 (A1g), and 635 (Eg) as well as the small peaks at 159 cm−1 are attributed to the intercalated TiO2 nanotubes with graphene.30,31
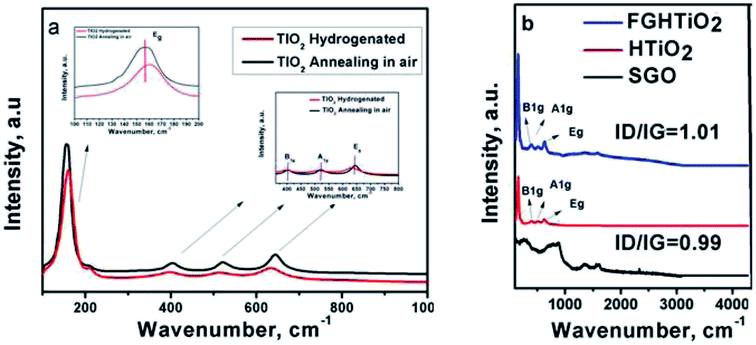 | ||
| Fig. 4 Raman spectra of (a) air- and H2-annealed TiO2, and (b) pristine graphite, SGO, FG, HTIO2 and FG-HTiO2. | ||
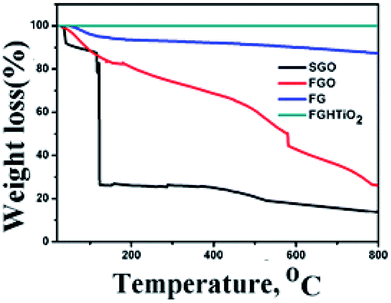
To evaluate the thermal stability of GO, FGO, FG and FG-HTiO2, TGA analysis was performed by heating under N2 atmosphere to 800 °C at a rate of 10 °C min−1, Fig. 5. At temperatures below 100 °C, the mass loss can be related to the removal of adsorbed H2O. For GO, it is thermally unstable and the mass loss occurs in three steps: the first step is detected below 110 °C that can be associated with vapor content and loss of interstitial H2O32 with a total mass loss of ∼8%, the second stage is detected in the range 130–250 °C as a sharp drop peak that accounts for a mass loss of ∼65%, owing to the decay of hydroxyl groups, presented water on GO, and carboxyl group to produce gases such as H2O and CO2. Note that CO2 is generally created because of the decomposition of carboxyl group due to the thermal treatment at temperatures less than 500 °C. The third step is extended from 350 °C up to 800 °C, resulting in a notable mass loss of ∼80%, which can be attributed to the decomposition of carbonyl groups formed on the surface of graphene oxide to yield CO gas.33 FGO showed higher thermal stability than SGO. The first humiliation step of FGO appeared nearly in the similar range to that of SGO (145–173 °C), while the second step of the degradation appeared at a greatly higher temperature of 365–415 °C. Upon functionalization of SGO with adenine, the labile oxygen groups underwent chemical reaction to form a strong covalent bond with the amino groups of adenine, which noticeably decreased the volume of labile groups in FGO. This results in a very low weight loss at about 145–173 °C in FGO, which is in agreement with the decrease in the FTIR peak intensity at 1725 cm−1. This is typical due to the stretching vibrations ν(C![[double bond, length as m-dash]](https://www.rsc.org/images/entities/char_e001.gif) O) of COOH group equivalent to carbonyl and carboxyl groups that have disappeared, with the peak emerged at 1637 cm−1 is characteristic of the C
O) of COOH group equivalent to carbonyl and carboxyl groups that have disappeared, with the peak emerged at 1637 cm−1 is characteristic of the C![[double bond, length as m-dash]](https://www.rsc.org/images/entities/char_e001.gif) O stretching in the amide group,34 see Fig. 3b. The weight loss of the hydrothermally reduced FG shows a slight weight loss of about 10% up to 670 °C, indicating that the oxygen-based groups in GO formed heat-stable structures through covalent bonding with adenine. In the case of the FG-HTiO2 nanocomposite, the weight loss of the sample was greatly limited, which may indicate that FG imposed a control on the mobilization of titanium oxide nanotubes, leading to homogeneous heating and preventing heat concentration. This also supports a strong contact between FG and H-TiO2.
O stretching in the amide group,34 see Fig. 3b. The weight loss of the hydrothermally reduced FG shows a slight weight loss of about 10% up to 670 °C, indicating that the oxygen-based groups in GO formed heat-stable structures through covalent bonding with adenine. In the case of the FG-HTiO2 nanocomposite, the weight loss of the sample was greatly limited, which may indicate that FG imposed a control on the mobilization of titanium oxide nanotubes, leading to homogeneous heating and preventing heat concentration. This also supports a strong contact between FG and H-TiO2.
To study supercapacitive performance of the fabricated samples, cyclic voltammetry (CV) measurements were performed in 0.5 M H2SO4, where the specific capacitance of the electrodes was calculated using eqn (1).
 | (1) |
Galvanostatic charge/discharge measurements are necessary to determine the electrochemical performance of all material to be used as supercapacitors. The specific capacitance was calculated at different current densities using eqn (2)
 | (2) |
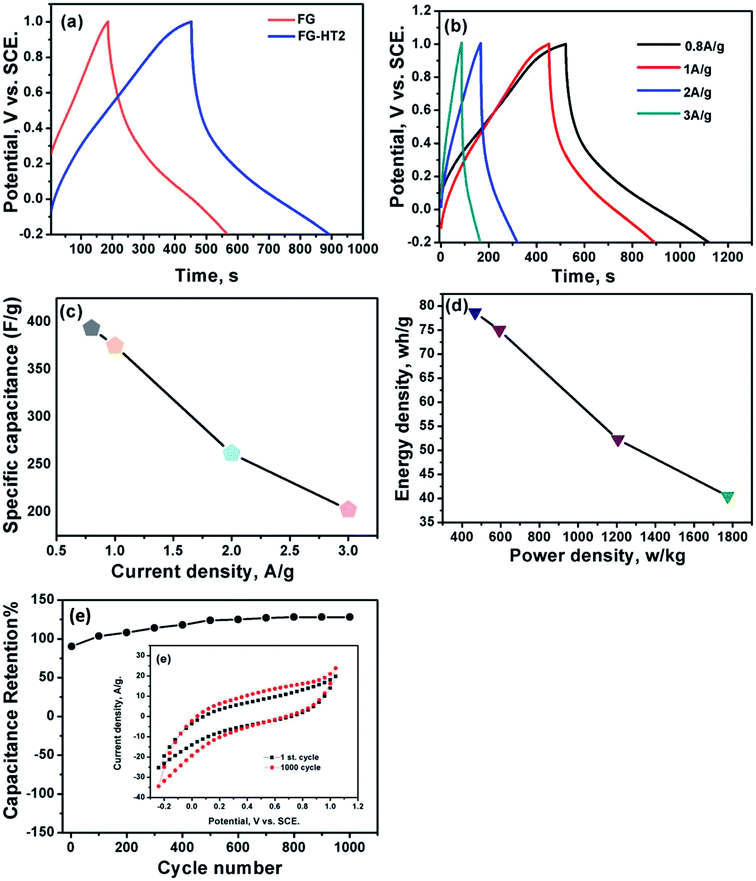
Fig. 7a shows a comparison of the galvanostatic charge/discharge graphs for FG and FG-HTiO2 at 2 A g−1 current density. The FG-HTiO2 nanocomposite achieved better specific capacitance (375 F g−1 at a 1 A g−1) than FG at the same current density. Fig. 7b shows the galvanostatic charge/discharge graphs of the fabricated FG-HTiO2 at different current densities (0.8–3 A g−1). All the charge–discharge curves are quasi-triangular, indicating fast and capable charge transfer and high electrical conductivity.41 This can be attributed to the presence of active nitrogen atoms from adenine and the high electronegativity of nitrogen as well as the hydrogenated titanium dioxide that may create dipoles on the surface of graphene,41,42 which may draw charged species into the surface.43,44 The influence of N, O atoms and HTiO2 on the capacitance can also be ascribed to the inductive effect of the σ-bonded structure from N, O heteroatoms and hydrogenated titania, which help in the polarization of some bonds and distribution of electrons on the surface, resulting in reversible faradaic redox reactions.45 Fig. 7c presents relationship between the specific capacitance and current density, where a decrease in specific capacitance is observed as the current density increases. The calculated specific capacitances obtained from charge and discharge curves of FG-HTiO2 are 393.3, 375, 261.6, and 202.5 F g−1 at 0.8, 1, 2 and 3 A g−1, respectively. Note that the obtained specific capacitance at 0.8 A g−1 (393.3 F g−1) is very close to that calculated from the cyclic voltammograms (401 F g−1), which is much higher than that previously reported for graphene/TiO2 hybrid electrodes.46 Moreover, the FG-HTiO2 electrode exhibits excellent rate capability of 51.5% at a current density of 3 A g−1. The energy and power densities are very important performance metrics of supercapacitors, which can be calculated from the galvanostatic charge/discharge graphs using eqn (3) and (4):
 | (3) |
 | (4) |
Ragone's plot for the FG-HTiO2 electrode at different current densities is shown in Fig. 7d. The energy density can reach up to 78.66 W h kg−1 with a power density of 466.9 W kg−1 at 0.8 A g−1. It is worthy to mention that the achieved energy density for FG-HTiO2 electrode (78.66 W h kg−1) at 0.8 A g−1 is much higher than those reported for graphene-based electrodes fabricated by different methods.23,47–50 Fig. 7e shows the cycle life test of the FG-HTiO2 performed at a scan rate of 100 mV s−1 for 1000 cycles. The specific capacitance sharply increased from the initial cycle until 1000 cycle to reach 100.2% of the initial cycle, indicating the excellent cycling stability of the FG-HTiO2 electrodes. Table 1 compares the obtained results to those reported in literature, showing the superiority of our fabricated hybrid electrodes.
| Material | Synthetic approach | Specific capacitance | Ref. |
|---|---|---|---|
| Graphene/TiO2 hybrid electrodes | Microwave-assisted technique | 165 F g−1 in 1 M Na2SO4 | 39 |
| Coating of TiO2 on graphene | Atomic layer deposition (ALD) | 75 F g−1 and 84 F g−1 in a 1 M KOH | 51 |
| Sulfonated graphene/MnO2/PANI | Polymerization reaction | 276 F g−1 in 1 M Na2SO4 | 52 |
| CoFe2O4/rGO/PANI | Polymerization reaction | 257 F g−1 in 1 M KOH | 53 |
| Graphene/MnO2/PANI | Polymerization reaction | 380 F g−1 in 0.5 M Na2SO4 | 54 |
| Graphene/MnO2/PANI | Polymerization reaction | 395 F g−1 in 1 M H2SO4 | 55 |
| Black titania/spongy graphene | Hydrothermal process | 401 F g−1 in 0.5 M H2SO4 | Current work |
Conclusions
A simple method is demonstrated to prepare functionalized spongy graphene/hydrogenated titanium dioxide (FG-HTIO2) nanocomposite electrodes. The electron microscopy (FESEM and TEM) study showed the formation hydrogenated titanium nanotubes H-TiO2 NTs that are grown onto FG sheets. This was supported by the XRD analysis. Also, the FTIR spectra showed a peak at 3475 cm−1 that is attributed to the OH and NH stretching groups, confirming the covalent functionalization of the neat graphene by adenine, and a peak at 588 cm−1 indicating the Ti–O–C vibration. The higher ID/IG ratio in the Raman spectra of FG-HTiO2 (1.01) than that of GO (0.99) indicates the reduction in the size of the in-plane sp2 domains. Also, the notable bands located at 147 (Eg), 402 (B1g), 513 (A1g) and (635 Eg) as well as the small peaks at 159 cm−1 are attributed to intercalated TiO2 nanotubes, thus confirming the formation of the FG-HTiO2 structure. The TGA analysis of the FG-HTiO2 showed a slight weight loss at 670 °C. Upon their use as supercapacitor electrodes, the FG-HTIO2 electrodes showed a maximum specific capacitance of 401 F g−1 at scan rate of 1 mV s−1 and exhibited excellent cycling retention of 100.2% after 1000 cycles at 100 mV s−1. The energy density was 75 W h kg−1 with a power density of 592.4 W kg−1 at 1 A g−1. These results demonstrate that the fabricated FG-HTiO2 hybrid electrodes are promising electrode materials for high-performance supercapacitors. The specific capacitance improved due to the synergistic effects of the spongy graphene structure, hydrogenated titania and the presence of adenine.Conflicts of interest
The authors declare no competing financial interest.Acknowledgements
The authors acknowledge the financial support of the work by the American University in Cairo and the National Research Centre.References
- D. M. El-Gendy, N. A. A. Ghany, E. F. El Sherbini and N. K. Allam, Green, single-pot synthesis of functionalized Na/N/P co-doped graphene nanosheets for high-performance supercapacitors, J. Electroanal. Chem., 2019, 837, 30–38 CrossRef CAS.
- A. G. Pandolfo and A. F. Hollenkamp, Carbon properties and their role in supercapacitors, J. Power Sources, 2006, 157, 11 CrossRef CAS.
- M. Ramadan, A. M. Abdellah, S. G. Mohamed and N. K. Allam, 3D interconnected binder free electrospun MnO@C nanofibers for supercapacitor devices, Sci. Rep., 2018, 8, 7988 CrossRef PubMed.
- A. E. Elkholy, F. E. Heakal and N. K. Allam, Nanostructured spinel manganese cobalt ferrite for high-performance supercapacitors, RSC Adv., 2017, 7, 51888–51895 RSC.
- A. E. Elkholy, F. E. Heakal and N. K. Allam, A facile electrosynthesis approach of amorphous Mn-Co-Fe ternary hydroxides as binder-free active electrode materials for high performance supercapacitors, Electrochim. Acta, 2019, 296, 59–68 CrossRef CAS.
- F. M. Ismail, M. Ramadan, A. M. Abdellah, I. Ismail and N. K. Allam, Mesoporous spinel manganese zinc ferrite for high-performance supercapacitors, J. Electroanal. Chem., 2018, 817, 111–117 CrossRef CAS.
- M. A. Mohamed, D. M. El-Gendy, N. Ahmed, C. E. Banks and N. K. Allam, 3D spongy graphene-modified screen-printed sensors for the voltammetric determination of the narcotic drug codeine, Biosens. Bioelectron., 2018, 101, 90–95 CrossRef CAS PubMed.
- D. Wei, Y. Liu, H. Zhang, L. Huang, B. Wu, J. Chen and G. Yu, Scalable synthesis of few layer graphene ribbons with controlled morphologies by a template method and their applications in nanoelectromechanical switches, J. Am. Chem. Soc., 2009, 131, 11147–11154 CrossRef CAS PubMed.
- T. Kim, G. Jung, S. Yoo, K. S. Suh and R. S. Ruoff, Activated graphene-based carbons as supercapacitor electrodes with macro- and mesopores, ACS Nano, 2013, 7, 6899–6905 CrossRef CAS PubMed.
- N. Ahmed, M. Ramadan, W. M. A. El Rouby, A. A. Farghali and N. K. Allam, Non-precious co-catalysts boost the performance of TiO2 hierarchical hollow mesoporous spheres in solar fuel cells, Int. J. Hydrogen Energy, 2018, 43, 21219–21230 CrossRef CAS.
- B. A. Ali, O. I. Metwalli, A. S. G. Khalil and N. K. Allam, Unveiling the effect of the structure of carbon material on the charge storage mechanism in MoS2-based supercapacitors, ACS Omega, 2018, 3, 16301–16308 CrossRef CAS.
- S. G. Mohamed, S. Y. Attia and N. K. Allam, One-step, Calcination-free Synthesis of Zinc Cobaltite Nanospheres for High-performance Supercapacitors, Mater. Today Energy, 2017, 4, 97–104 CrossRef.
- X. Deng, J. Li, S. Zhu, F. He, C. He, E. Liu, C. Shi, Q. Li and N. Zhao, Metal–organic frameworks-derived honeycomb-like Co3O4/three-dimensional graphene networks/Ni foam hybrid as a binder-free electrode for supercapacitors, J. Alloys Compd., 2017, 693, 16–24 CrossRef CAS.
- D. R. Dreyer, R. S. Ruoff and C. W. Bielawski, From conception to realization: an historical account of graphene and some perspectives for its future, Angew. Chem., Int. Ed., 2010, 49(49), 9336–9344 CrossRef CAS PubMed.
- F. Liu, C. W. Lee and J. S. Im, Graphene-based carbon materials for electrochemical energy storage, J. Nanomater., 2013, 642915 Search PubMed.
- H. Ren, M. Tang, B. Guan, K. Wang and J. Yang, Hierarchical graphene foam for efficient omnidirectional solar-thermal energy conversion, Adv. Mater., 2017, 29(38), 1702590 CrossRef PubMed.
- T. Kuila, S. Bose, A. K. Mishra, P. Khanra, N. H. Kim and J. H. Lee, Chemical functionalization of graphene and its applications, Prog. Mater. Sci., 2012, 57(7), 1061–1105 CrossRef CAS.
- O. C. Compton and S. T. Nguyen, Graphene oxide, highly reduced graphene oxide, and graphene: versatile building blocks for carbon-based materials, Small, 2010, 6(6), 711–723 CrossRef CAS PubMed.
- W. S. Hummers and R. E. Offeman, Preparation of graphitic oxide, J. Am. Chem. Soc., 1958, 80, 1339 CrossRef CAS.
- X. Yang, K. Xu, R. Zou and J. Hu, A hybrid electrode of Co3O4@PPy core/shell nanosheet arrays for high-performance supercapacitors, Nano-Micro Lett., 2016, 8(2), 143–150 CrossRef PubMed.
- B. Zhang, F. Wang, C. Zhu, Q. Li, J. Song, M. Zheng, L. Ma and W. Shen, A facile self-assembly synthesis of hexagonal ZnO nanosheet films and their photoelectrochemical properties, Nano-Micro Lett., 2016, 8(2), 137–142 CrossRef PubMed.
- N. L. Torad, R. R. Salunkhe, Y. Li, H. Hamoudi, M. Imura, Y. Sakka, C. C. Hu and Y. Yamauchi, Electric double-layer capacitors based on highly graphitized nanoporous carbons derived from ZIF-67, Chem.–Eur. J., 2014, 20(26), 7895–7900 CrossRef CAS PubMed.
- D. M. El-Gendy, N. A. A. Ghany, E. F. El Sherbini and N. K. Allam, Adenine-functionalized Spongy Graphene for Green and High-Performance Supercapacitors, Sci. Rep., 2017, 70, 43104 CrossRef PubMed.
- F. Narges and F. T. Sekino, A Novel Method for Synthesis of Titania Nanotube Powders using Rapid Breakdown Anodization, Chem. Mater., 2009, 21, 1967–1979 CrossRef.
- K. M. Mackay, Hydrogen Compounds of the Metallic Elements, E and FN Spon, London, UK, 1966, p. 71 Search PubMed.
- M. M. Soliman, M. H. Al Haron, M. Samir, S. A. Tolba, B. S. Shaheen, A. W. Amer, O. F. Mohammed and N. K. Allam, On the relationship between rutile/anatase ratio and the nature of defect states in sub-100 nm TiO2 nanostructures: experimental insights, Phys. Chem. Chem. Phys., 2018, 20, 5975–5982 RSC.
- X. Chen, L. Liu, Z. Liu, M. A. Marcus, W. C. Wang, N. A. Oyler, M. E. Grass, B. Mao, P.-A. Glans, P. Y. Yu, J. Guo and S. S. Mao, Properties of disorder-engineered black titanium dioxide nanoparticles through hydrogenation, Sci. Rep., 2013, 3, 1510 CrossRef PubMed.
- H. Zhang, X. J. Lv, Y. M. Li, Y. Wang and J. H. Li, P25–graphene composite as a high performance photocatalyst, ACS Nano, 2010, 4, 380–386 CrossRef CAS PubMed.
- X. Liu, H. Xu, L. R. Grabstanowicz, S. Gao, Z. Lou, W. Wang, B. Huang, Y. Dai and T. Xu, Ti3+ self-doped TiO2−x anatase nanoparticles via oxidation of TiH2 in H2O2, Catal. Today, 2014, 225, 80–89 CrossRef CAS.
- S. Liu, C. Liu, W. Wang, B. Cheng and J. Yu, Unique photocatalytic oxidation reactivity and selectivity of TiO2–graphene composites, Nanoscale, 2012, 4, 3193–3200 RSC.
- G. Wang, H. Wang, Y. Ling, Y. Tang, X. Yang, R. C. Fitzmorris, C. Wang, J. Z. Zhang and L. Yat, Hydrogen- treated TiO2 nanowire arrays for photoelectrochemical water splitting, Nano Lett., 2011, 11(7), 3026–3033 CrossRef CAS PubMed.
- C. D. Zangmeister, Preparation and evaluation of graphite oxide reduced at 220 °C, Chem. Mater., 2010, 22, 5625 CrossRef CAS.
- Z. Lei, L. Lu and X. S. Zhao, The electrocapacitive properties of graphene oxide reduced by urea, Energy Environ. Sci., 2012, 5, 6391 RSC.
- H. Yang, F. Li, C. Shan, D. Han, Q. Zhang, L. Niu and A. Ivaska, Covalent functionalization of chemically converted graphene sheets via silane and its reinforcement, J. Mater. Chem., 2009, 19, 4632–4638 RSC.
- L.-B. Xing, S.-F. Hou, J. Zhou, J.-L. Zhang, W. Si, Y. Dong and S. Zhuo, Three dimensional nitrogen-doped graphene aerogels functionalized with melamine for multifunctional applications in supercapacitors and adsorption, J. Solid State Chem., 2015, 230, 224–232 CrossRef CAS.
- D. Hulicova-Jurcakova, M. Seredych, G. Q. Lu, N. K. A. C. Kodiweera, P. E. Stallworth, S. Greenbaum and T. J. Bandosz, Effect of surface phosphorus functionalities of activated carbons containing oxygen and nitrogen on electrochemical capacitance, Carbon, 2009, 47, 1576–1584 CrossRef CAS PubMed.
- C. H. Choi, S. H. Park and S. I. Woo, Heteroatom doped carbons prepared by the pyrolysis of bio-derived amino acids as highly active catalysts for oxygen electro-reduction reactions, Green Chem., 2011, 13, 406–412 RSC.
- D. Choi, G. E. Blomgren and P. N. Kumta, Fast and Reversible Surface Redox Reaction in Nanocrystalline Vanadium Nitride Supercapacitors, Adv. Mater., 2006, 18(9), 1178–1182 CrossRef CAS.
- A. K. Geim and K. S. Novoselov, The rise of graphene, Nat. Mater., 2007, 6(3), 183–191, DOI:10.1038/nmat1849.
- C. Xiang, M. Li, M. Zhi, A. Manivannan and N. Wu, Reduced graphene oxide/titanium dioxide composites for supercapacitor electrodes: shape and coupling effects, J. Mater. Chem., 2012, 22, 19161–19167 RSC.
- Z. S. Wu, K. Parvez, A. Winter, H. Vieker, X. Liu, S. Han, A. Turchanin, X. Feng and K. üllen, Layer-by-layer assembled hetero atom-doped graphene films with ultrahigh volumetric capacitance and rate capability for micro-supercapacitors, Adv. Mater., 2014, 26, 4552–4558 CrossRef CAS PubMed.
- L. Sun, C. Tian, M. Li, X. Meng, L. Wang, R. Wang, J. Yin and H. Fu, From coconut shell to porous graphene-like nano sheets for high-power super- capacitors, J. Mater. Chem. A, 2013, 1, 6462–6470 RSC.
- J. H. U. Z. Kang, F. Li and X. Huang, Graphene with three-dimensional architecture for high performance supercapacitor, Carbon, 2014, 67, 221–229 CrossRef.
- H. Wang, T. Maiyalagan and X. Wang, Review on recent progress in nitrogen- doped graphene, synthesis, characterization, and its potential applications, ACS Catal., 2012, 2, 781–794 CrossRef CAS.
- X. Sun, M. Xie, G. Wang, H. Sun, A. S. Cavanagh, J. J. Travis, S. M. George and J. Lian, Atomic layer deposition of TiO2 on graphene for supercapacitors, J. Electrochem. Soc., 2012, 159(4), A364–A369 CrossRef CAS.
- C. M. Chen, Q. Zhang, X. C. Zhao, B. Zhang, Q. Q. Kong, M. G. Yang, Q. H. Yang, M. Z. Wang, Y. G. Yang, R. Schlögl and D. S. Su, Hierarchically aminated graphene honey combs for electro- chemical capacitive, energy storage, J. Mater. Chem., 2012, 22, 14076–14084 RSC.
- A. Ramadoss and S. J. Kim, Improved activity of a graphene–TiO2 hybrid electrode in an electrochemical supercapacitor, Carbon, 2013, 63, 434–445 CrossRef CAS.
- C. M. Chen, Q. Zhang, M. G. Yang, C. H. Huang, Y. G. Yang and M. Z. Wang, Structural evolution during annealing of thermally reduced graphene nanosheets for application in supercapacitors, Carbon, 2012, 50, 3572 CrossRef CAS.
- S. Y. Yang, K. H. Chang, H. W. Tien, Y. F. Lee, S. M. Li, Y. S. Wang, J. Y. Wang, C. C. M. Ma and C. C. Hu, Design and tailoring of a hierarchical graphene-carbon nanotube architecture for supercapacitors, J. Mater. Chem., 2011, 21, 2374 RSC.
- Z. Lei, N. Christov and X. S. Zhao, Intercalation of mesoporous carbon spheres between reduced graphene oxide sheets for preparing high-rate supercapacitor electrodes, Energy Environ. Sci., 2011, 4, 1866 RSC.
- X. Sun, M. Xie, G. Wang, H. Sun, A. S. Cavanagh, J. J. Travis, S. M. George and J. Lian, Atomic Layer Deposition of TiO2 on Graphene for Supercapacitors, J. Electrochem. Soc., 2012, 159, A364–A369 CrossRef CAS.
- G. Wang, Q. Tang, H. Bao, X. Li and G. Wang, Synthesis of hierarchical sulfonated graphene/MnO2/polyaniline ternary composite and its improved electrochemical performance, J. Power Sources, 2013, 241, 231–238 CrossRef CAS.
- K. Vijaya Sankar and R. Kalai Selvan, Fabrication of flexible fiber supercapacitor using covalently grafted CoFe2O4/reduced graphene oxide/polyaniline and its electrochemical performances, Electrochim. Acta, 2016, 213, 469–481 CrossRef CAS.
- G. Yu, L. Hu, N. Liu, H. Wang, M. Vosgueritchian and Y. Yang, et al., Enhancing the supercapacitor performance of graphene/MnO2 nanostructured electrodes by conductive wrapping, Nano Lett., 2011, 11, 4438–4442 CrossRef CAS PubMed.
- B. Mu, W. Zhang, S. Shao and A. Wang, Glycol assisted synthesis of graphene-MnO2-polyaniline ternary composites for high performance supercapacitor electrodes, Phys. Chem. Chem. Phys., 2014, 16, 7872–7880 RSC.
| This journal is © The Royal Society of Chemistry 2019 |

