 Open Access Article
Detecting early stage structural changes in wild type, pathogenic and non-pathogenic prion variants using Markov state model†
Vinod Jani,
Uddhavesh Sonavane and
Rajendra Joshi *
*
High Performance Computing-Medical & Bioinformatics Applications Group, Centre for Development of Advanced Computing (C-DAC), Savitribai Phule Pune University Campus, Pune 411007, India. E-mail: rajendra@cdac.in
First published on 9th May 2019
Abstract
The conversion of prion protein from normal to scrapie followed by the aggregation and deposition of this scrapie form leads to various neurodegenerative diseases. A few studies carried out by researchers suggest that E219K prion mutant (glutamate to lysine mutation at residue position 219) is more stable than wild type protein. However a similar point mutation E200K (glutamate to lysine mutation at residue position 200) is pathogenic. In this study we have carried out detailed atomistic simulation of the wild type, pathogenic mutant E200K and E219K mutant which provides more stability. The aim of the study was to detect the early structural changes present in all the three variants which might be responsible for the stability or for their conversion from PrPC to PrPSc. MSM based analyses have been carried out to find out the differences between WT, E200K and E219K systems. Markov state model (MSM) analysis was able to predict the intermediate states which helped to understand the effect of same mutation at two different locations. The MSM analysis was able to show that the extra stability of E219K mutant may be a result of the increase in number of native contacts, strong salt bridges and less random motions. While pathogenicity of E200K mutant can be attributed to loss of some crucial salt-bridge interactions, increased random motions between helix 2 and helix 3.
1. Introduction
The prion protein (PrP) is a membrane bound glycoprotein present in the neuronal cells of mammals. It is linked to the cell membrane via a glycophosphatidylinositol anchor present at its C-terminus.1,2 Structural changes in the prion protein are responsible for a group of neurodegenerative diseases known as prion diseases or transmissible spongiform encephalopathies (TSE). These diseases include scrapie in sheep, bovine spongiform encephalopathy (BSE) in cattle, and Creutzfeldt–Jakob disease (CJD), Gerstmann–Straussler–Scheinker disease, fatal familial insomnia, and kuru in humans.3–8 These structural changes in the prion protein may be attributed to the mutations occurring in the prion protein gene. These mutations may occur owing to an infection or inheritance.9,10PrP is a glycoprotein of around 209 residues. Residues 23–124 form the N-terminal region which is a highly disordered and unstructured region. Residues 126–231 form the C-terminal region, which is an ordered and folded domain. It comprises of three α-helices namely helix H1, 144–154; helix H2, 173–195; helix H3, 200–226 and two short anti-parallel β-strands strand1(St1), 127–130; and strand2(St2), 162–165. The H2 and H3 are known to form a covalent bridge through by a disulfide bond between Cys179 and Cys214 (ref. 11–14). The normal prion protein or PrPC is monomeric, soluble, and protease-sensitive. Scrapie prion protein or PrPSc is highly insoluble and protease-resistant.10,15 Both these forms differ in their structural content. The structure for the PrPSc is ill defined due to its insolubility and conformational heterogeneity.16 However it is known that the PrPSc is rich in β-content as compared to that of PrPC, which is rich in helical content. These structural differences are responsible for the difference in their physiochemical properties. The newly formed scrapie prion protein can induce nearby normal prion proteins to acquire a misfolded form.17 The scrapie prion proteins also have a tendency to aggregate and form dense amyloid fibrillary structure. It gets deposited within the neuronal cells and results in neurodegenerative disorders. It is also known that these structural changes comprise of α to β refolding events and studying such events poses challenges in understanding their function. The structural changes in the prion protein are attributed to mutations hence studying dynamics of mutated protein can provide better understanding of these transition events.
The structural changes that cause the conversion of PrPC to PrPSc and the mechanistic details of PrPSc self-propagation have not yet been understood completely. There are several studies which provide some understanding on fibrillation and oligomerization processes.18–21 However, an important concern is to identify a region or a group of residue sequences vulnerable to undergo conformational changes and act as a site for initial seeding and lead towards fibrillary growth. Earlier studies have suggested that the residues 125–165 comprising of St1–H1–St2 region are involved in the conformational transition of PrPC to PrPSc.22–27 The studies by Chen W. et al.9 and Chen J. et al.28 have stated that the residues 173–226 comprising of mainly the helices H2–H3, play a crucial role in the conformational transitions. The studies by Adrover et al.,29 Chakroun et al.,30 Tycko et al.31 and Dima et al.32 have suggested the role of H1 and H3 in the conversion of PrPC to PrPSc. Role of tertiary/long range interactions between St2–H2 loop and H3 have been found to be crucial to understand the early events in the misfolding process.33,34 The stability of PrPC is mostly attributed to its hydrophobic core and hydrogen bonds.35–38 Hence pathogenic mutations residing in the hydrophobic core of PrPC display different effects on the mature protein.35 Besides amino acid point mutations, the pH, and temperature also affects the thermodynamic stability of the protein and lead to pathological conformational transformations.39–42 The understanding of how various mutations affect the conformational changes in prion protein would unveil the mechanism by which familial mutations facilitate the pathogenic process.
Hence, in this work molecular dynamics of wild type, a pathogenic mutant E200K responsible for the most common familial form of Creutzfeldt–Jakob disease16,43,44 and a non-pathogenic mutant E219K known to provide extra stability to PrP have been studied.45,46 Although the point mutations (glutamate to lysine) are identical but occur at different positions (one at position 200 and another at position 219) and show contrasting effects i.e. one being pathogenic (E200K) and another providing extra stability (E219K). In order to understand the structural changes responsible for difference in their functional behaviour due to these mutations at different location, molecular dynamics simulations have been performed. For each of these variants four sets of simulations of 200 ns have been carried out. We have tried to address the structural changes which may be responsible for pathogenicity. Also we have tried to determine which of structural changes may be responsible to provide extra stability to protein. The main aim of the study is to understand early events in the wild type, E200K and E219K prion variants which may triggers PrPC to PrPSc conversion. Various structural parameters have been calculated for these simulations data and using these parameters, feature based correlation analysis has been done. One of the feature from the correlation analysis has been used for Markov State Model (MSM) calculation, which has helped to study the intermediate states and the kinetics of transitions involved between them. MSM have been previously used to understand folding/unfolding and f behaviour of protein.47–50
2. Method molecular simulations
2.1. Simulation protocol
The NMR structure PDB id 1QM0 with the residue range 125–228 was selected as the starting structure for the simulations as the residues 23–124 are known to be highly disordered and unstructured. The two variants of the prion protein were obtained by replacing glutamate with lysine at position 200 and another at position 219 respectively using Chimera.51 Molecular dynamics simulations were carried out using GROMACS v5 (ref. 52) with AMBER ff99sb force field53 for 200 ns (four sets) for all the three systems. All the systems were solvated in a cubic box with TIP3P54 water. The distance between closest protein fragment and edges of the box was kept to be 9 Å. All the systems were neutralized by adding Na+ ions. For wild type three Na+ ions were added for E200K and E219K one Na+ were added. The energy minimization was carried out for 2500 steps. This was followed by two step equilibration, the first one was position restrained NVT equilibration for 500 ps using V-rescale thermostat.55 This was followed by NPT equilibration for 1 ns using the Berendsen barostat.56 Long-range electrostatic interactions were calculated using the particle-mesh Ewald (PME) method.57 A 12 Å cut-off was set for coulombic and van der Waals's interactions. Newton's equation of motions was solved using the Leap frog integrator with the integration time step of 2 fs. The LINCS algorithm58 was used to constrain the bond lengths involving in hydrogen atoms. The production runs for 200 ns were carried out using Parrinello–Rahman barostat.592.2. Analysis
GROMACS analysis utilities, were used for the analysis. The hydrogen bonds were calculated using g_hbond utility of GROMACS where interactions with distance <0.35 nm between cooperated donor and acceptor heavy atoms were considered. GROMACS trajectory was converted to PDB trajectory and native contacts analysis was done using cpptraj utility of AMBER Tools using contact criteria of 0.35 nm.60 VMD was used for visualization and image rendering.612.3. Markov state models analysis (MSM)
Markov state models (MSM) is an important tool for predicting interesting intermediate states and kinetics between them from molecular dynamics data of a biological system. Creation of states and the transition matrix depends on the choice of collective variable (CVs) and the lag time.62–65 MSM calculations were done using Pyemma software package.66 Following steps were carried out to build the MSM; (a) VAMP score calculation was done for different features, which is based on variational principle.67 The variational principle helps to check the robustness of MSM. VAMP score were calculated for following features viz. dihedral angle, positions (coordinates) and residue min_dist (mindist). (b) Feature selection (CV), wherein the residue minimum distance (mindist) was used as the featurizer. (c) Computing of time independent component analysis (TICA) using this featurizer as the second step. TICA helps to reduce dimensionality of the trajectory data. (d) Clustering of MD data using K means clustering and (e) creation of macrostate (states) using PCCA. (f) Transition matrix was built using chosen lag time in such a way that the transition matrix follows Markovian behaviour. Eigen decomposition of transition matrix results in eigenvectors which represents slow motions in the systems. The fluxes and mean passage time calculations are done from computing transition pathways between states by discrete transition path theory.68 The choice of lag time is related to eigenvalue which, gives us physically measurable timescale know as implied timescale (ti) using eqn (1).
 | (1) |
| T(nτ) = T(τ)n | (2) |
The validated MSM model is very useful to understand intermediate states and kinetics between them. All these steps of MSM were carried out for all the three variants.
2.4. Electrostatic potential calculation
The electrostatic interactions within the protein plays important role in maintaining the stable structure of protein. Any change in the surface charge may alter the protein interaction with solvent and other biomolecules in the near environment. This can affect stability of protein. In the current study, ESP for all the three variants were calculated using Poisson–Boltzmann equation. The electrostatic potential ψ(r) for a simple system of charged particles in solvent was calculated with space-dependent dielectric constant ε(r) and the charge density ρ(r) of the solute. Here for ESP calculation, solvent was considered as continuous medium with an exterior dielectric constant (εext = 80) and the prion protein was treated as charged particles in the solvent with an interior dielectric constant (εint = 4). The electrostatic potentials were calculated using programs PDB2PQR,69 APBS70 and PROPKA.71 APBS calculations were done form the MSM states. Visualization of APBS calculations were done using VMD.3. Results and discussions
Four sets of simulations have been carried out for 200 ns each for wild type prion, pathogenic mutant (glutamate to lysine) at position 200 and non-pathogenic mutant (glutamate to lysine) at position 219. Henceforth, wild type system has been represented as WT and mutant at position 200 and 219 have been represented as E200K and E219K respectively. Feature based correlation analysis is done for first trajectory to identify reaction coordinate for the MSM. MSM analysis is carried out using all the four sets of simulation for WT, E200K and E219K the prion variants. Starting structure for all the three variants has been shown in the Fig. 1 with the mutated residue represented as ball and stick. Most of the knowledge about prion protein is available in the form of NMR structures. Hence, the backbone chemical shifts were calculated for simulated systems using ‘Shift2x’ software.72 The chemical shifts were calculated for all the WT and mutants. The results of the simulations were compared with that of experimental values of chemical shifts and are presented in the Fig. 2. It is clear that the experimental shift values are in well agreement with that of all the three simulated prion variants. These suggests that the systems have been well equilibrated.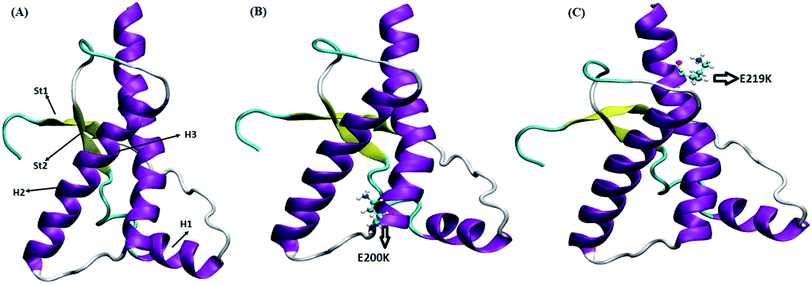 | ||
| Fig. 1 Starting structure used for simulation with mutant residue represented as ball and stick. (A) Wild type. (B) E200K. (C) E219K. | ||
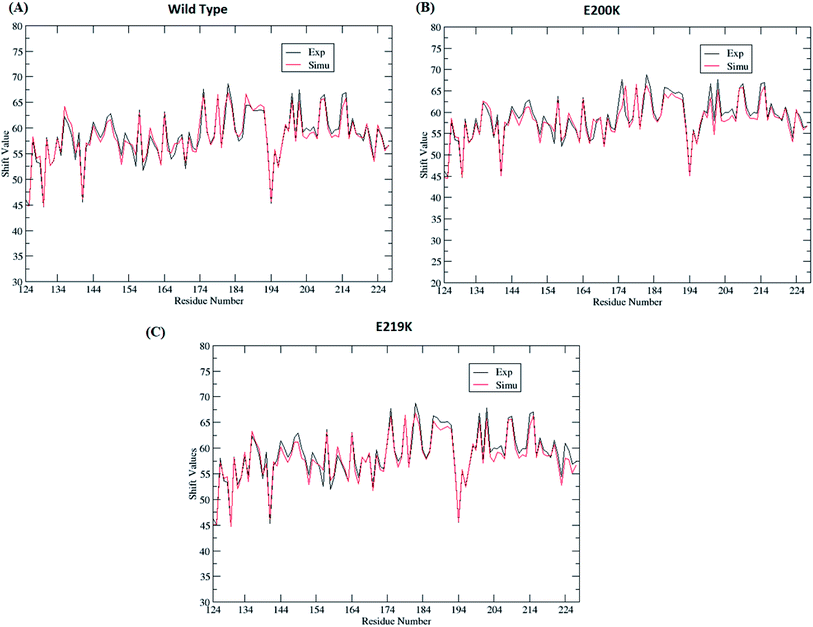 | ||
| Fig. 2 Comparison of chemical shift values between experimental and simulated ensemble structure for all the three variants. | ||
3.1. Correlated factors in prion dynamics
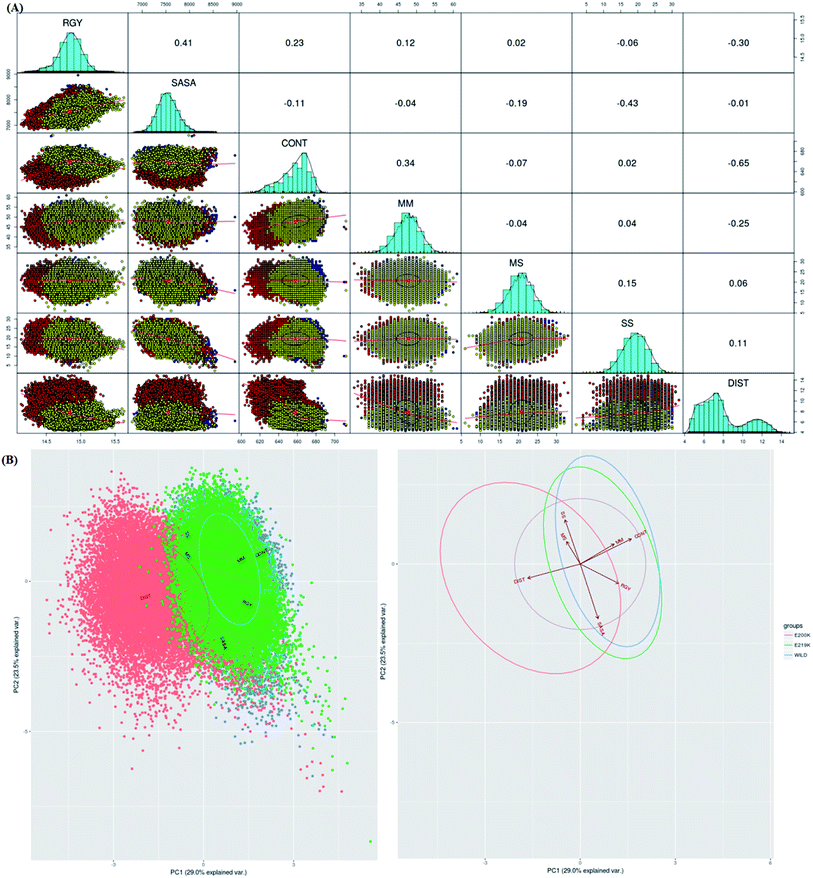
To identify which of the structural parameters are correlated and important in discrimination of prion variants, an R based utility has been used.73 It uses spectral based decompositions to examine the covariances/correlations between parameters/features. The features used to carry out this analysis were RMSD, RGY, SASA, native contacts, residue distances, mainchain–mainchain (MM) hydrogen bonds, mainchain–sidechain (MS) hydrogen bonds and sidechain–sidechain (SS) hydrogen bonds. The details of structural parameters have been given in the ESI (Fig. S1–S7†). Before doing spectral decomposition, clustering correlation was done using the above mentioned parameters (Fig. 3A). The clustering correlation gives an idea about how the different parameter are correlated with each other. A positive value indicates positive correlation and a negative value indicates negative correlation. The maximum value for positive and negative correlation can be 1 and −1 respectively. From the Fig. 3A, maximum positive correlation is seen between RGY and SASA.The next step after clustering correlation is the feature based PCA to identify the dominant features contributing in the protein dynamics. The Fig. 3B shows the results for feature based PCA for all the three variants. In feature based PCA, clear separation within the population of conformers was seen between different prion variants (Fig. 3B). Wild type (blue colour) and E219K (green colour) were clustered together whereas E200K (orange colour) formed a separate cluster. The arrows shown in the Fig. 3B suggests that native contacts and hydrogen bonds (MM) were positively correlated while native contacts and distance features were negatively correlated. From the above clustering, it was clear that E219K had correlated structural properties as observed for WT. However, E200K behaved differently as compared to WT. The features like distance, native contacts and mainchain–mainchain hydrogen bonds played dominant role to discriminate E200K and WT, E219K systems. This analysis has helped to find the collective variable for building the MSM. The distance (minimum distance) feature has been used as a collective variable to find states in the MSM analysis.
3.2. Prion dynamics: interesting intermediate states and kinetics
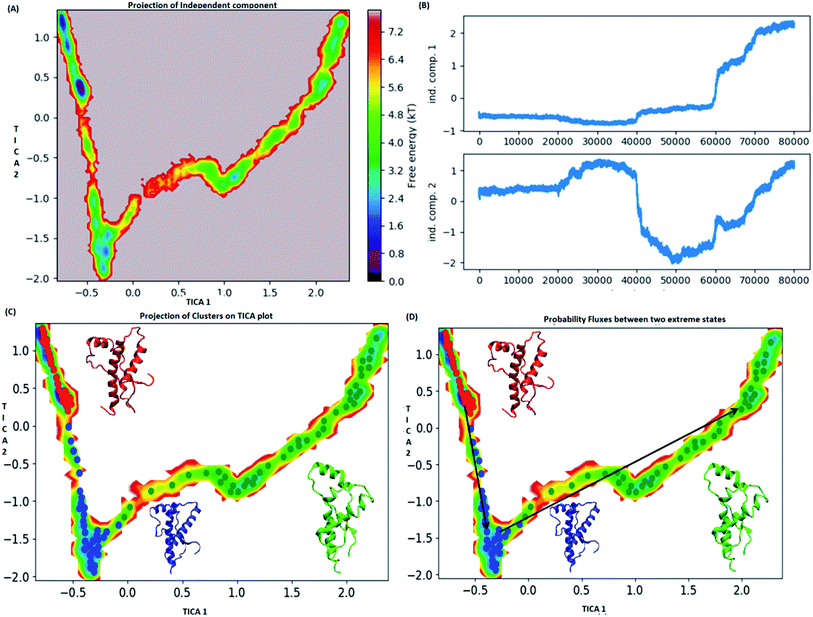
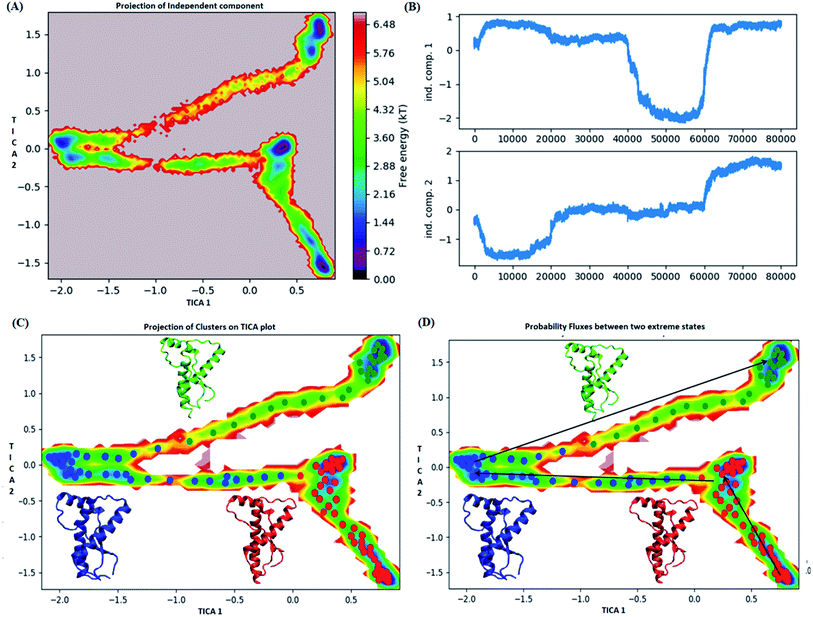
MSM analysis helps to understand kinetics followed by a system from several discrete simulations data.74 The selection of lag time plays an important role in construction of a Markov model. The lag time for building the macro state was calculated by plotting implied timescale (ESI Fig. S8a†). The lag time of 20 ns was chosen for all the three variants since, it attains saturation after 20 ns. VAMP score was calculated for different features. It helps to check the robustness of the MSM. VAMP score were calculated for following features viz. dihedral angle, positions (coordinates) and residue min_dist ESI Fig. S8b.† VAMP score was maximum for residue min_dist CV. Validation of Markovian behaviour of MSM model is tested through the Chapman–Kolmogorov62 equation. This gives an idea about the probability of decay observed for the major metastable states predicted by MSM. The ESI Fig. S9† has been given to show the validation of MSM model using the Chapman–Kolmogorov equation. In order to get the kinetics of the system, the trajectories from all the four runs were used to build MSM. In case of the WT, the spread of conformation along first time independent component (tIC) was from −0.5 to 2 and −2 to 1 along second tIC component has been seen in the Fig. 4. TICA clustering followed by Perron-cluster cluster analysis (PCCA) macrostate clustering resulted into three metastable states which have been shown in the Fig. 4C. The state 1 (red colour) encompasses of the structure that belongs to the low energy basins. The state 2 represented in blue colour encompasses the structure within an energy range of 2.4 to 4.8 kT. The state 2 was separated from state 1 by an energy barrier of 5.6 to 6.4 kT. The third state (green colour) consists of conformation with slightly higher energy (4.8 to 6.4 kT). The structures in state 1 had well-formed secondary structure components (ESI Fig. S10†). Similar to state 1, state 2 also had conformers with well-formed secondary structures. However in the state 3 the conformers showed deformed secondary structures. There was loss in helicity of H1 along C-terminal region; H3 also showed deformation along C-terminal region. Markov state model analysis also provides an insight on transitions between states. It gives the probability of the protein conformations traversing from one state to another. It was observed that the structure tends to go from state 1 to state 2 and finally reaching state 3. The mean passage time predicted for reaching state 3 from state 1 was predicted to be 340 ms whereas, the switch back time from state 3 to state 1 was predicted to be 1500 ns.In case of E200K system, the spread of conformational space along the first tIC and second tIC has been shown in the Fig. 5. Three major states were observed, state 1 (red) consists of two sub-states. The sub-state 1 laid at tIC1 tIC2 (1, −1.7) with an energy value of ∼0.72 kT while the sub-state 2 laid at tIC1 tIC2 (0.5, 1) with an energy value in the range of 0.72 kT. The two sub states were separated by ∼3.6 kT energy barrier.
The state 2 (blue) consists of population with energy varying in the range of 0.72 to 2.8 kT. Majority of population in state 2 laid at tIC1 tIC2 (−2, 0). The state 1 and state 2 were separated by an energy barrier of ∼5.76 kT. The structures in the state 3 (green colour) had energy within the range of 0.72 to 6 kT.
The structures in state 1 had well-formed secondary structures while the state 2 had slightly opened and deformed H2 (ESI Fig. S11†). The state 3 had structures with deformed helices H2 and H3. Thus state 1 had native like conformation, state 2 had intermediate structures and state 3 had more deformed conformations.
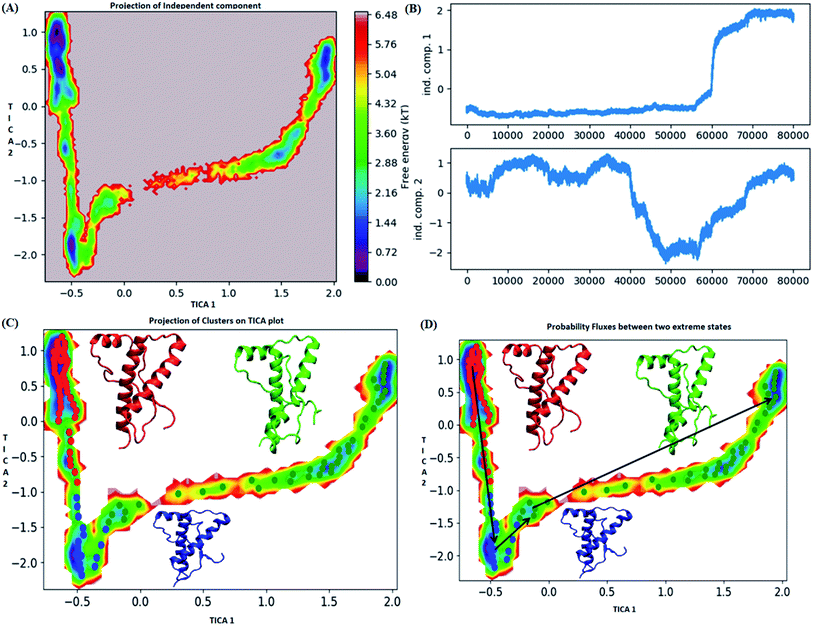
The pathway suggest that native like structures in state 1 tends to undergo slight deformation and reach the state 2. This deformation starts with loss of H2 followed by deformation of H3 at both C and N terminal end as observed in state 3. The mean passage time for the system from stable structure to deformed structure was 1.5 ms whereas for the reversible process it was 380 ms. For the E219K, the spread of conformation along first and second tIC has been shown in the Fig. 6. Three major states were seen, state 1 (red colour) which laid at tIC1 tIC2 (−0.5, 0.7) and had energy value of ∼0.72 kT. The state 2 (blue colour) consisted of population with energy varying in range of 0.72 to 2.8 kT. The state 1 and state 2 were separated by energy barrier of ∼3 kT. The structures in the state 3 (green colour) had energy in the range of 1.6 to 6 kT. The structures in state 1 had well-formed secondary structures (ESI Fig. S12†). The structures in state 2 were opened up. The state 3 had deformed H1 and H3 and the structures were more compact. Thus, the state 1 had native like conformation, state 2 had intermediate conformations and state 3 had deformed conformations.
The mean passage time for going from stable structure to deformed structure was predicted to be 750 ms, whereas the same for reversible time is 650 ns. From MSM study it was clear that the E200K mutant was easily destabilized and had a very low mean passage time. The mean passage time was observed to be the longest for E219K mutant among the three variants. Hence, it is clear from MSM mean passage time that the E200K variant can be deformed at a faster rate as compared to be wild type and E219K variant. Few geometrical parameters like native contacts and secondary structure elements were analysed for MSM states of all three systems and shown in the ESI Fig. S10–S13.† The native contacts for WT and E219K systems were found to be in the range of 640 to 660 (ESI Fig. S13A and S13C†) respectively. But the number of native contacts for E200K system were found to be in the range of 620 to 660 (ESI Fig. S13B†). The number of native contacts were the highest for state 1 and lowest for state 3 in all the three systems. MSM was able to predict that the intermediate states and the conformations obtained in state 3 may be prone towards protein aggregation. The secondary structure analysis for the structures of MSM states of all the systems have been shown in the ESI Fig. S10–S12.† The state wise secondary structure analysis has suggested that state 3 structure showed highest loss in secondary structures as compared to the states 1 & 3 in all the three systems. Thus in cluster 3 WT and E219K variant showed loss in secondary structure of H1 and H3 while for E200K loss in secondary structure was observed in H2 and H3. Thus it may be inferred that the early deformation of H2 may be crucial for faster conversion of PrPc to PrPSc.
3.3. Important contacts and fluctuations
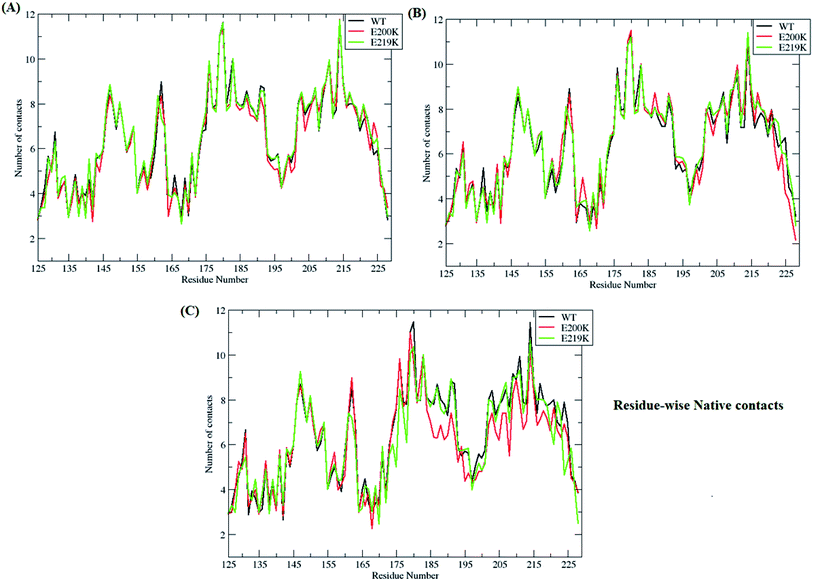
In-order to find out which of residues were affected during unfolding process of prion protein, residue-wise native contacts were plotted for each of the clusters/states of MSM. Fig. 7 shows the residue-wise native contacts for all the three clusters/states in the all three variants. For cluster 1, the residue-wise native contacts did not vary much for all the three variants (Fig. 7A). The native contacts for the residue numbers 146, 163, 193, 194, 200 and 204 of E200K prion variant have been affected as compared to that of WT and E219K. For the cluster 2, major changes have been seen in the loop region connecting H2 and H3. H3 region also showed decrease in number of residue-wise native contacts in E200K as compared to WT and E219K as seen in the Fig. 7B. In the cluster 3, the difference in number of residue-wise native contacts was more prominent between all three systems. The E200K variant showed further decrease in the number of native contacts for H2, the loop connecting H2 and H3, and H3 (Fig. 7C).Further, important salt bridges/contacts in the H2 & H3 regions were measured in all the three clusters/states of WT, E200K and E219K systems. The distances of important salt bridges have been plotted in the ESI Fig. S14 to S17.† The ESI Fig. S14–S17† shows distance plot between residues 146–208, 149–202, 156–196 and 200–204 residues respectively. For contact between residues 146 and 208, the distance was maintained around 9–10 Å in all the three MSM states of E200K, while in case of WT and E219K the distance between these residues gradually increased while traversing from MSM state 1 to 3. In WT and E219K systems, the distance was observed around 4–6 Å for cluster 1, around 7–8 Å for cluster 2, while it was around 10 Å in the cluster 3. Similar trend was observed for distance between residue 149 and 202. For E200K, the distance was maintained around 9–10 Å in all three MSM clusters. For WT, it showed gradual increase from ∼4 Å (cluster 1) to ∼10 Å (cluster 3). Similar trend was observed for E219K system. The contact between residues 156 and 196 and 200 and 204 have similar behaviour like the earlier contacts for all the E200K, WT and E219K systems. In E200K the disruption of contacts was observed in all the three states/clusters while in WT and E219K it showed gradual disruption while traversing from state 1 to state 3. Thus, the E200K mutation may lead to early disruption of some of the salt bridges which may be one of the reasons for the pathogenicity of E200K. Also these salt bridges were stronger in E219K (smaller distance between the residues) which may be the reason for extra stability.
3.4. Structural response to mutations
Borgohain et al.75 discussed the conformational changes occurring due to the two pathogenic mutants T193I and R148H using classical molecular simulations. They did not observe any major structural transition, except for few local variations. For T193I mutant they observed depletion of β-sheet content and conversion of a 310 region into a coil, whereas for R148H observed β-sheet depletion and appearance of new 310 region in H2. They also observed conversion of two α helical regions into two new turn regions in H2 and H3 helices. Chebaro et al.76 studied effect of T183A mutation both on monomer and dimer through coarse grained molecular simulations. They observed that H1 was robust and the H2/H3 subdomain showed higher propensity for intra- and inter-β-sheets. Zhou et al.77 carried out molecular dynamics simulation studies to study effect of G127V substitution on dimer formation. They observed that the V127 variant reduces main-chain H-bond interaction in St1 region, making it unfeasible for making β strand structure and thereby prevent dimer formation. DeMarco et al.78 studied the effect of low pH on prion protein through molecular dynamics simulations. They observed that at normal pH the structure remains stable but at low pH critical long-range salt bridges were broken resulting in destabilized structures. They also concluded that the breakage of salt bridges led to disconnection of H1 from H2–H3 domain. The results presented here also suggest the weakening of salt bridges and local variation in the H2–H3 domain, may act as early events in the prion aggregation.Studies carried out by Biljan et al.45 on E219K and Zhang et al.16 on E200K mainly suggested the role of surface charge as important factor for extra stability of E219K and pathogenicity of E200K mutants. In the current study, electrostatic potential (ESP) for all the three variants are calculated using Poisson–Boltzmann equation. The Fig. 8 shows ESP snapshot of MSM state 3 structures of WT, E200K and E219K. The charge on the surface of protein has been represented by positively charged (blue colour) and negatively charged (red colour). For E200K, the surface tends to become positively charged at the site of mutation. For E219K, the surface showed subtle alteration in the charge at the site of mutation. These differences in the charges of the mutant systems may be playing a role in the disruption of the native contacts. The two mutations tend to perturb the surface charge distribution and this change may affect the aggregation propensity of protein as discussed in the literature.44,45 In the simulation reported here we observed perturbation in the surface charge as reported for E219K and E200K. As charge plays an important role in maintaining electrostatic interactions, the change in surface charge may also affects the salt-bridges interactions, which may lead to destabilization in E200K and stabilization in E219K. As reported by previous simulation of DeMarco et al.,78 Menon et al.79 the breakage of salt bridges leads to a cascade of events which further causes the destabilization of other intra helical contacts. Rossetti et al.80,81 carried out simulation study for WT, E200K, E219K and Q212P and reported difference in salt bridge interactions among various prion variants in there study. In our simulation we observed the difference among the following salt bridges viz. ARG156–GLU196, GLU146–ASP202, ARG156–ASP202, GLU/LYS200–LYS204. We also observed similar behaviour wherein breakage of important contacts may have decreased in the native contacts in E200K and thereby increased random motion between the helices. All these structural variations and destabilization effects have been dominant in E200K as compared to E219K and WT.
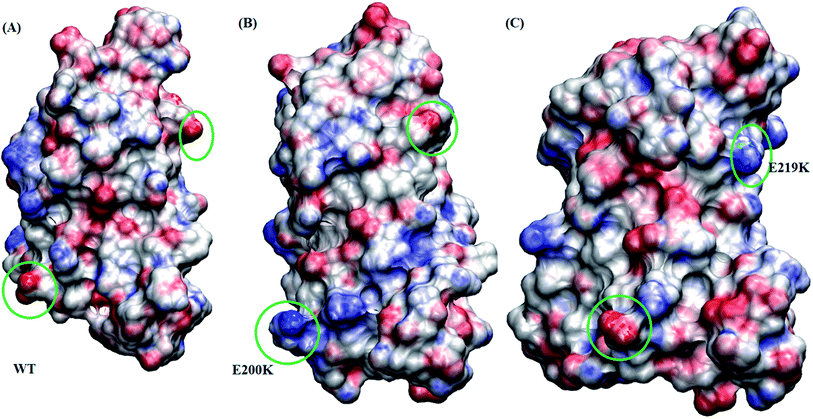 | ||
| Fig. 8 Figure showing electrostatic potential for all the three protein variant. Red is negatively charged surface and blue being positively charged surface. (A) Wild type. (B) E200K. (C) E219K. | ||
4. Conclusion
The aim of the study was to detect the early structural changes in all the three variants which were responsible for the stability and conversion from PrPC to PrPSc. The MSM based analyses were carried out to find out the differences between E200K, E219K and WT systems. The MSM analysis were able to predict the intermediate states which helped to understand the effect of same amino acid mutation at two different locations. The structural and kinetics information from MSM states were able to predicted faster destabilization of E200K variant as compared to WT and E219K. Native contacts and secondary structures were found to be affected in E200K as compared to E219K and WT systems. The perturbation in surface charge distribution may have influence the tertiary interactions between secondary structures in the prion. In E200K, the residues lying in H2 and H3 regions tend to show reduction in the number of native contacts. The breakage of these important contacts in E200K may be the reason for increased fluctuation of H2 and H3 helices. These proposed MSM intermediate states in all the three prion systems may prove to be useful in structural differentiation of as early events occurring in the conversion of PrPC to PrPSc form.Conflicts of interest
There are no conflicts to declare.Acknowledgements
The authors gratefully acknowledge the Ministry of Electronics and Information Technology (MeitY), Government of India, New Delhi, and National Supercomputing Mission (NSM) for providing financial support. This work was performed using the “Bioinformatics Resources and Applications Facility (BRAF)”. I would like to also thank Ms Shruti Koulgi for improving the manuscript.References
- S. Liemann and R. Glockshuber, Transmissible spongiform encephalopathies, Biochem. Biophys. Res. Commun., 1998, 250(2), 187–193 CrossRef CAS PubMed.
- S. B. Prusiner, Scrapie prions, Annu. Rev. Microbiol., 1989, 43(1), 345–374 CrossRef CAS PubMed.
- R. Linden, V. R. Martins, M. A. Prado, M. Cammarota, I. Izquierdo and R. R. Brentani, Physiology of the prion protein, Physiol. Rev., 2008, 88(2), 673–728 CrossRef CAS PubMed.
- A. Aguzzi and A. M. Calella, Prions: protein aggregation and infectious diseases, Physiol. Rev., 2009, 89(4), 1105–1152 CrossRef CAS PubMed.
- J. R. Greig, Scrapie in sheep, J. Comp. Pathol. Ther., 1950, 60, 263–266 CrossRef CAS.
- S. B. Prusiner, Molecular biology of prion diseases, Science, 1991, 252(5012), 1515–1522 CrossRef CAS PubMed.
- C. Weissmann, Molecular genetics of transmissible spongiform encephalopathies, J. Biol. Chem., 1999, 274(1), 3–6 CrossRef CAS PubMed.
- S. B. Prusiner, Prions, Proc. Natl. Acad. Sci. U. S. A., 1998, 95(23), 13363–13383 CrossRef CAS PubMed.
- W. Chen, M. W. Van Der Kamp and V. Daggett, Diverse effects on the native β-sheet of the human prion protein due to disease-associated mutations, Biochemistry, 2010, 49(45), 9874–9881 CrossRef CAS PubMed.
- Y. Wen, et al., Unique structural characteristics of the rabbit prion protein, J. Biol. Chem., 2010, 285(41), 31682–31693 CrossRef CAS PubMed.
- R. Zahn, et al., NMR solution structure of the human prion protein, Proc. Natl. Acad. Sci. U. S. A., 2000, 97(1), 145–150 CrossRef CAS PubMed.
- M. Meli, M. Gasset and G. Colombo, Dynamic diagnosis of familial prion diseases supports the β2-α2 loop as a universal interference target, PLoS One, 2011, 6(4), e19093 CrossRef CAS PubMed.
- G. Ilc, et al., NMR structure of the human prion protein with the pathological Q212P mutation reveals unique structural features, PLoS One, 2010, 5(7), e11715 CrossRef PubMed.
- D. B. O'sullivan, C. E. Jones, S. R. Abdelraheim, M. W. Brazier, H. Toms, D. R. Brown and J. H. Viles, Dynamics of a truncated prion protein, prp (113–231), from (15)N NMR relaxation: order parameters calculated and slow conformational fluctuations localized to a distinct region, Protein Sci., 2009, 18(2), 410–423 CrossRef PubMed.
- L. Calzolai and R. Zahn, Influence of ph on NMR structure and stability of the human prion protein globular domain, J. Biol. Chem., 2003, 278(37), 35592–35596 CrossRef CAS PubMed.
- Y. Zhang, W. Swietnicki, M. G. Zagorski, W. K. Surewicz and F. D. Sönnichsen, Solution Structure of the E200K Variant of Human Prion Protein Implications for the mechanism of pathogenesis in familial prion diseases, J. Biol. Chem., 2000, 275(43), 33650–33654 CrossRef CAS PubMed.
- R. Diaz-Espinoza and C. Soto, High-resolution structure of infectious prion protein: the final frontier, Nat. Struct. Mol. Biol., 2012, 19(4), 370–377 CrossRef CAS PubMed.
- H. Wille, et al., Structural studies of the scrapie prion protein by electron crystallography, Proc. Natl. Acad. Sci. U. S. A., 2002, 99(6), 3563–3568 CrossRef CAS PubMed.
- C. Govaerts, H. Wille, S. B. Prusiner and F. E. Cohen, Evidence for assembly of prions with left-handed β-helices into trimers, Proc. Natl. Acad. Sci. U. S. A., 2004, 101(22), 8342–8347 CrossRef CAS PubMed.
- M. L. Demarco and V. Daggett, From conversion to aggregation: protofibril formation of the prion protein, Proc. Natl. Acad. Sci. U. S. A., 2004, 101(8), 2293–2298 CrossRef CAS PubMed.
- N. J. Cobb, F. D. Sönnichsen, H. Mchaourab and W. K. Surewicz, Molecular architecture of human prion protein amyloid: a parallel, in-register β-structure, Proc. Natl. Acad. Sci. U. S. A., 2007, 104(48), 18946–18951 CrossRef CAS PubMed.
- N. Blinov, M. Berjanskii, D. S. Wishart and M. Stepanova, Structural domains and main-chain flexibility in prion proteins, Biochemistry, 2009, 48(7), 1488–1497 CrossRef CAS PubMed.
- B. Christen, S. Hornemann, F. F. Damberger and K. Wüthrich, Prion protein NMR structure from tammar wallaby (Macropus eugenii) shows that the β2–α2 loop is modulated by long-range sequence effects, J. Mol. Biol., 2009, 389(5), 833–845 CrossRef CAS PubMed.
- S. Lee, L. Antony, R. Hartmann, K. J. Knaus, K. Surewicz, W. K. Surewicz and V. C. Yee, Conformational diversity in prion protein variants influences intermolecular β-sheet formation, EMBO J., 2010, 29(1), 251–262 CrossRef CAS PubMed.
- P. Derreumaux, Evidence that the 127–164 region of prion proteins has two equi-energetic conformations with β or α features, Biophys. J., 2001, 81(3), 1657–1665 CrossRef CAS PubMed.
- G. Rossetti, et al., Structural facets of disease-linked human prion protein mutants: a molecular dynamic study, Proteins: Struct., Funct., Bioinf., 2010, 78(16), 3270–3280 CrossRef CAS PubMed.
- K. P. Santo, M. Berjanskii, D. S. Wishart and M. Stepanova, Comparative analysis of essential collective dynamics and NMR-derived flexibility profiles in evolutionarily diverse prion proteins, Prion, 2011, 5(3), 188–200 CrossRef CAS PubMed.
- J. Chen and D. Thirumalai, Helices 2 and 3 are the initiation sites in the prpc → prpsc transition, Biochemistry, 2012, 52(2), 310–319 CrossRef PubMed.
- M. Adrover, et al., Prion fibrillization is mediated by a native structural element that comprises helices H2 and H3, J. Biol. Chem., 2010, 285(27), 21004–21012 CrossRef CAS PubMed.
- N. Chakroun, S. Prigent, C. A. Dreiss, S. Noinville, C. Chapuis, F. Fraternali and H. Rezaei, The oligomerization properties of prion protein are restricted to the H2H3 domain, FASEB J., 2010, 24(9), 3222–3231 CrossRef CAS PubMed.
- R. Tycko, R. Savtchenko, V. G. Ostapchenko, N. Makarava and I. V. Baskakov, The α-helical C-terminal domain of full-length recombinant prp converts to an in-register parallel β-sheet structure in prp fibrils: evidence from solid state nuclear magnetic resonance, Biochemistry, 2010, 49(44), 9488–9497 CrossRef CAS PubMed.
- R. I. Dima and D. Thirumalai, Exploring the propensities of helices in prp C to form β sheet using NMR structures and sequence alignments, Biophys. J., 2002, 83(3), 1268–1280 CrossRef CAS.
- G. Giachin, I. Biljan, G. Ilc, J. Plavec and G. Legname, Probing early misfolding events in prion protein mutants by NMR spectroscopy, Molecules, 2013, 18(8), 9451–9476 CrossRef CAS PubMed.
- E. Caldarulo, A. Barducci, K. Wüthrich and M. Parrinello, Prion protein β2–α2 loop conformational landscape, Proc. Indian Natl. Sci. Acad., 2017, 114(36), 9617–9622 CrossRef CAS.
- M. W. Van der Kamp and V. Daggett, Pathogenic mutations in the hydrophobic core of the human prion protein can promote structural instability and misfolding, J. Mol. Biol., 2010, 404(4), 732–748 CrossRef CAS PubMed.
- J. Zuegg and J. E. Gready, Molecular dynamics simulations of human prion protein: importance of correct treatment of electrostatic interactions, Biochemistry, 1999, 38(42), 13862–13876 CrossRef CAS.
- R. Riek, G. Wider, M. Billeter, S. Hornemann, R. Glockshuber and K. Wüthrich, Prion protein NMR structure and familial human spongiform encephalopathies, Proc. Natl. Acad. Sci. U. S. A., 1998, 95(20), 11667–11672 CrossRef CAS PubMed.
- W. C. Guest, N. R. Cashman and S. S. Plotkin, Electrostatics in the stability and misfolding of the prion protein: salt bridges, self energy, and solvation, Int. J. Biochem. Cell Biol., 2010, 88(2), 371–381 CrossRef CAS PubMed.
- C. J. Cheng and V. Daggett, Molecular dynamics simulations capture the misfolding of the bovine prion protein at acidic ph, Biomolecules, 2014, 4(1), 181–201 CrossRef PubMed.
- E. El-Bastawissy, M. H. Knaggs and I. H. Gilbert, Molecular dynamics simulations of wild-type and point mutation human prion protein at normal and elevated temperature, J. Mol. Graphics Modell., 2001, 20(2), 145–154 CrossRef CAS PubMed.
- S. Santini, J. B. Claude, S. Audic and P. Derreumaux, Impact of the tail and mutations G131V and M129V on prion protein flexibility, Proteins: Struct., Funct., Bioinf., 2003, 51(2), 258–265 CrossRef CAS PubMed.
- J. Singh and J. B. Udgaonkar, Unraveling the molecular mechanism of ph-induced misfolding and oligomerization of the prion protein, J. Mol. Biol., 2016, 428(6), 1345–1355 CrossRef CAS PubMed.
- S. Capellari, P. Parchi, C. M. Russo, J. Sanford, M. S. Sy, P. Gambetti and R. B. Petersen, Effect of the E200K mutation on prion protein metabolism: comparative study of a cell model and human brain, Am. J. Pathol., 2000, 157(2), 613–622 CrossRef CAS PubMed.
- Y. Friedman-Levi, et al., Fatal prion disease in a mouse model of genetic E200K Creutzfeldt-Jakob disease, PLoS Pathog., 2011, 7(11), e1002350 CrossRef CAS PubMed.
- I. Biljan, G. Giachin, G. Ilc, I. Zhukov, J. Plavec and G. Legname, Structural basis for the protective effect of the human prion protein carrying the dominant-negative E219K polymorphism, Biochem. J., 2012, 446(2), 243–251 CrossRef CAS PubMed.
- S. Jahandideh, M. Jamalan and M. Faridounnia, Molecular dynamics study of the dominant-negative E219K polymorphism in human prion protein, J. Biomol. Struct. Dyn., 2015, 33(6), 1315–1325 CrossRef CAS PubMed.
- D. Shukla, C. X. Hernández, J. K. Weber and V. S. Pande, Markov state models provide insights into dynamic modulation of protein function, Acc. Chem. Res., 2015, 48(2), 414–422 CrossRef CAS PubMed.
- C. R. Schwantes, D. Shukla and V. S. Pande, Markov state models and tICA reveal a nonnative folding nucleus in simulations of NuG2, Biophys. J., 2016, 110(8), 1716–1719 CrossRef CAS PubMed.
- A. P. Collins and P. C. Anderson, Complete Coupled Binding–Folding Pathway of the Intrinsically Disordered Transcription Factor Protein Brinker Revealed by Molecular Dynamics Simulations and Markov State Modeling, Biochemistry, 2018, 57(30), 4404–4420 CrossRef CAS PubMed.
- B. E. Husic, R. T. McGibbon, M. M. Sultan and V. S. Pande, Optimized parameter selection reveals trends in Markov state models for protein folding, J. Chem. Phys., 2016, 145(19), 194103 CrossRef PubMed.
- E. F. Pettersen, T. D. Goddard, C. C. Huang, G. S. Couch, D. M. Greenblatt, E. C. Meng and T. E. Ferrin, UCSF Chimera—a visualization system for exploratory research and analysis, J. Comput. Chem., 2004, 25(13), 1605–1612 CrossRef CAS PubMed.
- M. J. Abraham, T. Murtola, R. Schulz, S. Páll, J. C. Smith, B. Hess and E. Lindahl, GROMACS: high performance molecular simulations through multi-level parallelism from laptops to supercomputers, SoftwareX, 2015, 1, 19–25 CrossRef.
- W. D. Cornell, et al., A second generation force field for the simulation of proteins, nucleic acids, and organic molecules, J. Am. Chem. Soc., 1996, 117, 5179–5197 CrossRef.
- W. L. Jorgensen, J. Chandrasekhar, J. D. Madura, R. W. Impey and M. L. Klein, Comparison of simple potential functions for simulating liquid water, J. Chem. Phys., 1983, 79(2), 926–935 CrossRef CAS.
- G. Bussi, D. Donadio and M. Parrinello, Canonical sampling through velocity rescaling, J. Chem. Phys., 2007, 126(1), 014101 CrossRef PubMed.
- H. J. Berendsen, J. V. Postma, W. F. van Gunsteren, A. R. H. J. Dinola and J. R. Haak, Molecular dynamics with coupling to an external bath, J. Chem. Phys., 1984, 81(8), 3684–3690 CrossRef CAS.
- U. Essmann, L. Perera, M. L. Berkowitz, T. Darden, H. Lee and L. G. Pedersen, A smooth particle mesh Ewald method, J. Chem. Phys., 1995, 103(19), 8577–8593 CrossRef CAS.
- B. Hess, H. Bekker, H. J. Berendsen and J. G. Fraaije, LINCS: a linear constraint solver for molecular simulations, J. Comput. Chem., 1997, 18(12), 1463–1472 CrossRef CAS.
- M. Parrinello and A. Rahman, Polymorphic transitions in single crystals: a new molecular dynamics method, J. Appl. Phys., 1981, 52(12), 7182–7190 CrossRef CAS.
- D. R. Roe and T. E. Cheatham III, PTRAJ and CPPTRAJ: software for processing and analysis of molecular dynamics trajectory data, J. Chem. Theory Comput., 2013, 9(7), 3084–3095 CrossRef CAS PubMed.
- W. Humphrey, A. Dalke and K. Schulten, VMD: visual molecular dynamics, J. Mol. Graphics, 1996, 14(1), 33–38 CrossRef CAS PubMed.
- J. H. Prinz, et al., Markov models of molecular kinetics: generation and validation, J. Chem. Phys., 2011, 134, 174105 CrossRef PubMed.
- J. D. Chodera and F. Noé, Markov state models of biomolecular conformational dynamics, Curr. Opin. Struct. Biol., 2014, 25, 135–144 CrossRef CAS PubMed.
- J. D. Chodera, N. Singhal, V. S. Pande, K. A. Dill and W. C. Swope, Automatic discovery of metastable states for the construction of Markov models of macromolecular conformational dynamics, J. Chem. Phys., 2007, 126(15), 04B616 CrossRef PubMed.
- A. Sirur, D. De Sancho and R. B. Best, Markov state models of protein misfolding, J. Chem. Phys., 2016, 144(7), 075101 CrossRef PubMed.
- M. K. Scherer, B. Trendelkamp-Schroer, F. Paul, G. Pérez-Hernández, M. Hoffmann, N. Plattner, C. Wehmeyer, J. H. Prinz and F. Noé, Pyemma 2: A Software Package for Estimation, Validation, and Analysis of Markov Models, J. Chem. Theory Comput., 2015, 11(11), 5525–5542 CrossRef CAS PubMed.
- H. Wu and F. Noé, Variational approach for learning Markov processes from time series data, arXiv:1707.04659, 2017.
- F. Noé, C. Schütte, E. Vanden-Eijnden, L. Reich and T. R. Weikl, Constructing the equilibrium ensemble of folding pathways from short off-equilibrium simulations, Proc. Natl. Acad. Sci. U. S. A., 2009, 06(45), 19011–19016 CrossRef PubMed.
- T. J. Dolinsky, P. Czodrowski, H. Li, J. E. Nielsen, J. H. Jensen, G. Klebe and N. A. Baker, PDB2PQR: expanding and upgrading automated preparation of biomolecular structures for molecular simulations, Nucleic Acids Res., 2007, 35(2), W522–W525 CrossRef PubMed.
- N. A. Baker, D. Sept, S. Joseph, M. J Holst and J. A. Mccammon, Electrostatics of nanosystems: application to microtubules and the ribosome, Proc. Natl. Acad. Sci. U. S. A., 2001, 98(18), 10037–10041 CrossRef CAS PubMed.
- H. Li, A. D. Robertson and J. H. Jensen, Very fast empirical prediction and rationalization of protein pka values, Proteins: Struct., Funct., Bioinf., 2005, 61(4), 704–721 CrossRef CAS PubMed.
- B. Han, Y. Liu, S. W. Ginzinger and D. S. Wishart, SHIFTX2: significantly improved protein chemical shift prediction, J. Biomol. NMR, 2011, 50(1), 43–57 CrossRef CAS PubMed.
- R Development Core Team, R: A language and environment for statistical computing. R Foundation for Statistical Computing, Vienna, Austria, 2008, ISBN 3-900051-07-0, http://www.R-project.org Search PubMed.
- F. Noé and S. Fischer, Transition networks for modeling the kinetics of conformational change in macromolecules, Curr. Opin. Struct. Biol., 2008, 18(2), 154–162 CrossRef PubMed.
- G. Borgohain, N. Dan and S. Paul, Use of molecular dynamics simulation to explore structural facets of human prion protein with pathogenic mutations, Biophys. Chem., 2016, 213, 32–39 CrossRef CAS PubMed.
- Y. Chebaro and P. Derreumaux, The conversion of helix H2 to beta-sheet is accelerated in the monomer and dimer of the prion protein upon T183A mutation, J. Phys. Chem. B, 2009, 113(19), 6942–6948 CrossRef CAS PubMed.
- S. Zhou, D. Shi, X. Liu, H. Liu and X. Yao, Protective V127 prion variant prevents prion disease by interrupting the formation of dimer and fibril from molecular dynamics simulations, Sci. Rep., 2016, 24(6), 21804 CrossRef PubMed.
- M. L. DeMarco and V. Daggett, Molecular mechanism for low ph triggered misfolding of the human prion protein, Biochemistry, 2007, 46(11), 3045–3054 CrossRef CAS PubMed.
- S. Menon and N. Sengupta, Perturbations In Inter-Domain Associations May Trigger The Onset Of Pathogenic Transformations In Prp(C): Insights From Atomistic Simulations, Mol. BioSyst., 2015, 11(5), 1443–1453 RSC.
- G. Rossetti, X. Cong, R. Caliandro, G. Legname and P. Carloni, Common structural traits across pathogenic mutants of the human prion protein and their implications for familial prion diseases, J. Mol. Biol., 2011, 411(3), 700–712 CrossRef CAS PubMed.
- G. Rossetti, G. Giachin, G. Legname and P. Carloni, Structural facets of disease-linked human prion protein mutants: a molecular dynamic study, Proteins: Struct., Funct., Bioinf., 2010, 78(16), 3270–3280 CrossRef CAS PubMed.
Footnote |
| † Electronic supplementary information (ESI) available: Details of geometrical parameters used for carrying out feature based PCA, validating parameters for MSM and plots for geometrical parameters for MSM clusters. See DOI: 10.1039/c9ra01507h. |
| This journal is © The Royal Society of Chemistry 2019 |

