
 Open Access Article
 This Open Access Article is licensed under a Creative Commons Attribution-Non Commercial 3.0 Unported Licence
Effect of fatty acids and triglycerides on the formation of lysine-derived advanced glycation end-products in model systems exposed to frying temperature†
Yuting Wanga,
Huiyu Hua,
David Julian McClements b,
Shaoping Niea,
Mingyue Shen*a,
Chang Lia,
Yousheng Huangad,
Jie Chenc,
Maomao Zengc and
Mingyong Xie*a
b,
Shaoping Niea,
Mingyue Shen*a,
Chang Lia,
Yousheng Huangad,
Jie Chenc,
Maomao Zengc and
Mingyong Xie*a
aState Key Laboratory of Food Science and Technology, China-Canada Joint Lab of Food Science and Technology (Nanchang), Nanchang University, 235 Nanjing East Road, Nanchang 330047, China. E-mail: myxie@ncu.edu.cn; shenmingyue1107@163.com; Fax: +86-791-88304779; Fax: +86-791-88304447; Tel: +86-791-88304779 Tel: +86-791-88304447
bDepartment of Food Science, University of Massachusetts Amherst, Amherst, MA 01003, USA
cState Key Laboratory of Food Science and Technology, Jiangnan University, Wuxi, 214122, China
dJiangxi Institute of Analysis and Testing, Nanchang 330029, China
First published on 14th May 2019
Abstract
Lysine-derived advanced glycation end-products (AGEs), including Nε-carboxymethyllysine (CML), Nε-carboxyethyllysine (CEL) and pyrraline, are prevalent in processed foods. The impact of lipids on AGE formation is still contentious and most of our current knowledge is based only on CML. Little is known about how lipids impact the formation of CEL and pyrraline, or their involvement in formation pathways. This study investigated the effect of lipids (fatty acids and triglycerides) on the formation of CML, CEL and pyrraline simultaneously in model systems subjected to frying temperature. The results showed the presence of the lipids promoted the formation of CML, CEL and pyrraline. The promotion effects on CML and CEL were not dependent on the unsaturation degree and addition level (50, 100 or 150 μmol) of lipid, while pyrraline formation depended on lipid type (fatty acids vs. triglycerides) and level. The concentration of CML and CEL was statistically correlated with the concentration of glyoxal (GO) and methylglyoxal (MGO), respectively. The pyrraline concentration was statistically correlated with fructoselysine concentration. These results suggested that lipids promote the formation of lysine-derived AGEs by impacting the generation of Amadori products and α-dicarbonyl compounds. This information may be useful for optimizing the formulation and processing conditions to create tastier and healthier foods.
1. Introduction
Advanced glycation end products (AGEs) are generated from the Maillard reaction during food cooking and processing, as well as in living organisms.1 AGEs are a diverse group of substances formed by reactions between biological molecules with different compositions and structures, such as reducing sugars, dicarbonyl compounds, amino acids, peptides, proteins, lipids and nucleic acids.2–6 Studies suggest that the intake of dietary AGEs can promote the accumulation of advanced glycation end products in the human body.7–9 Moreover, other studies indicate that ingestion of high levels of dietary AGEs can have an adverse impact on human health, which is linked to their ability to promote inflammation, oxidative stress, diabetes, and kidney damage.9–12 These findings have led to some concern about the potential risks of AGE ingestion because these compounds are formed during the cooking and processing of many types of commonly consumed foods. Consequently, there is a need to better understand and control the formation of AGEs during food preparation.Dietary AGEs with different characteristics are formed from different kinds of amino acids. Nε-carboxymethyllysine (CML), Nε-carboxyethyllysine (CEL) and pyrraline are the most important AGEs formed from lysine, which is a common amino acid in many foods.13 Of these, CML has been the most widely investigated so far. Lysine-derived AGEs are not only generated from the degradation of Amadori products (fructoselysine) during the Maillard reaction, but also through the direct reaction between lysine and reactive dicarbonyl compounds, such as glyoxal (GO), methylglyoxal (MGO), and 3-deoxyglucosone (3-DG).14–16 Furthermore, it has been reported that the reaction of lysine with GO, MGO and 3-DG contributes to the formation of CML, CEL and pyrraline, respectively.5,17–19 Amadori products (APs) are the first stable intermediates generated during the initial stages of the Maillard reaction, which can then be converted into a large number of downstream products.20,21 Also, the APs of lysine is an important precursor of pyrraline.22 Previous studies have mainly focused on the contributions that fructoselysine made to the formation of CML in model systems or foodstuffs. There are, however, still gaps in our understanding of how fructoselysine impacts the formation of CEL and pyrraline in the presence of lipids and under high temperature. Similarly, as important precursors of lysine-derived AGEs, α-dicarbonyl compounds are not only derived from degradation of Amadori products,23,24 but also from saccharide degradation and lipid oxidation.25,26 It has been proposed that the level of α-dicarbonyl compounds present in a food is linked to the formation of AGEs.27,28 However, our understanding of the role of α-dicarbonyl compounds on the AGEs formation at high temperature is still fragmentary, especially in the complex food systems in which carbohydrate, protein or amino acids and oil exist and interact with each other.
Recently, some studies have examined the effects of lipids on the formation of AGEs in model systems and foodstuffs, which has led to conflicting findings. When model foods were subjected to thermal processing (95 °C, 8 h), the amount of CML formed in a casein–glucose–linolenic acid system was less than that formed in a casein–glucose system, indicating that this lipid inhibited CML formation.29 Conversely, other studies have shown that vegetable oils can promote CML formation by an amount that depends on the degree of unsaturation of the fatty acids.30 The presence of lipids in a food undergoing the Maillard reaction may induce the formation of more hydroxyl radicals, which boosts CML generation from fructoselysine and GO.31 In real foods, the CML content of muffins was reported to raise with the increase of unsaturation degree of lipid,32 and fat content was reported to promote the formation of protein-bound CML and CEL in cooked ground beef.33 As mentioned above, there is still a dispute as to whether lipids promotes or inhibits the formation of AGEs, as well as about the mechanism by which lipid affects the formation of AGEs during the Maillard reaction. Hence, further systematic research is required to elucidate the impact of lipids on the formation of AGEs.
In the current study, we examined the impact of lipid type and concentration on the formation of lysine-derived AGEs (CML,CEL and pyrraline) by subjecting a model systems to frying temperature. The model system consisted of a mixture of glucose and lysine that were heated in the absence or presence of different kinds of fatty acids (oleic acid, linoleic acid, and linolenic acid) or triglycerides (triolein and trilinolein). To gain a more comprehensive understanding of the role of unsaturated lipids on the generation of lysine-derived AGEs, we determined the influence of various unsaturated fatty acids and triglycerides on the formation of the Amadori product (fructoselysine) and α-dicarbonyl compounds (3-DG, GO and MGO). Furthermore, we analyzed the correlation between precursors and lysine-derived AGEs in the absence or presence of unsaturated lipids, so as to better understand how the lipids impacted lysine-derived AGEs generation.
2. Materials and methods
2.1 Chemical and reagents
D-Glucose (≥99.5%), L-lysine (≥99%), oleic acid (≥99%), linoleic acid (≥99%), linolenic acid (≥99%), 3-deoxyglucosone (≥75%), quinoxaline (≥99%), 2-methylquinoxaline (≥97%), 2,3-dimethylquinoxaline (≥97%), o-phenylenediamine (≥98%), diethylenetriaminepentaacetic acid (≥98%), formic acid (LC-MS additives), acetic acid of HPLC grade and sodium acetate of HPLC grade were obtained from Sigma-Aldrich (St. Louis, MO, USA). Nε-Carboxymethyllysine and Nε-carboxyethyllysine standards as well as d4-Nε-carboxymethyllysine and d4-Nε-carboxyethyllysine standards were purchased from Toronto Research Chemicals Inc. (North York, Ontario, Canada). Pyrraline (≥99%) was purchased from PolyPeptide Group (Strasbourg, France). N-(1-Deoxy-D-fructosyl)-L-lysine (≥99%) was synthesized by HitGen Ltd (Chengdu, China). Triolein (≥99%), trilinolein (≥99%), potassium phosphate dibasic of HPLC grade and potassium phosphate monobasic of HPLC grade were obtained from Shanghai Aladdin Biochemical Technology Co. (Shanghai, China). Methanol (MS grade) was acquired from Merck KGaA Group (Darmstadt, Germany). Deionized water was provided by the Watson Group Ltd. (Hongkong, China). Syringe filters (nylon, 0.22 μm) were bought from the Waters Corporation (Milford, MA, USA).2.2 Preparation and thermal treatment of model system
A binary model system (lysine–glucose) and two ternary model systems (lysine–glucose–fatty acid and lysine–glucose–triglyceride) were designed to study the influence of lipid type on the formation of CML, CEL, and pyrraline during heating under frying temperature. The binary model systems were prepared with distilled water in 15 mL thick-wall pressure-resistant glass tubes (Beijing Synthware Glass Instrument Co. Ltd, Beijing, China), using a molar concentration ratio of lysine-to-glucose of 2![[thin space (1/6-em)]](https://www.rsc.org/images/entities/char_2009.gif) :1 (50 mM:25 mM). The ternary model systems were prepared by adding 50, 100 or 150 μmol of oleic acid, linoleic acid, linolenic acid or 50, μmol of triolein or trilinolein into 2 mL lysine–glucose systems. The model system containing only lysine and glucose (no lipids) was used as a control (LG-control). Then, the glass tubes containing the model systems were sealed using a polytetrafluoroethylene screw cap with a sealing ring. Subsequently, thermal treatments were performed at 180 °C (±2 °C) for 30 min in an electric thermostatic blast oven (DHG-9143B5-III, Shanghai CIMO Medical Instrument Manufacture Co. LTD, Shanghai, China). The treated samples were immediately cooled down using an ice bath and then centrifuged at 3580 g for 5 min (Sigma 3K15, Sigma Laborzentrifugen GmbH, Osterode am Haez, Lower Saxony, Germany). Then, the samples were filtered through a 0.22 μm syringe filter and kept at −20 °C until analysis. All the experiments were conducted in triplicate.
:1 (50 mM:25 mM). The ternary model systems were prepared by adding 50, 100 or 150 μmol of oleic acid, linoleic acid, linolenic acid or 50, μmol of triolein or trilinolein into 2 mL lysine–glucose systems. The model system containing only lysine and glucose (no lipids) was used as a control (LG-control). Then, the glass tubes containing the model systems were sealed using a polytetrafluoroethylene screw cap with a sealing ring. Subsequently, thermal treatments were performed at 180 °C (±2 °C) for 30 min in an electric thermostatic blast oven (DHG-9143B5-III, Shanghai CIMO Medical Instrument Manufacture Co. LTD, Shanghai, China). The treated samples were immediately cooled down using an ice bath and then centrifuged at 3580 g for 5 min (Sigma 3K15, Sigma Laborzentrifugen GmbH, Osterode am Haez, Lower Saxony, Germany). Then, the samples were filtered through a 0.22 μm syringe filter and kept at −20 °C until analysis. All the experiments were conducted in triplicate.
2.3 Analysis of fructoselysine
The determination of fructoselysine was carried out on An Agilent 1290 UPLC system combined with an Agilent 6460 triple-quadrupole mass spectrometry equipped with a Jet Stream ESI source (Agilent Technologies Inc. Santa Clara, CA, USA). A Phenomenex Synergi Hydro-RP column (250 mm × 2 mm, 4 μm, 80 Å; Phenomenex, Torrance, CA, USA) was used for the chromatographic separation. The binary mobile phase compositions were methanol and 0.1% (v/v) formic acid in water (30:70, v/v). The isocratic condition was applied at a flow rate of 0.2 mL min−1. The temperature of the column oven was maintained at 25 °C and the injection volume used was set at 5 μL.
The identification and quantitation of fructoselysine was achieved using the positive ESI and MRM mode. The optimized parameters used for this analysis are presented in the ESI (Table S1†). The quantitation and qualification ions of fructoselysine were m/z 309 → 84 and m/z 309 → 147, respectively. The optimal settings of MS for fructoselysine detection are reported in the ESI (Table S2†). The total and extracted ion chromatogram of each specific transition is also shown in the ESI (Fig. S1†). The fructoselysine was calibrated by a standard curve (r2 = 0.9990) built with fructoselysine standard gradients.
2.4 Analysis of α-dicarbonyl compounds
The levels of α-dicarbonyl compounds in the samples were analyzed according to procedures described in previous research with some modifications.342.5 Analysis of CML and CEL
The concentrations of CML and CML in the model systems were analyzed using a UPLC-QqQ-MS/MS method on the same instrument and chromatographic column described in Part 2.3. The binary mobile phase of methanol and aqueous 0.3% (v/v) formic acid (1:99, v/v) at a flow rate of 0.2 mL min−1 was used for isocratic elution. The column temperature was set 25 °C and the injection volume was set 1 μL.
The ESI source was operated in positive mode with the parameters shown in the ESI (Table S3†). Acquisition was done in multiple reaction monitoring (MRM) mode to identify and quantify CML and CEL. Quantitation was achieved by means of the internal standard method. Isotopic labelled d4-CML and d4-CEL were used as internal standards for the calculation and were spiked into the samples before determination. The quantifying transition ions for CML, d4-CML, CEL and d4-CEL were respectively m/z 205 → 84, m/z 209 → 88, m/z 219 → 84 and m/z 223 → 88. The specific transition of m/z 205 → 130 for CML, m/z 209 → 134 for d4-CML, m/z 219 → 130 for CEL and m/z 223 → 134 for d4-CEL were also monitored for confirmation purposes. The details of the precursor and product ions and corresponding optimized MS parameters are shown in the ESI (Table S4†). The total and extracted ion chromatograms of the monitored transition ions are also shown in the ESI (Fig. S2†). Prior to UPLC-QqQ-MS/MS analysis, the samples were diluted with double distilled water to a reasonable dilution and the d4-CML and d4-CEL was added to each sample with the concentration of 100 ng mL−1.
2.6 Analysis of pyrraline
The analysis of pyrraline was performed on the same UPLC-QqQ-MS/MS system with the same chromatographic column mentioned above. The column was set thermostatically at 30 °C and the injection volume is 2 μL. The mobile phase consisted of a mixture of methanol as solvent A and 0.1% formic acid (v/v) in deionized water as solvent B. Chromatographic separation was achieved using the gradient elution method at a flow rate of 0.3 mL min−1. The gradient began at 15% solvent A and increased linearly to 25% solvent A over 4 min, then decreased to 15% solvent A in 1 min, and then remained for 1 min for the equilibration of the column. The ESI source was operated using the settings presented in the ESI (Table S5†). The MS was run in MRM mode with specific transitions of m/z 255.1 → 175 and 255.1 → 237 for the quantitation and qualification of pyrraline. The MS conditions of the precursor and product ions are shown in detail in the ESI (Table S6†). Also, the total and extracted ion chromatograms of the analyte are shown in the. ESI (Fig. S3†). The amount of pyrraline was figured out through external standard method.2.7 Statistical analysis
Experiments were conducted in triplicate. Results were expressed as mean ± standard deviation. Statistical significances among the different samples were assessed by IBM SPSS Statistics 23.0 (SPSS Inc., Chicago, IL, USA) using one-way analysis of variance (ANOVA) and Duncan's test. The significant differences were defined at a level of p-value < 0.05. The analysis of the correlations between lysine-derived AGEs and fructoselysine and α-dicarbonyl compounds was conducted on IBM SPSS Statistics 23.0 by Pearson's correlation test, and p-value below 0.05 or p-value below 0.01 demonstrated the different levels of statistical significance.3. Results and discussions
3.1 Effects of fatty acids and triglycerides on fructoselysine formation
The Maillard and lipid oxidation reactions occur in parallel and are connected to each other through the existence of some common intermediates and pathways. The former reaction can modulate the latter one and vice versa.35 The Amadori product, an important Maillard reaction intermediate, has been reported to strongly affect lipid oxidation.36 Likewise, lipids might promote or suppress the Maillard reaction since some lipid oxidation products can react with Maillard reaction products. However, the current understanding of the impact of lipids on Amadori products formation is still relatively limited.Fructoselysine is an Amadori product containing lysine, which can fragment into lysine-derived AGEs through several pathways. Fructoselysine can form CML through oxidative degradation.37 Moreover, the sugar residue of fructoselysine can be cleaved through the non-oxidative degradation and then the lysine residue react with 3-DG to form pyrraline.38 Hence, it is indispensable to investigate the effects of lipids on fructoselysine formation, which is crucial to better understanding of how lipids impact lysine-derived AGEs formation. The present study investigated the impact of various unsaturated fatty acids (oleic, linoleic, and linolenic acid) and triglycerides (triolein and trilinolein) on the formation of fructoselysine, α-dicarbonyl compounds and lysine-derived AGEs in model systems under frying temperature. These lipids were chosen so that we could examine the impact of addition concentration, unsaturation degree, and esterification of fatty acids on the formation of fructoselysine, α-dicarbonyl compounds and lysine-derived AGEs. Typically, fructoselysine is analyzed indirectly by detecting its acid hydrolysis product (furosine). In the present work, fructoselysine was detected directly using UPLC-QqQ-MS/MS, and the effect of unsaturated lipids on its formation was investigated.
The effects of fatty acids and triglycerides on the fructoselysine formation were shown in Tables 1 and 2, respectively. The results showed that the addition of unsaturated fatty acids increased the amount of fructoselysine in model systems (Table 1). This observation suggests that compounds and free radicals generated from lipid oxidation may accelerate the Maillard reaction, which then contributes to more fructoselysine formation. The fatty acid unsaturation did not appear to have a major impact on the fructoselysine level. However, the fructoselysine level increased as the fatty acid content increased. This effect might be due to more lipid oxidation products and free radicals being generated during heating at higher total lipid levels. As shown in Table 2, a significant increase was found for the fructoselysine content of model systems added with triglycerides as compared with LG-control. This promotion effect was not statistically different with the increase of unsaturation degree of the triglycerides. Moreover, addition of free fatty acids led to a greater increase in fructoselysine levels than addition of the equivalent triglycerides. This may be because free fatty acids could be more easily miscible with water than triglycerides under the frying conditions applied. These observations indicated that the form of lipids (esterified or not) might play a vital role in the effect on the fructoselysine formation. Fructoselysine is an intermediate in the Maillard reaction and is an important precursor of AGEs. It can be degraded into GO, MGO and 3-DG, which can then react with lysine to form CML, CEL and pyrraline, respectively.14–16 Moreover, it was reported that free radicals can also induce the fragmentation of Amadori products.39 Therefore, the effects of unsaturated lipids on fructoselysine levels may a combination of generation and degradation reactions.
| Fatty acid | Fructoselysine concentration (nmol mL−1) | ||
|---|---|---|---|
| 50 μmola | 100 μmola | 150 μmola | |
| a Different addition levels of fatty acid. LG-control, the model system only contains lysine and glucose without any addition of lipids. Values in each column demonstrate the mean ± standard deviation (n = 3). Different lowercase letters in the same column denoted statistically significant difference (p < 0.05) among samples added with different kinds of fatty acid. Different capital letters in the same row denoted statistically significant difference (p < 0.05) among samples added with different addition levels. | |||
| LG-control | 116 ± 6a | 116 ± 6a | 116 ± 6a |
| Oleic acid | 136 ± 3b A | 151 ± 6b B | 162 ± 6c C |
| Linoleic acid | 128 ± 9ab A | 138 ± 15b AB | 152 ± 7bc B |
| Linolenic acid | 125 ± 7ab A | 150 ± 3b B | 150 ± 4b B |
| Samples | Fructoselysine concentration (nmol mL−1) |
|---|---|
| a LG-control, the model system only contains lysine and glucose without any addition of lipids. LG-triolein, model system added with trolein; LG-trilinolein, model systems added with trilinolein. LG-oleic acid-3, model system added with 150 μmol oleic acid; LG-linoleic acid-3, model system added with 150 μmol linoleic acid. Values in each column demonstrate the mean ± standard deviation (n = 3). Different letters in the same column, denoted statistically significant difference (p < 0.05). (*) p < 0.05, significantly different from LG-oleic acid-3. (#) p < 0.05, significantly different from LG-linoleic acid-3. | |
| LG-control | 116 ± 6a |
| LG-triolein | 130 ± 6b* |
| LG-trilinolein | 137 ± 3b# |
| LG-oleic acid-3 | 162 ± 6 |
| LG-linoleic acid-3 | 152 ± 7 |
3.2 Effects of fatty acids and triglycerides on the formation of α-dicarbonyl compounds
Highly reactive α-dicarbonyl compounds, such as 3-DG, GO and MGO, are commonly found in processed foods. They are generated via oxidation of Amadori product during Maillard reaction and originated from glucose through dehydration, isomerization and retro-aldolization.23–25 In addition, as short-chain α-dicarbonyl compounds, GO and MGO can also be generated from lipid oxidation reactions involving free radicals.26 They can also undergo Strecker degradation to form aldehydes that play a key role in color and flavor formation. Moreover, α-dicarbonyl compounds can then react with the amino group in amino acids to form AGEs.14–16 To get a deeper insight into the role of unsaturated lipids on the generation of lysine-derived AGEs, the effect of unsaturated fatty acids and triglycerides on the formation of α-dicarbonyl compounds (3-DG, GO and MGO) was determined. As 3-DG was not detected in the present study, only the levels of GO and MGO formed are reported (Tables 3–5). The reason that 3-DG was not detected may be because it converted into HMF40 or reacted with lysine to form pyrraline22 or it degraded into MGO and various volatile molecules in the current study.41As shown in Table 3, the unsaturated fatty acids increased the GO content at high addition level (150 μmol) and the increasing effect was not dependent on the unsaturation degree. At low (50 μmol) and medium (100 μmol) addition levels, only oleic acid showed increasing effects on the GO content. Meanwhile, triglycerides significantly enhanced GO formation (Table 5). Furthermore, the triolein addition and equivalent oleic acid caused similar GO formation, while the trilinolein led to more GO formation than equivalent linoleic acid. It was reported that lipid oxidation not only form GO but also induce free radical which can facilitate the conversion of GO into AGEs by reacting with lysine.26,31 Thus, lipid oxidation possess dual effect on the GO yield.
| Fatty acid | GO concentration (nmol mL−1) | ||
|---|---|---|---|
| 50 μmola | 100 μmola | 150 μmola | |
| a Different addition levels of fatty acid. LG-control, the model system only contains lysine and glucose without any addition of lipids. Values in each column demonstrate the mean ± standard deviation (n = 3). Different lowercase letters in the same column denoted statistically significant difference (p < 0.05) among samples added with different kinds of fatty acid. Different capital letters in the same row denoted statistically significant difference (p < 0.05) among samples added with different addition levels. | |||
| LG-control | 5.6 ± 0.2a | 5.6 ± 0.2a | 5.6 ± 0.2a |
| Oleic acid | 6.9 ± 0.5b B | 6.5 ± 0.1b AB | 6.00 ± 0.05b A |
| Linoleic acid | 6.12 ± 0.02a A | 5.9 ± 0.2a A | 6.0 ± 0.1b A |
| Linolenic acid | 6.1 ± 0.2a A | 5.6 ± 0.2a A | 6.05 ± 0.07b A |
As shown in Table 4, the presence of the unsaturated fatty acids increased the level of MGO formed during heating at frying temperature, with the effect slightly increasing with addition level and slightly decreasing with unsaturation For the triglycerides, triolein promoted MGO generation while trilinolein had no significant effect. The free fatty acids led to greater MGO formation than the equivalent triglycerides (Table 5).
| Fatty acid | MGO concentration (nmol mL−1) | ||
|---|---|---|---|
| 50 μmola | 100 μmola | 150 μmola | |
| a Different addition levels of fatty acid. LG-control, the model system only contains lysine and glucose without any addition of lipids. Values in each column demonstrate the mean ± standard deviation (n = 3). Different lowercase letters in the same column denoted statistically significant difference (p < 0.05) among samples added with different kinds of fatty acid. Different capital letters in the same row denoted statistically significant difference (p < 0.05) among samples added with different addition levels. | |||
| LG-control | 197 ± 5a | 197 ± 5a | 197 ± 5a |
| Oleic acid | 373 ± 4b A | 426 ± 3b B | 417 ± 4b B |
| Linoleic acid | 351 ± 6c A | 391 ± 3c B | 416 ± 19b B |
| Linolenic acid | 339 ± 8c A | 363 ± 3d B | 338 ± 4c A |
| Samples | Concentration (nmol mL−1) | |
|---|---|---|
| GO | MGO | |
| a LG-control, the model system only contains lysine and glucose without any addition of lipids. LG-triolein, model system added with trolein; LG-trilinolein, model systems added with trilinolein. LG-oleic acid-3, model system added with 150 μmol oleic acid; LG-linoleic acid-3, model system added with 150 μmol linoleic acid. Values in each column demonstrate the mean ± standard deviation (n = 3). Different letters in the same column, denoted statistically significant difference (p < 0.05). (*) p < 0.05, significantly different from LG-oleic acid-3. (#) p < 0.05, significantly different from LG-linoleic acid-3. | ||
| LG-control | 5.58 ± 0.17a | 197.4 ± 4.6a |
| LG-triolein | 6.52 ± 0.59b | 256.8 ± 6.8b * |
| LG-trilinolein | 6.34 ± 0.02b # | 219.3 ± 9.6a # |
| LG-oleic acid-3 | 6.00 ± 0.05 | 417 ± 4 |
| LG-linoleic acid-3 | 6.0 ± 0.1 | 416 ± 19 |
The α-dicarbonyl compounds are precursors of AGEs as well as degradation products of fructoselysine. Therefore α-dicarbonyl compounds play a vital role in AGEs formation during food processing. The α-dicarbonyl compounds can also be generated from sugar oxidation and lipid oxidation.27,28 The effect of lipids on α-dicarbonyl compound formation in the Maillard reaction system is complex. Furthermore, GO, MGO are easily degraded into organic acids, such as formic acid, during thermal processing.
3.3 Effects of fatty acids and triglycerides on CML and CEL formation
The effects of fatty acids and triglycerides on the CML formation in the models systems under frying temperature were presented in the Fig. 1. As shown in Fig. 1A, the CML concentration of LG-control was 148 ± 4 nmol mL−1, the addition of unsaturated fatty acids significantly favored CML formation. This effect may be attributed to the oxidation of the unsaturated fatty acids during frying. Previous studies have reported that lipid oxidation products can promote GO formation, which is a known precursor for CML formation.30 Moreover, lipid oxidation releases hydroxyl radicals (·OH), which are also known to promote CML formation.31 Conversely, other studies have shown that the presence of fatty acids actually retards CML generation: in this case, the lipids were added to casein–glucose model systems heated at 95 °C for 8 h.29 Moreover, linoleic acid was shown to inhibit CML generation for glucose–lysine model systems under accelerated shelf-life conditions.42 The apparent discrepancies between different studies might be due to the different food models and heating conditions used. In particular, lipid oxidation will occur more rapidly under frying conditions than at 95 °C or under accelerated shelf-life conditions. In the current study, fatty acid oxidation during frying may therefore have played a more important role in promoting CML formation. While in the other two studies mentioned, the extent of lipid oxidation was less and so there were more fatty acids available that could competitively interfere with the reaction of glucose with lysine.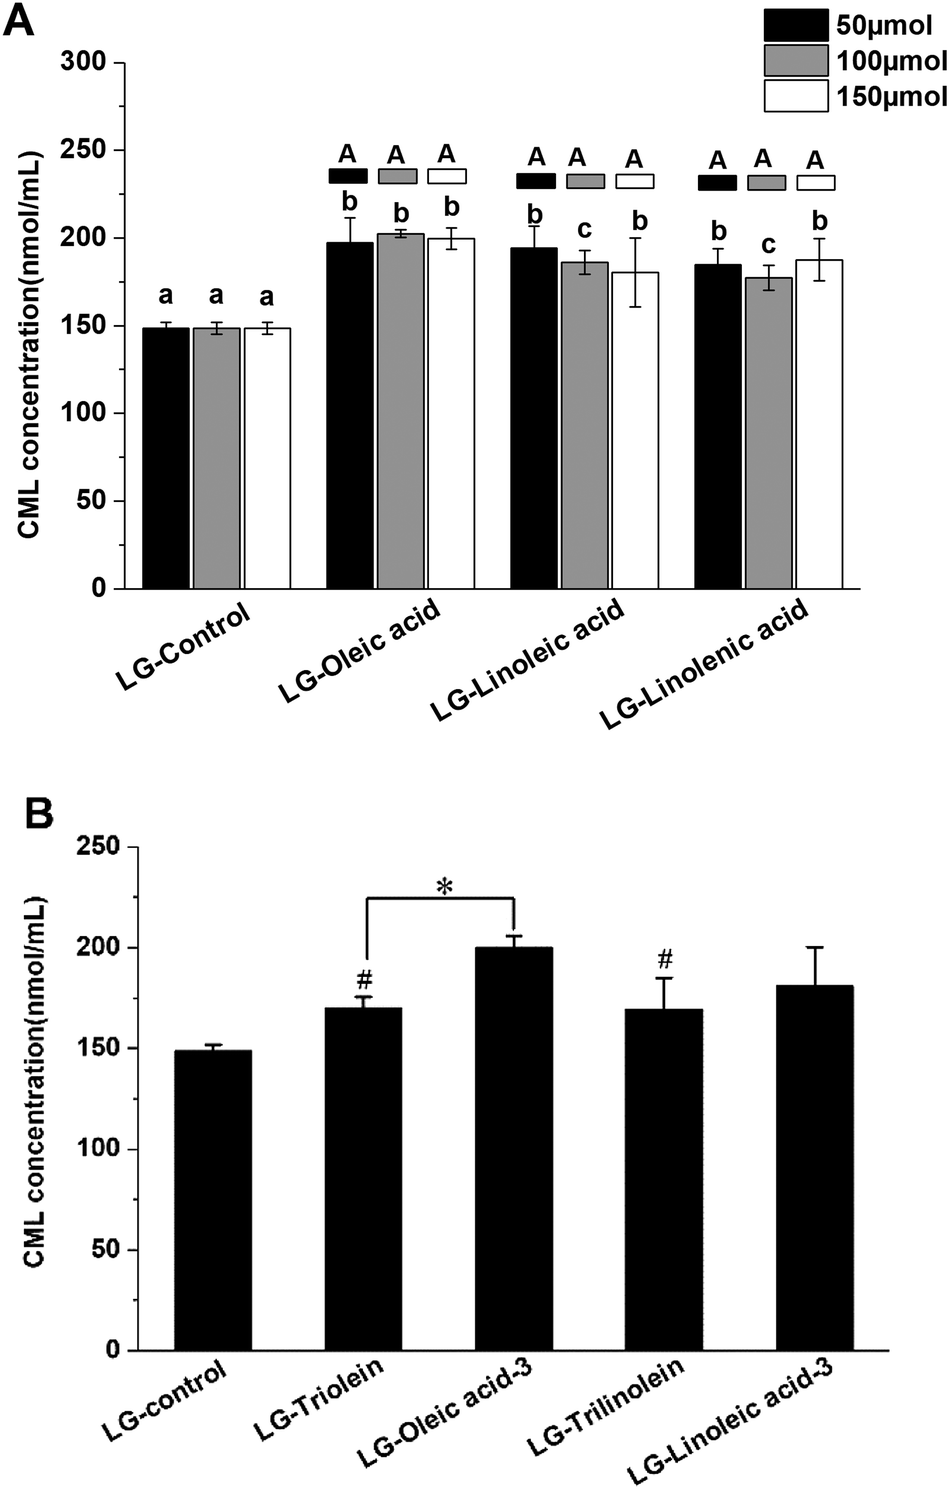 | ||
| Fig. 1 Effects of fatty acids (FAs) and triglycerides (TGs) on the CML formation in model systems. (A) The effects of different unsaturation degree and concentration of FAs on the CML formation; (B) the effects of different TGs on the CML formation; different lowercase letters indicate significant differences (p < 0.05) among different unsaturation degree of FA (same addition level), while different capital letters indicate significant differences (p < 0.05) among different addition levels (same FA). (*) p < 0.05, significantly different between compared samples. (#) p < 0.05, significantly different from LG-control. LG-triolein, model system added with trolein; LG-trilinolein, model systems added with trilinolein. LG-oleic acid-3, model system added with 150 μmol oleic acid; LG-linoleic acid-3, model system added with 150 μmol linoleic acid. | ||
The results shown in Fig. 1A suggest that the degree of unsaturation of the fatty acids had little impact on CML formation. Our findings are, therefore, different from those reported in earlier studies, which indicated that CML formation increased with increasing lipid unsaturation.30 The origin of this effect was attributed to the fact that the susceptibility of fatty acids to oxidation increases as their degree of unsaturation increases. As a result, their presence contributes to greater GO and free radical generation during thermal processing, thereby facilitating CML formation. Moreover, we found that the concentration of unsaturated fatty acids present did not affect the amount of CML produced after thermal treatment exposed to frying temperature. In the present study, the GO was not only generated from lipid oxidation but also from the Maillard reaction between lysine and glucose. As Table 1 presented, the GO content did not increase with increase of the lipid unsaturation and addition level. This phenomenon might be responsible for the CML formation behavior in the model systems added with fatty acid. The presence of the triglycerides promoted CML formation (Fig. 1B). In addition, the degree of unsaturation of the triglycerides did not significantly affect CML formation. These results can be explained by a similar reasoning as for fatty acid addition. The ester form of the fatty acids was found to have a significant impact on CML formation during thermal treatment in some cases. Oleic acid addition led to more CML generation than triolein addition (Fig. 1B). Linoleic acid addition also led to more CML formation than trilinolein addition, but the effect was not significant (Fig. 1B). This results can be explained by the stronger steric hindrance of triglycerides than fatty acids, which could impact the reaction rate between reactants in the models.
In addition, the LG-control and model systems added with fatty acid showed a positive correlation between the CML concentration and GO concentration (r = 0.702, p < 0.05). However, the model systems added with triglyceride was not match this correlation. These findings indicated that the fatty acids impact the CML formation through impacting the GO formation. Nevertheless, this mechanism is unfit for explaining the effect of triglycerides on CML formation. This might be attributed from the different structure of free fatty acid and triglyceride. Moreover, no significant correlation was found between CML concentration and fructoselysine concentration, though fructoselysine is an important precursor of CML formation.
The effects of fatty acids and triglycerides on the CEL formation in the models systems under frying temperature were presented in the Fig. 2, the LG-control contained 126 ± 4 nmol mL−1 CEL. Thus, CEL formation was less than CML formation under the conditions used in this study, which is in accordance with previous studies.16 As a precursor of CEL formation, MGO can react with lysine through the keto group. While CML can be generated from the reaction between lysine and the more-reactive aldehyde function of GO.16 This difference in reactivity may account for the lower level of CEL observed in the current work. As an analogue of CML, CEL mainly originates from the reaction between MGO and lysine.14 The available data about the formation of CEL through other precursors and pathways is currently lacking and needs to be explored more in future studies.
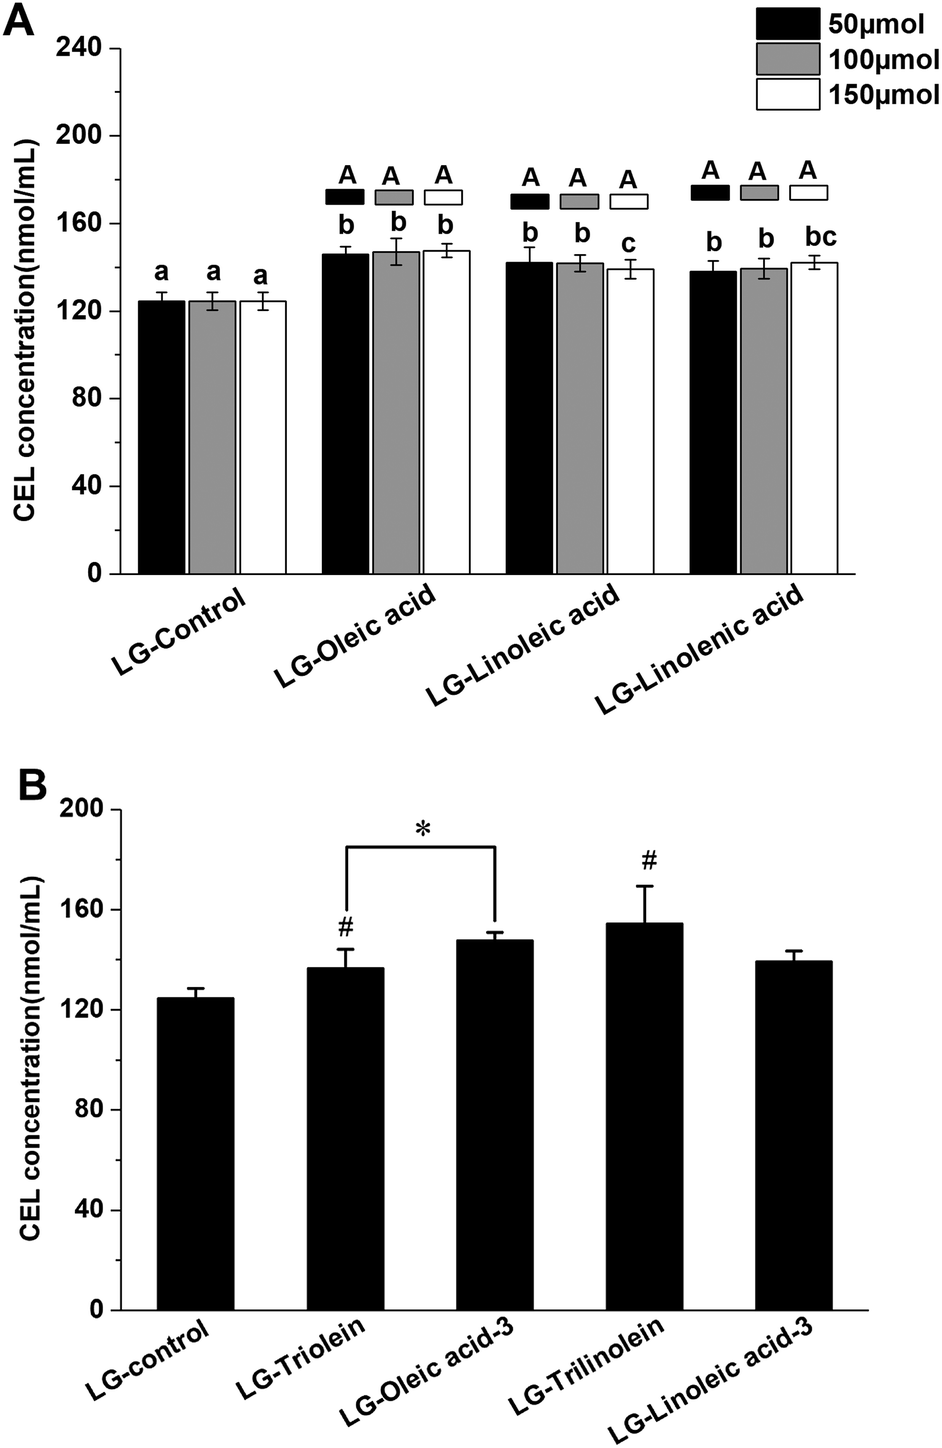 | ||
| Fig. 2 Effects of fatty acids (FAs) and triglycerides (TGs) on the CEL formation in model systems. (A) The effects of different unsaturation degree and concentration of FAs on the CEL formation; (B) the effects of different TGs on the CEL formation; different lowercase letters indicate significant differences (p < 0.05) among different unsaturation degree of FA (same addition level), while different capital letters indicate significant differences (p < 0.05) among different addition levels (same FA). (*) p < 0.05, significantly different between compared samples. (#) p < 0.05, significantly different from LG-control. LG-triolein, model system added with trolein; LG-trilinolein, model systems added with trilinolein. LG-oleic acid-3, model system added with 150 μmol oleic acid; LG-linoleic acid-3, model system added with 150 μmol linoleic acid. | ||
As shown in Fig. 2A the addition of fatty acids promoted CEL formation. This behavior could be due to oxidation of the unsaturated fatty acids, since lipid oxidation is known to facilitate CEL formation.43,44 Evidence that CEL formation might involve oxidative processes comes from the fact that it can be inhibited by compounds with antioxidant activity or free radical scavenging ability.14,28 Therefore, the free radicals derived from lipid oxidation might boost CEL formation. Interestingly, the promoting effects of the lipids was not enhanced with an increase in their unsaturation degree or addition level. This might be because the relatively low level of lysine present in the systems limited the promoting effect. Also, some other reactive aldehydes generated during lipid oxidation, such as acrolein, malondialdehyde and hydroxynonenal, could compete with MGO to react with lysine.14,29 This phenomenon might counteract the promoting effect of lipid oxidation on CEL formation. Similar trends were obtained when triglycerides were added to the model systems as were observed when free fatty acids were added. The addition of the triglycerides significantly enhanced CEL formation but did not depend on the degree of unsaturation (Fig. 2B). These results might therefore be explained by the same mechanisms used to account for the addition of free fatty acids, as described earlier. The impact of the ester form of the fatty acids on CEL formation was also studied. The oleic acid promoted CEL formation more than triolein (Fig. 2B), while linoleic acid and trilinolein had similar effects on CEL formation (Fig. 2B). These phenomena are therefore in line with our results on CML formation.
The statistical correlation analysis showed the LG-control and model systems added with fatty acid showed a positive correlation between the CEL concentration and MGO concentration (r = 0.881, p < 0.01). Similar with the behaviors observed in the CML formation, the model systems added with triglyceride was not match this correlation. These findings indicated that the influence of fatty acids on the CEL formation was attributed to the effect on the MGO formation. Moreover, the CEL concentration in LG-control and model systems added with fatty acid was positively related with the fructoselysine concentration (r = 0.687, p < 0.05). But no available information from previous researches have confirmed that CEL can be generated from fructoselysine directly. There is a correlation between fructoselysine concentration and MGO concentration (r = 0.772, p < 0.01). These results were not surprising as fructoselysine can fragmented into MGO. Taking the above findings together, we found that fatty acid might modulate the conversion of fructoselysine into MGO and then impact the CEL formation.
3.4 Effects of fatty acids and triglycerides on pyrraline formation
The Fig. 3 showed the effects of fatty acids and triglycerides on the pyrraline formation, the pyrraline level of LG-control as 0.58 ± 0.01 nmol mL−1 pyrraline. The pyrraline levels formed were much less than those of the other lysine-derived AGEs (CML and CEL). The addition of the fatty acids strongly enhanced pyrraline generation in model systems (Fig. 3A). Pyrraline can be formed from the reaction between 3-DG and the amino group of lysine.14 Therefore the enhancement effect may be attributed to the acidity of the fatty acids, which is known to favor 3-DG formation during the Maillard reaction, as well as form glucose degradation.45 Meanwhile, the fragmentation of fructoselysine through the 1,2-enaminol rout can be promoted under more acid condition, which would lead to more 3-DG generation.45 It was reported that the acidity of the systems could impact the chemical fate of fructoselysine, which might be responsible for the more pyrraline formation from non-oxidative degradation with addition of fatty acids.23 But it is noteworthy that further study is needed to clarify the involving rationale. The concentration of pyrraline raised up with the increase of fatty acid content, which may have been a result of an increased acidification of the model systems. There was no clear correlation between the unsaturation degree of the fatty acids and the promotion of pyrraline formation.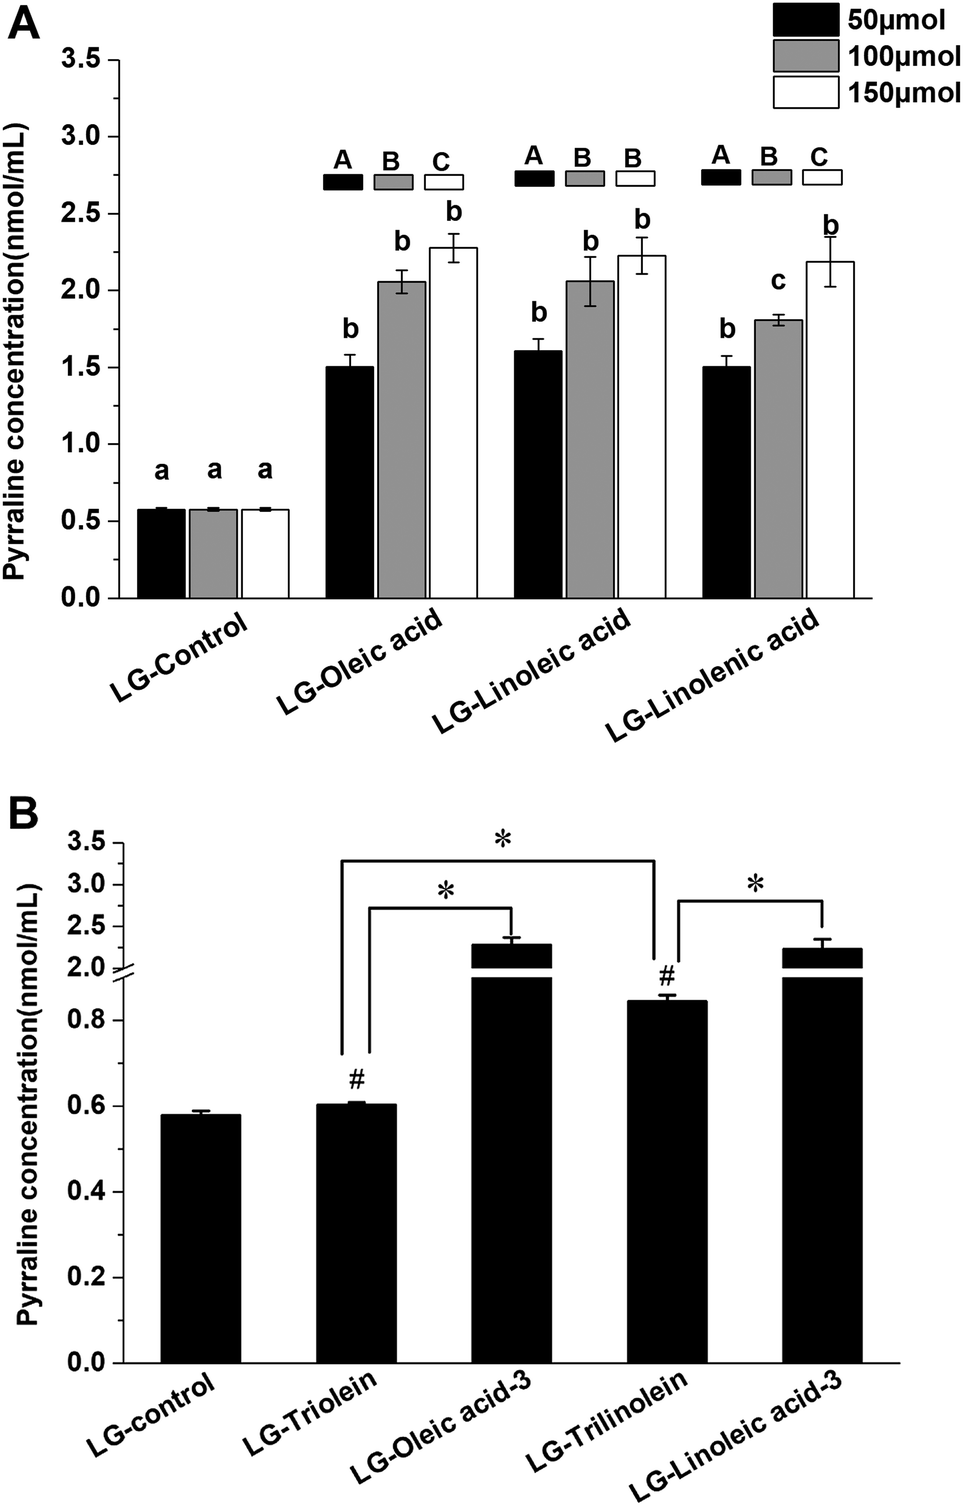 | ||
| Fig. 3 Effects of fatty acids (FAs) and triglycerides (TGs) on the pyrraline formation in model systems. (A) The effects of different unsaturation degree and concentration of FAs on the pyrraline formation; (B) the effects of different TGs on the pyrraline formation. Different lowercase letters indicate significant differences (p < 0.05) among different unsaturation degree of FA (same addition level), while different capital letters indicate significant differences (p < 0.05) among different addition levels (same FA). (*) p < 0.05, significantly different between compared samples. (#) p < 0.05, significantly different from LG-control. LG-triolein, model system added with trolein; LG-trilinolein, model systems added with trilinolein. LG-oleic acid-3, model system added with 150 μmol oleic acid; LG-linoleic acid-3, model system added with 150 μmol linoleic acid. | ||
However, pyrraline formation did increase when the degree of unsaturation of the triglycerides increased in both aqueous systems (Fig. 3B). It indicate that the unsaturation degree of triglycerides significantly affect the pyrrline formation. Thus, the triglycerides that were more susceptible to oxidation appeared to be more effective at promoting pyrraline formation. It can be explained by that the hydrolysis and oxidation of triglycerides under high temperature can release free fatty acids into the model systems. As shown in Fig. 3B, the ester form of the fatty acids also influenced pyrraline formation. Less pyrraline formation occurred in the presence of triglycerides than the equivalent fatty acids. This effect may have been because the triglycerides need to undergo hydrolysis and oxidation to release H+ while free fatty acids possess acidity themselves.
Furthermore, the LG-control and model systems added with fatty acids or triglycerides showed a positive correlation between the pyrraline concentration and fructoselysine concentration (r = 0.791, p < 0.01). It implied that fatty acids and triglycerides can modify the chemical fate of fructoselysine and then favor the formation of pyrraline. It has been reported previously that pyrraline may be eliminated through degradation, polymerization or reacting with other compounds under high temperatures.38 The final pyrraline content observed was therefore a result of both formation and breakdown. However, available data about the effects of lipids on pyrraline formation was scare. Further study need to be conducted to investigate the definite molecular mechanism of the lipid impacting pyrraline formation.
4. Conclusion
The effect of free fatty acids and triglycerides on the formation of CML, CEL and pyrraline under frying temperature was investigated. The concentration, and unsaturation degree and the ester form of the fatty acids play a vital role on lysine-derived AGEs formation. The lipid which is more vulnerable to oxidation had a stronger promotion effect on the lysine-derived AGEs formation. Fatty acids and triglycerides can affect the progress of Maillard reaction and the formation of fructoselysine, GO and MGO, which are important precursors of lysine-derived AGEs. And the effects of unsaturated lipids on lysine-derived AGEs formation were significantly related with their effects on the generation of Amadori product and α-dicarbonyl compounds. The lipids used in the present study were pure free fatty acids and triglycerides, while the lipids used in real food systems commonly contains some other compounds, such as vitamin E, polyphenols and phytosterols. These compounds can impact the oxidative ability of lipids, which then influence AGEs formation during food cooking and processing. Further studies therefore need to be conducted to investigate the effects of these compounds on AGEs generation in model system and real foods.Conflicts of interest
The authors declare no competing financial interest.Acknowledgements
The work was financially supported by the National Key R&D Program of China (No. 2017YFC1600405) and the Natural Science Foundation of Jiangxi Province (No. 20171ACB21015).References
- M. W. Poulsen, R. V. Hedegaard, J. M. Andersen, B. de Courten, S. Bugel, J. Nielsen, L. H. Skibsted and L. O. Dragsted, Food Chem. Toxicol., 2013, 60, 10–37 CrossRef CAS PubMed.
- X. B. Xu, F. Ma, S. J. Yu and Y. G. Guan, J. Dairy Sci., 2013, 96, 5487–5493 CrossRef CAS PubMed.
- Z. Liang, L. Li, H. Qi, Z. X. Zhang and B. Li, J. Food Sci., 2016, 81, C2405–C2424 CrossRef CAS PubMed.
- U. Moeckel, A. Duerasch, A. Weiz, M. Ruck and T. Henle, J. Agric. Food Chem., 2016, 64, 2953–2961 CrossRef CAS PubMed.
- C. Solis-Calero, J. Ortega-Castro, A. Hernandez-Laguna, J. Frau and F. Munoz, Phys. Chem. Chem. Phys., 2015, 17, 8210–8222 RSC.
- N. Rabbani, F. Shaheen, A. Anwar, J. Masania and P. J. Thornalley, Biochem. Soc. Trans., 2014, 42, 511–517 CrossRef CAS PubMed.
- I. Roncero-Ramos, C. Niquet-Leridon, C. Strauch, V. M. Monnier, F. J. Tessier, M. P. Navarro and C. Delgado-Andrade, J. Agric. Food Chem., 2014, 62, 6001–6006 CrossRef CAS PubMed.
- J. Scheijen, N. M. J. Hanssen, M. M. van Greevenbroek, C. J. Van der Kallen, E. J. M. Feskens, C. D. A. Stehouwer and C. G. Schalkwijk, Clin. Nutr., 2018, 37, 919–925 CrossRef CAS PubMed.
- M. Li, M. Zeng, Z. He, Z. Zheng, F. Qin, G. Tao, S. Zhang and J. Chen, J. Agric. Food Chem., 2015, 63, 1658–1663 CrossRef CAS PubMed.
- R. E. Clarke, A. L. Dordevic, S. M. Tan, L. Ryan and M. T. Coughlan, Nutrients, 2016, 8, 125 CrossRef PubMed.
- H. Vlassara and J. Uribarri, Curr. Diabetes Rep., 2014, 14, 453 CrossRef PubMed.
- N. J. Kellow and M. T. Coughlan, Nutr. Rev., 2015, 73, 737–759 CrossRef PubMed.
- Y. Zhu, H. Snooks and S. Sang, J. Agric. Food Chem., 2018, 66, 1325–1329 CrossRef CAS PubMed.
- C. Srey, G. L. Hull, L. Connolly, C. T. Elliott, M. D. del Castillo and J. M. Ames, J. Agric. Food Chem., 2010, 58, 12036–12041 CrossRef CAS PubMed.
- H. T. Nguyen, H. J. van der Fels-Klerx and M. A. van Boekel, Food Chem., 2016, 192, 125–133 CrossRef CAS PubMed.
- T. Baldensperger, T. Jost, A. Zipprich and M. A. Glomb, J. Agric. Food Chem., 2018, 66, 1898–1906 CrossRef CAS PubMed.
- C. Henning and M. A. Glomb, Glycoconjugate J., 2016, 33, 499–512 CrossRef CAS PubMed.
- M. Hellwig, S. Gensberger-Reigl, T. Henle and M. Pischetsrieder, Semin. Cancer Biol., 2018, 49, 1–8 CrossRef CAS PubMed.
- Z. Liang, L. Li, H. Qi, L. Wan, P. Cai, Z. Xu and B. Li, Molecules, 2016, 21, 463 CrossRef PubMed.
- A. D. Troise, A. Fiore, G. Roviello, S. M. Monti and V. Fogliano, Amino Acids, 2015, 47, 111–124 CrossRef CAS PubMed.
- T. M. Masatcioglu, P. K. W. Ng and H. Koksel, J. Cereal Sci., 2014, 60, 276–281 CrossRef CAS.
- H. Li and S. J. Yu, J. Sci. Food Agric., 2018, 98, 3225–3233 CrossRef CAS PubMed.
- N. ALjahdali and F. Carbonero, Crit. Rev. Food Sci. Nutr., 2018, 59, 474–487 CrossRef PubMed.
- S.-J. Cho, G. Roman, F. Yeboah and Y. Konishi, Curr. Med. Chem., 2007, 14, 1653–1671 CrossRef CAS PubMed.
- J. Gobert and M. A. Glomb, J. Agric. Food Chem., 2009, 57, 8591–8597 CrossRef CAS PubMed.
- Y. Jiang, M. Hengel, C. Pan, J. N. Seiber and T. Shibamoto, J. Agric. Food Chem., 2013, 61, 1067–1071 CrossRef CAS PubMed.
- X. Li, T. Zheng, S. Sang and L. Lv, J. Agric. Food Chem., 2014, 62, 12152–12158 CrossRef CAS PubMed.
- P. Yu, X. B. Xu and S. J. Yu, Food Chem., 2017, 221, 1145–1150 CrossRef CAS PubMed.
- L. Maria, S. H. Assar and J. M. Ames, J. Agric. Food Chem., 2010, 58, 1954–1958 CrossRef PubMed.
- L. Han, L. Li, B. Li, D. Zhao, Y. Li, Z. Xu and G. Liu, Food Res. Int., 2013, 51, 836–840 CrossRef CAS.
- L. Han, L. Li, B. Li, D. Zhao, Y. Li, Z. Xu and G. Liu, Food Chem. Toxicol., 2013, 60, 536–541 CrossRef CAS PubMed.
- S. Mildner-Szkudlarz, A. Siger, A. Szwengiel and J. Bajerska, Food Chem., 2015, 172, 78–85 CrossRef CAS PubMed.
- X. Sun, J. Tang, J. Wang, B. A. Rasco, K. Lai and Y. Huang, Journal of Food Measurement and Characterization, 2017, 11, 320–328 CrossRef.
- T. Kocadağlı and V. Gökmen, J. Agric. Food Chem., 2014, 62, 7714–7720 CrossRef PubMed.
- R. Zamora and F. J. Hidalgo, Crit. Rev. Food Sci. Nutr., 2005, 45, 49–59 CrossRef CAS PubMed.
- R. Zamora and F. J. Hidalgo, Lipid Technol., 2011, 23, 59–62 CrossRef CAS.
- M.-J. Oh, Y. Kim, S. H. Lee, K.-W. Lee and H.-Y. Park, Food Chem., 2018, 267, 271–276 CrossRef CAS PubMed.
- Z. Liang, L. Li, Q. Fu, X. Zhang, Z. Xu and B. Li, J. Sci. Food Agric., 2016, 96, 2555–2564 CrossRef CAS PubMed.
- R. Liedke and K. Eichner, in ACS Symposium Series, Washington, DC, America, 2002, ch. 5 Search PubMed.
- C. Perez Locas and V. A. Yaylayan, J. Agric. Food Chem., 2008, 56, 6717–6723 CrossRef PubMed.
- Y. Wang and C.-T. Ho, Chem. Soc. Rev., 2012, 41, 4140–4149 RSC.
- L. Yu, Z. He, M. Zeng, Z. Zheng, J. He, M. Wang and J. Chen, Int. J. Food Sci. Technol., 2016, 51, 742–752 CrossRef CAS.
- L. Yu, Z. He, M. Zeng, Z. Zheng and J. Chen, Radiat. Phys. Chem., 2016, 120, 73–80 CrossRef CAS.
- L. Yu, M. Chai, M. Zeng, Z. He and J. Chen, Food Chem., 2018, 269, 466–472 CrossRef CAS PubMed.
- M. Navarro and F. J. Morales, Food Chem., 2017, 217, 602–609 CrossRef CAS PubMed.
Footnote |
| † Electronic supplementary information (ESI) available. See DOI: 10.1039/c9ra01410a |
| This journal is © The Royal Society of Chemistry 2019 |