 Open Access Article
Sensitive Raman detection of human recombinant interleukin-6 mediated by DCDR/GERS hybrid platforms†
Emmanuel de la O-Cuevas ab,
Isidro Badillo-Ramírezb,
Selene R. Islasb,
C. Araujo-Andradea and
José M. Saniger
 *b
*b
aUnidad Académica de Física de La Universidad Autónoma de Zacatecas, 98068 Zacatecas, Mexico
bInstituto de Ciencias Aplicadas y Tecnología, Universidad Nacional Autónoma de México, Circuito Externo S/N, Cd. Universitaria, 04510 Ciudad de México, Mexico. E-mail: jose.saniger@icat.unam.mx
First published on 17th April 2019
Abstract
Recombinant human interleukin-6 (IL-6) is a key cytokine that plays an important role in the immune system and inflammatory response, explaining why any modification of its concentration in biological fluids is considered a signal of a pathological condition. Therefore, it is important to develop alternative, highly sensitive and reliable analytical methodologies to detect and identify this analyte in biological fluids. Herein, we present a proof of concept for the development of a new analytical hybrid platform for IL-6 detection that is based on the combination of drop-coating deposition Raman (DCDR) spectroscopy and graphene-enhanced Raman spectroscopy (GERS) effects. The sensitivity limits for IL-6 detection were found to be a function of the type of substrate used. When a 1 μL droplet of IL-6 solution is deposited and dried on an Si substrate, a DCDR effect occurs, and a detection limit below 1 ng mL−1 is obtained; however, when the same is performed using a hybrid substrate of reduced graphene oxide and silicon (rGO/Si), the joint action of DCDR and GERS effects results in a detection limit well below 1 pg mL−1. It is important to note that this result implies the absolute mass detection of 1 fg of IL-6. In summary, the Raman spectroscopy DCDR/GERS analytical platform proposed here allows the reliable identification of, as well as the very sensitive detection of, IL-6 and promises to improve the performance of clinical evaluations of this biomarker that are currently in use. In this study, the Raman spectra of IL-6 in powder and solution, together with the corresponding band assignment, are presented for the first time in the literature.
Introduction
Interleukin-6 (IL-6) is a multi-functional protein that belongs to the cytokine family. IL-6 is well known for its role in the immunological system and inflammatory response, but it also plays critical roles in major physiological systems, including the nervous system. Some diseases associated with increased levels of IL-6 in biological fluid include diabetes, atherosclerosis, depression, Alzheimer's disease, systemic lupus erythaematous, multiple myeloma, prostate cancer, Behçet's disease, and rheumatoid arthritis.1,2Presently, enzyme-linked immunosorbent assay (ELISA) is the main procedure used to detect human recombinant IL-6 in serum/plasma. Commercial IL-6 kits claim a sensitivity of 1 pg mL−1.3 Alternative to the ELISA test, in recent years several sensors and biosensors have been developed for the detection of this cytokine such as fluorescent microarrays,4 electrochemical and photoelectrochemical immunoassay,5–7 and surface plasmon resonance8,9 With these strategies a limit of detection close to the ELISA lower limit is reached, however, the assembly of the devices is time consuming and requires sophisticated experimental steps. Nevertheless, due to the importance of IL-6 as a biological marker in metabolic diseases and neurological processes, it is of great interest to develop alternative identification and detection methods that will represent comparative advantages over the well-established ELISA procedure. Raman spectroscopy in combination with surface enhancement methods of biomolecular spectroscopic responses might be adequate analytical approaches to achieve this goal.
Raman spectroscopy is a well-suited technique to study biomolecules such as proteins. This technique provides extensive information about their conformational structural changes induced by microenvironment conditions, giving a fast response and using a non-destructive analysis.10,11 However, it has limited performance in identifying proteins in solutions typically lower than 1 mM. To overcome this limitation, different strategies have been developed. Surface-enhanced Raman scattering (SERS) is by far the most used strategy due to its capability to amplify the Raman signals by factors ranging from 102 to 106, and even 1012 in the most favourable conditions.12,13 SERS enhances the Raman scattering of adsorbed molecules into noble metal nanoparticle substrates by exploiting the increased effective electromagnetic field occurring in the vicinity of these metal nanoparticles.
Following SERS approaches, Wang and co-workers have reported two strategies for the detection of IL-6 through the employment of gold/silver nanoshells with optimized plasmon resonance, allowing to detect IL-6 with femtogram sensitivity.14,15 However, these strategies are time consuming and involve complex nano-manufacturing procedures, in order to obtain reproducible results. Additionally, SERS has some practical limitations, such as those related to the difficulty in preparing substrates with reproducible amplification factors, the deformation of spectral profiles of molecules adsorbed on the metal nanoparticles, and the molecular instability induced by local enhancement of the electromagnetic field.16 These aforementioned drawbacks justify the search for alternative approaches with the ability to increase the Raman signal while avoiding the SERS limitations.
In recent years, drop-coating deposition Raman (DCDR) spectroscopy became an interesting and simple method to increase the effective sensitivity of the Raman response in the detection of biomolecules at low concentrations (<0.1 mM)17,18 DCDR is based on the placement and subsequent drying process of a small drop of a sample solution on the surface of a suitable substrate. The drying process occurs through radial capillary flow that carries the dissolved or dispersed molecules to the outer edge of the initial droplet, forming an external ring where the sample is concentrated.19 Thus, the Raman spectra collected from this ring shows an important increase in the band intensities compared with the conventional spectra obtained from the non-dried drop solution. Substrates with different degrees of hydrophobicity, such as a polished metallic surface, CaF2, and Teflon, are frequently used for DCDR.17 The significant amplification factors obtained using this approach (102 to 103), together with the relative simplicity of the method and preservation of the spectral profiles of the samples, are some reasons why DCDR is becoming widely used to study biomolecules.18
Another attractive approach for Raman signal amplification is graphene-enhanced Raman scattering (GERS), which is based on using graphenic material substrates such as pristine graphene (G), graphene oxide (GO) or reduced graphene oxide (rGO) as surface enhancers.19,20 In GERS, the graphenic material is placed on a solid substrate, such as Si or Si/SiO2, and then the solution with the sample of interest is adsorbed onto the prepared graphenic substrate. The interaction between the sample and the graphenic sheets frequently results in the amplification of the Raman scattering of the adsorbed molecule, through a chemical effect resulting in increased effective polarization of the adsorbed molecule. Both the aromatic molecular groups of the molecules interacting with GO or rGO sp2 carbon atoms, through π–π interactions, as well as the polar interactions among oxygenated functional groups, should be responsible for the changes in the system's polarization.21–23 Although the GERS enhancement factor is frequently relatively low (approximately 102), in some cases, detection limits of approximately 10−8 to 10−10 M have been reported for dyes with strong π–π interactions with graphene.24 Considering that graphenic substrates have several important practical advantages, such as substrate uniformity and reproducibility, cleanliness, low or null spectral deformation, and the preservation of the molecule stability, GERS has become an important alternative to detect biomolecules.25,26
Taking advantage of these features, GERS biosensing has been used in the recent years to detect various target biomolecules related to the diagnosis of diseases, as well as in cell imaging.27 GERS immunoassays have been performed using hybrid materials based on noble metal, metal oxides, and graphenic substrates. In recent reports, Bagheri and co-workers developed Co3O4–G-modified carbon paste electrodes for selective detection of atropine in biological fluids.28 In addition, Yoon and co-workers employed a non-covalently functionalized GO sheet on a patterned Au surface to isolate circulating tumor cells from blood samples of pancreatic, breast, and lung cancer patients.29
In this study, we present an easy methodology, combining both DCDR and GERS amplification approaches for the highly sensitive detection of human recombinant IL-6 at a very low concentration. The presence of IL-6 was easily detected when a drop of a 1 μL solution with an initial concentration of 1 pg mL−1 was deposited and allowed to dry onto a hybrid substrate of rGO/Si. Under these experimental conditions, it can be stated that the absolute mass detection of IL-6 was lower than 1 fg (around 10−19 mol).
Experimental
Materials
Lyophilized interleukin-6, sodium citrate, and phosphate-buffered solution (PBS; 0.1 M) were purchased from Sigma-Aldrich (St. Louis, Missouri, USA). Graphene oxide in water dispersion a concentration of 4 mg mL−1 was purchased from Graphenea (San Sebastian, Spain).Synthesis of reduced graphene oxide (rGO)
Reduced graphene oxide (rGO) was prepared from a commercial GO dispersion using sodium citrate as the reducing agent under reflux, following the method of Z. Zhang et al.30 Briefly, 25 mL of GO dispersion (0.1 mg mL−1) was mixed with sodium citrate (30 mg) at room temperature, and then the solution was maintained in reflux at 80 °C under stirring for 3 hours, resulting in a colour change of the solution from brown to dark. After the reduction, the rGO sheets were separated by centrifugation at 14![[thin space (1/6-em)]](https://www.rsc.org/images/entities/char_2009.gif) 000 rpm and washed three times with deionized water to remove excess citrate. Finally, the 0.1 mg mL−1 rGO dispersion was stored for further use. The synthesis of rGO was confirmed by Raman, FTIR and UV-Vis spectroscopies (see Fig. S1 to S3 in ESI†).
000 rpm and washed three times with deionized water to remove excess citrate. Finally, the 0.1 mg mL−1 rGO dispersion was stored for further use. The synthesis of rGO was confirmed by Raman, FTIR and UV-Vis spectroscopies (see Fig. S1 to S3 in ESI†).
Preparation of rGO films
Silicon (Si) wafer was used as a substrate for the deposition of rGO thin films. The rGO films were grown onto Si by immersing a small piece of Si wafer for 1 hour in 4 mL of the prepared rGO dispersion. The rGO/Si substrate was finally dried at room temperature and stored in a desiccator until use. The deposition of rGO onto the Si substrate was confirmed by Raman (see Fig. S1 in ESI†).Deposition of IL-6 solutions
IL-6 solutions were prepared by dissolving 10 μg of powdered IL-6 in 10 mL of PBS buffer solution (0.1 M; pH 7.5, 25 °C). This stock solution was then used to prepare three different IL-6/PBS solutions with concentrations of 1 μg mL−1, 1 ng mL−1 and 1 pg mL−1, which were used for the detection tests. One droplet of 1 μL for each IL-6/PBS solution was drop coated onto both Si and rGO/Si substrates and was dried in a desiccator for 40 min.Raman measurements
Raman spectra were recorded using a WITec Alpha 300 Series Raman-AFM (WITec GmbH, Ulm, Germany) and 672-lines per mm grating with a 100× Zeiss objective (0.9 NA). An Nd:YVO4 green laser with a wavelength of 532 nm was used as an excitation source with 3.56 mW of laser power. Punctual Raman spectra, with 4 s of integration time and 20 accumulations, were acquired in the “coffee ring” formed for each drop coated on the corresponding Si or rGO/Si substrate. The sample was focused using the oscilloscope mode until a proper signal was achieved, and then 12 spectra were acquired at different points and averaged.Pre-processing spectra and data analysis
Each collected Raman spectrum was cosmic ray removed, baseline corrected and averaged. To observe the amplification effect of the Raman signal for each substrate, a numerical comparison of the relative intensities between different chosen bands was made; spectral normalization was previously performed for this comparison.Results
Powdered IL-6 Raman spectrum
Human interleukin-6 is a multifunctional protein with a molecular weight of 21 kDa with α-helical conformation consisting of 184 amino acids with two potential sites of N-glycosylation and four cysteine residues. The IL-6 amino acid sequence is as follow:31| MNSFSTSAFGPVAFSLGLLLVLPAAFPAPVPPGEDSKDVAAPHRQPLTSSERIDKQIRYILDGISALRKETCNKSNMCESSKEALAENNLNLPKMAEKDGCFQSGFNEETCLVKIITGLLEFEVYLEYLQNRFESSEEQARAVQMSTKVLIQFLQKKAKNLDAITTPDPTTNASLLTKLQAQNQWLQDMTTHLILRSFKEFLQSSLRALRQM |
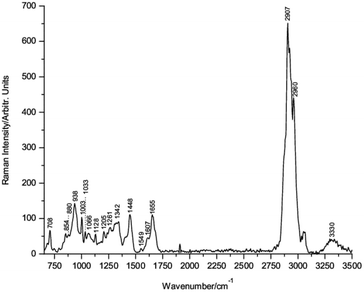
To the best of our knowledge, the single Raman spectrum of IL-6 has not been published previously in the scientific literature. Fig. 1 shows the Raman spectrum of powdered lyophilized IL-6 mounted onto the pure Si substrate. The corresponding wavenumber positions of the main bands are indicated in the figure.
The band assignment of IL-6 was made following the well-established criteria for the assignment of protein bands,23–31 and the detailed assignment is presented in Table 1. The Raman spectrum of IL-6 shows bands at 938, 1261 and 1655 cm−1 due to the C–C stretching of the backbone structure, amide III and amide I, respectively, corresponding to the typical α-helix secondary structure conformation of IL-6.
| Wavenumber (cm−1) | Band assignment |
|---|---|
| 708 | C–S stretching vibration of cysteine residues32 |
| 854 | Tyrosine, ring breathing vibration32–35 |
| 880 | Tryptophan, bending ring33,35,37 |
| 938 | C–C stretching backbone for α-helix conformation32,33,36,37 |
| 1003 | Phenylalanine, ring breathing vibration32,33,35–37 |
| 1033 | C–H in-plane bending mode of phenylalanine33–35,40 |
| 1066 | C–C skeletal stretching for random secondary conformation33,35,37,40 |
| 1128 | C–N stretching33–35,40 |
| 1205 | Ring deformation of tyrosine and phenylalanine33,35,37,40 |
| 1261 | Amide III with α-helix conformation, involves C–N stretching, N–H in-plane bending vibration of the peptide bond and contributions from Cα–C stretching and C![[double bond, length as m-dash]](https://www.rsc.org/images/entities/char_e001.gif) O in-plane bending modes32,33,36,37 O in-plane bending modes32,33,36,37 |
| 1342 | Cα–H deformation33,36,37 |
| 1448 | CH2 and CH3 bending vibrations32,33,38,39 |
| 1549 | Amide II vibration: N–H in-plane bending and C–N stretching of the trans peptide group32–34,38 |
| 1607 | Aromatic ring vibration of tyrosine and phenylalanine33,34,37 |
| 1655 | Amide I with α-helix conformation; C![[double bond, length as m-dash]](https://www.rsc.org/images/entities/char_e001.gif) O stretching mode, C–N stretching, Cα–C–N bending and N–H in-plane bending of peptide groups32–36,38 O stretching mode, C–N stretching, Cα–C–N bending and N–H in-plane bending of peptide groups32–36,38 |
| 2907 | Aliphatic C–H stretching33,38,40 |
| 2960 | Symmetric and asymmetric C–H stretching modes33,38,40 |
| 3330 | N–H symmetric stretching33,38,40 |
In addition, conventional residues of amino acids, such as the band at 708 cm−1, indicates the C–S stretching of cysteine residues in the IL-6 structure (see Fig. S4; ESI†). Therefore, the conformational structure of IL-6 was corroborated using Raman spectroscopy.41
Enhancing the Raman detection sensitivity of IL-6
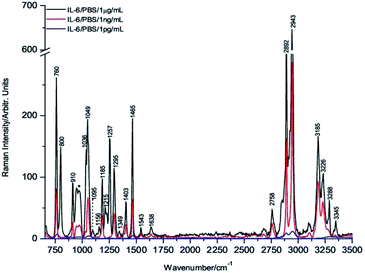
Fig. 2 shows the comparative averaged Raman spectrum of each drop at three different concentrations. It is important to highlight that the Raman bands are sharper and better resolved than those of the powdered sample (Fig. 1), indicating that IL-6 in the coffee ring has a solution-like spectral shape, which is a well-established characteristic of biomolecules present in these rings.42,43
The decrease in the Raman band intensity as a function of the concentration of the IL-6 solution droplet is evident from Fig. 2.
However, to obtain a numerical value of the band intensity reduction for each concentration, a comparison of the intensities is shown in Table 2. Knowing that the relative decrease of the IL-6 solution concentration is three orders of magnitude for the 1 ng mL−1 sample and six orders of magnitude for the 1 pg mL−1 sample, the corresponding spectral band intensities should be reduced in a similar proportion. However, the actual decrease in the intensities for the samples of 1 ng mL−1 and 1 pg mL−1 is approximately 3 and 44-fold, respectively (see Tables 2 and 3), indicating that enhancement of the sensitivity associated with the DCDR process occurs.
| Concentration of IL-6 solution | I760 | I1049 | I1403 | I1465 | I2943 |
|---|---|---|---|---|---|
| 1 μg mL−1 | 261.34 | 193.94 | 59.98 | 195.27 | 647.74 |
| 1 ng mL−1 | 80.53 | 66.76 | 22.83 | 63.99 | 287.63 |
| 1 pg mL−1 | 7.21 | 4.62 | 1.15 | 5.25 | 12.7 |
| Bands intensities ratio | I760/I760 | I1049/I1049 | I1403/I1403 | I1465/I1465 | I2943/I2943 | Average ratio |
|---|---|---|---|---|---|---|
| 1 μg ml−1/1 ng ml−1 | 3.25 | 2.91 | 2.63 | 3.05 | 2.26 | 2.82 ± 0.38 |
| 1 ng ml−1/1 pg ml−1 | 11.17 | 14.45 | 19.85 | 12.19 | 22.65 | 16.06 ± 4.98 |
| 1 μg ml−1/1 pg ml−1 | 36.25 | 41.98 | 52.15 | 37.19 | 51.00 | 43.71 ± 7.51 |
Nevertheless, from direct observation of the spectrum intensity in Fig. 2, it could be established that under the present condition, the DCDR Raman signal enhancement is not sufficient to detect 1 pg mL−1 of IL-6 solution, which is the claimed ELISA test detection limit. Therefore, additional improvements in the Raman detection limit of IL-6 solutions is required to overcome this situation.
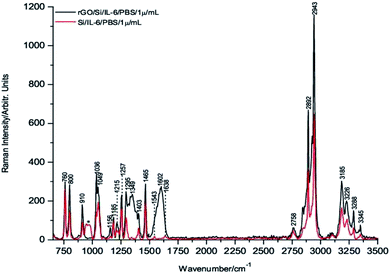
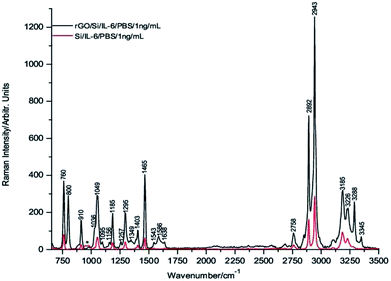
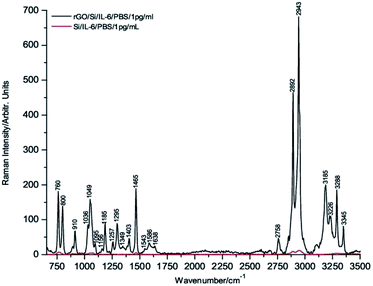
To carry out these tests, 1 μL drops of 1 μg mL−1, 1 ng mL−1 and 1 pg mL−1 of IL-6 in PBS solution were deposited onto the rGO/Si substrates and dried under room temperature conditions before their Raman spectra were recorded. Fig. 3 through Fig. 5 show the spectra of these samples. For comparative purposes, the corresponding DCDR spectra of the equivalent samples deposited on Si substrates are plotted together.
The incipient enhancement of the intensity of the 1 μg mL−1 IL-6 sample deposited on the hybrid rGO/Si substrate is observed in Fig. 3, but the signal amplification becomes much stronger for the samples with a concentration of 1 ng mL−1 and 1 pg mL−1 (Fig. 4 and 5). This result is consistent with the existence of additional Raman signal amplification of the IL-6 solutions when they are deposited onto the hybrid rGO/Si substrates, which would be associated with GERS phenomena48–50
Interestingly, GERS amplification for biomolecules have been described mainly for aromatic amino acids and polypeptides, where the rGO Raman enhancement was related to the interactions of both aromatic π–π stacking and the local electric field from the remaining oxygenated groups on the rGO sheet.23–27 Coincidentally, in our case, IL-6 presents aromatic domains and basic amino acid residues that would favor a strong adsorption to the surface of the RGO sheet. Therefore, it would seem reasonable to assume that these interactions would be responsible for the occurrence of the GERS phenomenon. However, a deep study about the physicochemical interactions involved in the GERS enhancement is out of the scope of this work.
Comparing the Raman relative intensities in Fig. 3–5, it is clear that the Raman signal enhancement on the hybrid substrates is concentration dependent. This trend presented in Table 4 where the average of the GERS signal enhancement is calculated as a function of the IL-6 concentrations.
| Concentration of IL-6 | I760 | I1049 | I1403 | I1465 | I2943 |
|---|---|---|---|---|---|
| 1 μg mL−1 | |||||
| Si | 261.34 | 98.88 | 115.37 | 195.27 | 647.74 |
| rGO | 299.48 | 272.06 | 137.23 | 289.64 | 1159.36 |
| Band intensity ratio (rGO/Si) | 1.14 | 2.75 | 1.18 | 1.48 | 1.79 |
| Average band intensity ratio 1.67 ± 0.66 | |||||
![[thin space (1/6-em)]](https://www.rsc.org/images/entities/char_2009.gif) |
|||||
| 1 ng mL−1 | |||||
| Si | 80.53 | 66.76 | 22.83 | 63.69 | 287.63 |
| rGO | 369.85 | 292.59 | 103.91 | 404.95 | 1258.67 |
| Band intensity ratio (rGO/Si) | 4.59 | 4.38 | 4.55 | 6.35 | 4.38 |
| Average band intensity ratio 4.85 ± 0.84 | |||||
![[thin space (1/6-em)]](https://www.rsc.org/images/entities/char_2009.gif) |
|||||
| 1 pg mL−1 | |||||
| Si | 7.21 | 4.62 | 1.15 | 5.25 | 12.70 |
| rGO | 181.35 | 158.65 | 46.47 | 189.38 | 683.09 |
| Band intensity ratio (rGO/Si) | 25.15 | 34.33 | 40.41 | 36.07 | 53.79 |
| Average band intensity ratio 37.95 ± 10.46 | |||||
Furthermore, the relatively high intensities of the Raman spectrum bands in Fig. 5 make it possible to assert that IL-6 is clearly detectable at concentrations of 1 pg mL−1 and even at slightly lower concentrations. In addition, is important to note that the absolute mass of IL-6 detected in the present experimental conditions is 1 fg because this is precisely the mass present in 1 μL of a solution of 1 pg mL−1.
At this point, it is important to note that the normal IL-6 concentration in healthy people is in the 1 pg mL−1 range, while the median of the reported IL-6 serum levels in cancer patients is 6.95 pg mL−1 (range: 0.2–78.5 pg mL−1).51,52
In summary, the detection limit obtained using rGO/Si substrates is adequate for the clinical diagnosis of pathological conditions. Moreover, our DCDR/GERS hybrid platform shows higher detection limit that the ELISA test and their performance is similar, and even better, that others systems developed following SERS strategies.14,15 In advantage to SERS, our hybrid substrate is of easy fabrication; does not require any type of functionalization; and provides a label-free response and undisturbed Raman band spectra. In our opinion, all these features make this experimental arrangement a good prospect for clinical use.
Conclusions
Hybrid rGO/Si substrates show good performance for the detection and identification of IL-6 samples in PBS solution, reaching detection limits below 1 pg mL−1. An absolute mass as low as 1 fg of IL-6 was detected under the present experimental conditions.This high sensitivity results from the combination of DCDR and GERS effects. The sharp and well-resolved Raman bands of samples deposited on Si and rGO/Si substrates indicate that IL-6, in both cases, is in a solution-like state.
Similar spectral profiles were observed for IL-6 in the form of powder or solution deposited onto both substrate types. Consequently, the DCDR/GERS-mediated Raman spectroscopy platforms proposed in this work allow for the reliable identification, as well as very sensitive detection, of IL-6.
The Raman spectrum of powdered human recombinant IL-6, with its corresponding band assignments, is presented for the first time.
Conflicts of interest
There are no conflicts of interest to declare.Acknowledgements
Authors thank to the support of the project DGAPA IN-111216 and CONACYT FC-2016-2014. EOC and IBR thanks to the CONACYT grants: 619615 and 599497, respectively. Authors thank to the Laboratorio Universitario de Caracterización Espectroscópica, LUCE-ICAT-UNAM for access to the spectroscopic characterization techniques.Notes and references
- G. Cem, Arthritis Res. Ther., 2006, 8(2), S3 Search PubMed.
- M. Erta, A. Quintana and J. Hidalgo, Int. J. Biol. Sci., 2012, 8(9), 1254 CrossRef CAS PubMed.
- K. Zhang, G. Liu and E. M. Goldys, Biosens. Bioelectron., 2018, 102, 80–86 CrossRef CAS PubMed.
- H. Wu, Q. S. Huo, S. Varnum, J. Wang, G. D. Liu, Z. M. Nie, J. Liu and Y. H. Lin, Analyst, 2008, 133, 1550–1555 RSC.
- G. F. Wang, H. Huang, G. Zhang, X. J. Zhang, B. Fang and L. Wang, Langmuir, 2011, 27, 1224–1231 CrossRef CAS PubMed.
- N. P. Sardesai, K. Kadimisetty, R. Faria and J. F. Rusling, Anal. Bioanal. Chem., 2013, 405, 3831–3838 CrossRef CAS PubMed.
- G. C. Fan, X. L. Ren, C. Zhu, J. R. Zhang and J. J. Zhu, Biosens. Bioelectron., 2014, 59, 45–53 CrossRef CAS PubMed.
- B. Zhang, J. Price, G. Hong, S. M. Tabakman, H. Wang, J. A. Jarrell, J. Feng, P. J. Ultz and H. Dai, Nano Res., 2013, 6, 113–120 CrossRef CAS.
- P. Chen, M. T. Chung, W. McHugh, R. Nidetz, Y. Li, J. Fu, T. T. Cornell, T. P. Shanley and K. Kurabayashi, ACS Nano, 2015, 9, 4173–4181 CrossRef CAS PubMed.
- Y. Adigüzel, P. I. Haris and F. Severcan, in Vibrational spectroscopy in diagnosis and screening, ed. P. I. Haris and F. Servecan, IOS Press, USA, 2012, vol. 6, pp. 53–108 Search PubMed.
- S. Rivas-Arancibia, E. Rodríguez-Martínez, I. Badillo-Ramírez, U. López-González and J. M. Saniger, Front. Mol. Neurosci., 2017,(10), 1–11 CAS.
- R. Aroca, Surface-enhanced vibrational spectroscopy, John Wiley & Sons, England, 2006, pp. 73–101 Search PubMed.
- P. G. Etchegoin and E. C. Le Ru, in Surface enhanced Raman spectroscopy: analytical, biophysical and life science applications, eds. S. Schücker, Wiley-VCH, Weinheim, 2011, pp. 87–101 Search PubMed.
- Y. Wang, M. Salehi, M. Schütz, K. Rudi and S. Schlücker, Analyst, 2013, 138(6), 1764–1771 RSC.
- Y. Wang, M. Salehi, M. Schütz and S. Schlücker, Chem. Commun., 2014, 21(50), 2711–2714 RSC.
- W. Xu, X. Ling, J. Xiao, M. S. Dresselhaus, J. Kong, H. Xu and J. Zhang, Proc. Natl. Acad. Sci. U. S. A., 2012, 109(24), 9281–9286 CrossRef CAS PubMed.
- P. Šimáková, E. Kočišová and M. Procházka, J. Raman Spectrosc., 2013, 44(11), 1479–1482 CrossRef.
- J. Filik and N. Stone, Analyst, 2007, 132(6), 544–550 RSC.
- R. D. Deegan, O. Bakajin, T. F. Dupont, G. Huber, S. R. Nagel and T. A. Witten, Nature, 1997, 389(6653), 827 CrossRef CAS.
- X. Ling, L. Xie, Y. Fang, H. Xu, H. Zhang, J. Kong, M. S. Dresselhaus, J. Zhang and Z. Liu, Nano Lett., 2009, 10(2), 553–561 CrossRef PubMed.
- X. Ling, J. Wu, L. Xie and J. Zhang, J. Phys. Chem. C, 2013, 117(5), 2369–2376 CrossRef CAS.
- T. Tite, V. Barnier, C. Donnet, A. S. Loir, S. Reynaud, J. Y. Michalon and F. Garrelie, Thin Solid Films, 2016, 604, 74–80 CrossRef CAS.
- X. Yu, H. Cai, W. Zhang, X. Li, N. Pan, Y. Luo and J. G. Hou, ACS Nano, 2011, 5(2), 952–958 CrossRef CAS PubMed.
- M. Begliarbekov, O. Sul, J. Santanello, N. Ai, X. Zhang, E. H. Yang and S. Strauf, Nano Lett., 2011, 11(3), 1254–1258 CrossRef CAS PubMed.
- W. Xu, N. Mao and J. Zhang, Small, 2013, 9(8), 1206–1224 CrossRef CAS PubMed.
- V. Georgakilas, J. N. Tiwari, K. C. Kemp, J. A. Perman, A. B. Bourlinos, K. S. Kim and R. Zboril, Chem. Rev., 2016, 116(9), 5464–5519 CrossRef CAS PubMed.
- K. P. Loh and C. T. Lim, Nanoscale, 2016, 8(17), 9425–9441 RSC.
- H. Bagheri, S. M. Arab, H. Khoshsafar and A. Afkhami, J. Chem., 2015, 39, 3875–3881 CAS.
- H. J. Yoon, T. H. Kim, Z. Zhang, E. Azizi, T. M. Pham, C. Paoletti, J. Lin, N. Ramnath, M. S. Wicha, D. F. Hayes, D. M. Simeone and S. Nagrath, Nat. Nanotechnol., 2013, 8, 735–741 CrossRef CAS PubMed.
- Z. Zhang, H. Chen, C. Xing, M. Guo, F. Xu, X. Wang and J. Tang, Nano Res., 2011, 4(6), 599–611 CrossRef CAS.
- R. J. Simpson, A. Hammacher, D. K. Smith, J. M. Matthews and L. D. Ward, Protein Sci., 1997, 6(5), 929–955 CrossRef CAS PubMed.
- A. M. Herrero, Crit. Rev. Food Sci. Nutr., 2008, 48(6), 512–523 CrossRef CAS PubMed.
- A. C. S. Talari, Z. Movasaghi, S. Rehman and I. U. Rehman, Appl. Spectrosc. Rev., 2015, 50(1), 46–111 CrossRef CAS.
- A. Rygula, K. Majzner, K. M. Marzec, A. Kaczor, M. Pilarczyk and M. Baranska, J. Raman Spectrosc., 2013, 44(8), 1061–1076 CrossRef CAS.
- F. S. Parker, Applications of infrared, Raman, and resonance Raman spectroscopy in biochemistry, Springer Science & Business Media, New York, 1983, pp. 83–153 Search PubMed.
- N. C. Maiti, M. M. Apetri, M. G. Zagorski, P. R. Carey and V. E. Anderson, J. Am. Chem. Soc., 2004, 126(8), 2399–2408 CrossRef CAS PubMed.
- D. Nemecek, J. Stepanek and G. J. Thomas, Curr. Protoc. Protein Sci., 2013, 71(1), 17–18 Search PubMed.
- R. P. Kengne-Momo, P. Daniel, F. Lagarde, Y. L. Jeyachandran, J. F. Pilard, M. J. Durand-Thouand and G. Thouand, Int. J. Spectrosc., 2012, 2012, 462901 Search PubMed.
- G. S. Mandair and M. D. Morris, BoneKEy Rep., 2015, 4, 620 CAS.
- G. Penel, C. Delfosse, M. Descamps and G. Leroy, Bone, 2005, 36(5), 893–901 CrossRef CAS PubMed.
- A. S. R. Anthony, R. Bradley, Y. Valasatava, J. M. Duarte, A. Prlić and P. W. Rose, Bioinformatics, 2018, 34(21), 3755–3758 CrossRef PubMed.
- V. KopeckýJr and V. Baumruk, Vib. Spectrosc., 2006, 42(2), 184–187 CrossRef.
- P. Šimáková, E. Kočišová and M. Procházka, J. Raman Spectrosc., 2013, 44(11), 1476–1482 CrossRef.
- X. Liu, L. Cao, W. Song, K. Ai and L. Lu, ACS Appl. Mater. Interfaces, 2011, 3(8), 2944–2952 CrossRef CAS PubMed.
- F. Lu, S. Zhang, H. Gao, H. Jia and L. Zheng, ACS Appl. Mater. Interfaces, 2012, 4(6), 3278–3284 CrossRef CAS PubMed.
- S. K. Lim, P. Chen, F. L. Lee, S. Moochhala and B. Liedberg, Anal. Chem., 2015, 87(18), 9408–9412 CrossRef CAS PubMed.
- S. Li, A. N. Aphale, I. G. Macwan, P. K. Patra, W. G. Gonzalez, J. Miksovska and R. M. Leblanc, ACS Appl. Mater. Interfaces, 2012, 4(12), 7069–7075 CrossRef CAS PubMed.
- L. Dolgov, D. Pidhirnyi, G. Dovbeshko, T. Lebedieva, V. Kiisk, S. Heinsalu and I. Sildos, Nanoscale Res. Lett., 2016, 11(1), 197 CrossRef PubMed.
- O. Fesenko, G. Dovbeshko, A. Dementjev, R. Karpicz, T. Kaplas and Y. Svirko, Nanoscale Res. Lett., 2015, 10(1), 163 CrossRef PubMed.
- H. Yang, H. Hu, Z. Ni, C. K. Poh, C. Cong, J. Lin and T. Yu, Carbon, 2013, 62, 422–429 CrossRef CAS.
- B. E. Lippitz and R. A. Harris, OncoImmunology, 2016, 5(5), e1093722 CrossRef PubMed.
- X. Yao, J. Huang, H. Zhong, N. Shen, R. Faggioni, M. Fung and Y. Yao, Pharmacol. Ther., 2014, 141(2), 125–139 CrossRef CAS PubMed.
Footnote |
| † Electronic supplementary information (ESI) available. See DOI: 10.1039/c9ra01396b |
| This journal is © The Royal Society of Chemistry 2019 |

