DOI:
10.1039/C9RA01317B
(Paper)
RSC Adv., 2019,
9, 15648-15656
Development of specific L-methionine sensors by FRET-based protein engineering†
Received
21st February 2019
, Accepted 9th May 2019
First published on 20th May 2019
Abstract
Amino acids are essential nutrients that are not only used as protein building blocks but are also involved in various biochemical processes and in the development of human diseases. Quantitative analysis of amino acids in complex biological samples is an important analytical process used for understanding amino acid biochemistry and diagnosis of human diseases. In this study, a protein sensor based on fluorescence resonance energy transfer (FRET) was designed for the quantitative analysis of L-Met, in which a fluorescent unnatural amino acid (CouA) and YFP were used as a FRET pair. A natural Met-binding protein (MetQ) was chosen as a sensor protein, and CouA and YFP were incorporated into the protein by genetic code expansion technology and genetic fusion. Among the four sites screened for CouA incorporation into MetQ, R189 was selected as the best site for L-Met sensing. The sensor protein (YFP-MetQ-R189CouA) showed a large FRET signal change (2.7-fold increase) upon L-Met binding. To improve amino acid specificity of the sensor protein, the ligand-binding site was engineered, and the mutant sensor (YFP-MetQ-R189CouA-H88F) with the H88F mutation was identified, which showed no FRET signal change with D-Met and L-Gln at 50 μM concentration and retained the maximum FRET signal change with L-Met. The optimized sensor protein was evaluated for biochemical applications. L-Met concentration in FBS and optical purity in a mixture of D- and L-Met were successfully determined. Because L-Met is biochemically important owing to its involvement in cancer cell growth and autophagy, the sensor protein would be useful for quantitative analysis of L-Met in a complex biological sample. In addition, the design strategy used in this study can be applied to other small molecule-binding proteins for the development of protein sensors for important biomolecules.
1. Introduction
Amino acids (AAs) are the building blocks of proteins and essential nutrients for all living organisms. They are also engaged in the synthesis of important biomolecules involved in cellular homeostasis1,2 and are associated with human diseases such as Alzheimer's disease and diabetes.3,4 Owing to their biochemical importance, much effort has been made for the analysis of AAs.5–15 The most common analytical method is liquid chromatography coupled with chemical modification of AAs or mass spectrometry.5–8 Alternatively, chemical and protein sensors based on UV/vis or fluorescence spectroscopy have been developed for AA analysis.9–16 Recently, array-based sensing has been developed for analyzing AAs, in which a series of sensors are used in combination with chemometric techniques such as principal components analysis (PCA) and linear discriminant analysis (LDA).11–16 Although they are useful, these methods have drawbacks of high cost, poor chemoselectivity of each AA, and incompatibility with biological samples and require multiple sensors, AA modification, and time-consuming processes. Additionally, a method which allows chemo- and stereo-specific detection of AAs is rare.
L-Methionine (L-Met) is an essential AA containing a thioether group. Although it is not involved in catalysis in proteins, L-Met is a precursor for biosynthesis of the cofactor S-adenosylmethionine (SAM) which transfers a methyl group to various biomolecules including DNA. Because cancer cells overconsume SAM for DNA methylation, methionine restriction has been known as a strategy for cancer growth control.17,18 Recently, it was reported that L-Met and SAM were involved in autophagy and cell growth by methylating protein phosphatase 2.19 In addition, cellular concentration of several AAs including L-Met is sensed by AA receptors, and the signal is transferred to the mechanistic target of rapamycin complex 1 (mTORC1) which is a major regulator of cell growth.20 Because of the biochemical importance of L-Met, many L-Met sensors have been reported.21–27 Although each reported method has its advantages and is useful in a specific application, none of the methods is able to specifically measure L-Met concentration in a complex mixture such as blood serum. In this study, a protein sensor highly specific for L-Met was developed by engineering a natural Met-binding protein and using a genetic code expansion technique for the incorporation of a fluorescent unnatural amino acid (UAA) to sense the target molecule via fluorescence resonance energy transfer (FRET). The designed sensor was able to specifically detect L-Met with a minimal signal from D-Met and the other 19 natural AAs. It was also able to determine L-Met concentration in fetal bovine serum (FBS) and optical purity in a mixture of D- and L-Met by FRET.
2. Experimental
2.1 General
All chemicals and DNA oligomers were obtained from commercial sources and used without further purification. All fluorescence spectra were measured by Hitachi F-7000 Fluorescence Spectrophotometer.
2.2 Expression and purification of the designed sensor proteins
The MetQ gene was amplified from E. coli DH5α™ (Invitrogen, California USA) and the YFP genes were obtained from commercial gene synthesis. The YFP-MetQ fusion gene was synthesized by overlap extension PCR and cloned into pBAD/Myc-His (Invitrogen) to generate pBAD-YFP-MetQ-WT. All mutations for MetQ engineering were introduced by site-directed mutagenesis according to the manufacturer's protocol (Invitrogen, California USA). Each pBAD plasmid containing YFP-MetQ-R189TAG fusion gene (or other derivatives with the amber codon at different positions) with designated mutations was co-transformed with pEvol-CouA-RS28 into the E. coli C321.ΔA strain29 (Addgene). Transformed cells were amplified in lysogeny broth (LB) supplemented with ampicillin (100 μg mL−1) and chloramphenicol (35 μg mL−1), and the start culture (2 mL) was used to inoculate 100 mL LB supplemented with ampicillin (100 μg mL−1), chloramphenicol (35 μg mL−1), and 1 mM CouA30 at 37 °C. Protein expression was induced by adding 0.2% L-arabinose when optical density reached 0.8 (550 nm), and the culture was grown overnight at 37 °C. Cells were harvested by centrifugation at 10![[thin space (1/6-em)]](https://www.rsc.org/images/entities/char_2009.gif) 000 rpm for 5 min at 4 °C, resuspended in a lysis buffer (50 mM NaH2PO4, 300 mM NaCl, 10 mM imidazole, and pH 8.0) and sonicated. Target proteins were purified using Ni-NTA affinity chromatography under native conditions, according to the manufacturer's protocol (Qiagen, Hilden Germany). Purified proteins were dialyzed eight times against a phosphate buffer (50 mM NaH2PO4, 50 mM NaCl, and pH 9.0) to remove L-Met bound to them.
000 rpm for 5 min at 4 °C, resuspended in a lysis buffer (50 mM NaH2PO4, 300 mM NaCl, 10 mM imidazole, and pH 8.0) and sonicated. Target proteins were purified using Ni-NTA affinity chromatography under native conditions, according to the manufacturer's protocol (Qiagen, Hilden Germany). Purified proteins were dialyzed eight times against a phosphate buffer (50 mM NaH2PO4, 50 mM NaCl, and pH 9.0) to remove L-Met bound to them.
2.3 Evaluation of the binding affinity and selectivity of the designed sensor proteins
Fluorescence spectra of each sensor protein (100 nM) in the assay buffer (50 mM NaH2PO4, 50 mM NaCl, and pH 9.0) were recorded from 420 nm to 600 nm with excitation at 360 nm in the presence (indicated concentration) and absence of each amino acid. FRET ratios and FRET ratio changes were calculated from each fluorescence spectrum by using eqn (1). All measurements were performed independently three times, and the data were averaged. Dissociation constants of sensor proteins were calculated using Origin software.
2.4 Determination of L-Met concentration in FBS
A fitting equation from the L-Met titration experiments (Fig. 6A) was derived,31 and used to determine L-Met concentration in FBS. Each FBS sample with different dilution was prepared by diluting commercial FBS with a phosphate buffer (50 mM NaH2PO4, 50 mM NaCl, and pH 9.0) (0.0025-, 0.005-, 0.01- and 0.025-fold dilutions). Each sample was mixed with YFP-MetQ-R189CouA-H88F (100 nM) in the same buffer and incubated at room temperature for 5 min. Fluorescence spectra were recorded with excitation at 360 nm, and FRET ratio changes were calculated. Using the fitting equation, L-Met concentration was determined.
2.5 Determination of optical purity
Stock solutions (10 μM) of L-Met and D-Met in a phosphate buffer (50 mM NaH2PO4, 50 mM NaCl, and pH 9.0) was mixed in the indicated ratios (200 μL total volume). YFP-MetQ-R189CouA-H88F (100 nM, final concentration) in the same buffer was added, and fluorescence was measured with excitation at 360 nm. Using the fitting equation from the L-Met titration experiments (Fig. 6A), optical purities were determined.
3. Results and discussion
3.1 Sensor protein design
Natural AA-binding proteins were considered as L-Met sensors. Protein Data Bank (PDB) was searched for Met-binding proteins, and the Met-binding protein (MetQ) from Escherichia coli (E. coli) was found along with the X-ray crystal structures of the protein.32,33 MetQ is a periplasmic AA-binding protein that forms a component of the ABC transporter system composed of MetN, MetI and MetQ for Met uptake.34–37 Since MetQ was the sole Met-binding protein that was structurally characterized, the protein was chosen for L-Met sensor design. Comparison of the two structures32,33 of MetQ, the ligand-bound form and apo form, showed a significant conformational change, which was characteristic for periplasmic binding proteins (PBPs).38–42
Previously, we had developed a strategy for AA sensor protein design based on genetic code expansion technology for the incorporation of a fluorescent UAA and genetic fusion of a fluorescent protein for FRET.43,44 This design strategy was applied to MetQ in order to develop a L-Met-sensing protein. L-(7-Hydroxycoumarin-4-yl)ethylglycine (CouA) and a yellow fluorescent protein (YFP) were chosen as a FRET pair. Based on the structures of MetQ,32,33 locations for CouA and YFP incorporation were considered. Due to the large size of YFP, the protein had to be introduced into either the N- or the C-terminus of MetQ. The N-terminus was located at the edge of the whole structure, and the C-terminus was located near the hinge region (Fig. 1). To maximize FRET signal change upon ligand binding, the N-terminus was selected for YFP fusion. MetQ has two lobes, and the N-terminus is located on the left lobe (Fig. 1). Therefore, sites for CouA incorporation were searched along the right lobe for larger FRET signal change (Fig. S1†). Four residues, E183, Q186, R189 and G210, in the right lobe which were solvent-exposed, far from the Met binding site and expected to produce maximum distance change from the N-terminus upon ligand binding were chosen.
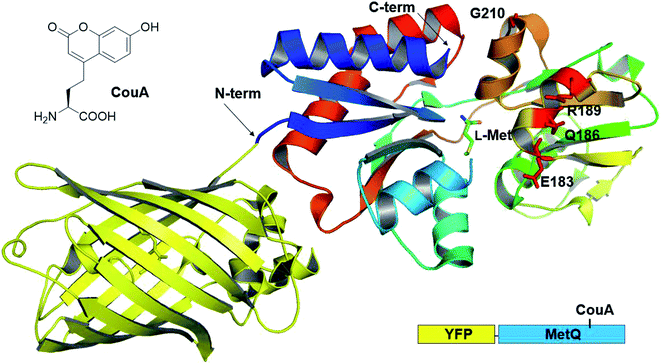 |
| | Fig. 1 Combined crystal structure of YFP (PDB 1HUY) and MetQ (PDB 4YAH) complexed with L-Met. Four residues were chosen for the replacement with CouA, and the N-terminus was fused with YFP. | |
3.2 Preparation of the designed proteins
To incorporate CouA into the protein, each codon for E183, Q186, R189 and G210 was replaced with an amber codon (TAG) by site-directed mutagenesis. Four mutant proteins (YFP-MetQ-E183CouA, YFP-MetQ-Q186CouA, YFP-MetQ-R189CouA and YFP-MetQ-G210CouA) were expressed in the presence of the evolved aminoacyl-tRNACUA (aa-tRNA)/aminoacyl-tRNA synthetase (aa-RS) (CouRS) pair30 for CouA and 1 mM of CouA. The mutant proteins were purified by Ni-NTA affinity purification, and their yields were 15–20 mg (the yield for YFP-MetQ-WT was 30–35 mg). SDS-PAGE analyses showed the correct size (55 kDa) of the proteins in the Coomassie stained image and clear fluorescence from genetically incorporated CouA in the fluorescence image (Fig. S2†).
3.3 Evaluation of the sensor proteins
The YFP-MetQ mutants containing CouA at a defined site were evaluated by measuring FRET signal change upon Met binding. Fluorescence spectra of each mutant were recorded in the presence (10 μM) and absence of L-Met with excitation at 360 nm (Fig. 2A). All mutant sensor proteins showed a significant spectral change in which fluorescence intensity decreased at 468 nm (ICouA) and increased at 537 nm (IYFP). From these data, FRET ratios (R, IYFP/ICouA) and FRET ratio changes (ΔR/R0) were calculated. The following equation was used to calculate ΔR/R0:| | |
FRET ratio change = ΔR/R0 = (RC − R0)/R0
| (1) |
where R0 is the FRET ratio at [ligand] = 0, and RC is the FRET ratio at [ligand] = C. ΔR/R0 values for the mutant sensor proteins were calculated, and it was found that the value for YFP-MetQ-R189CouA containing CouA at position 189 was the largest (ΔR/R0 = 1.7) (Fig. 2B). This result shows that the structure-based rational design and simple screening of potential residues for the incorporation of CouA have produced an excellent sensor protein that responds to L-Met binding with such a large change in fluorescence.
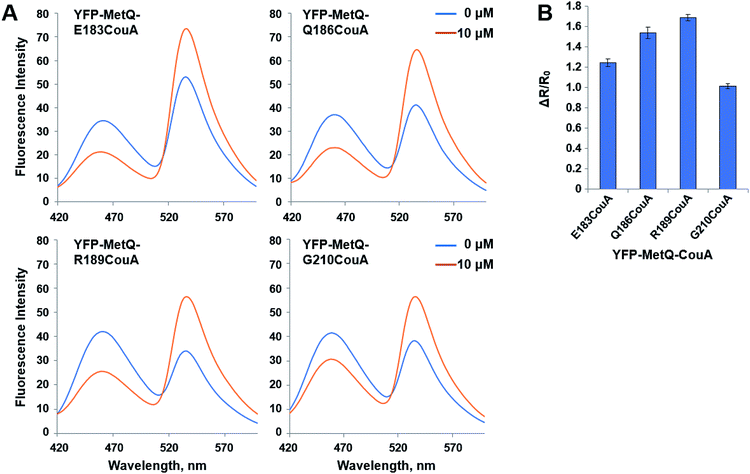 |
| | Fig. 2 (A) Fluorescence spectra of YFP-MetQ mutants containing CouA at the indicated position in the presence and absence of L-Met. Assay conditions: 100 nM sensor protein, 50 mM phosphate buffer (pH 9.0), 50 mM NaCl, and 10 μM L-Met. (B) Changes in FRET ratio of YFP-MetQ mutants calculated from data in Fig. 2A. FRET ratios were calculated from ICouA, 468 nm and IYFP, 537 nm upon excitation at 360 nm in the presence and the absence of L-Met. FRET ratio changes were calculated from eqn (1). Each data point represents an average of three independent experiments. | |
The mutant sensor protein, YFP-MetQ-R189CouA, was further characterized by recording fluorescence spectra at varied concentrations of L-Met (Fig. 3A). From these results, ΔR/R0 values were calculated and plotted against L-Met concentration. These results revealed that MetQ has strong affinity to L-Met with a dissociation constant Kd = 25.9 nM. Since MetQ has been known to function in the uptake of D-Met as well,34–36 the sensor protein was tested to evaluate its binding affinity to D-Met. The same titration experiment was carried out and ΔR/R0 values were plotted, which resulted in a dissociation constant Kd = 9.2 μM (Fig. 3B). Although the binding affinity of MetQ for D-Met was notably weaker than that for L-Met, the affinity was still adequate for cellular uptake of D-Met. The sensor protein was also evaluated for selectivity towards other natural amino acids. Fluorescence was measured with 19 natural amino acids, and ΔR/R0 values were calculated (Fig. 4). The result revealed that the sensor also recognizes D-Met and L-Gln with significant FRET change at 50 μM concentration. Overall, the designed sensor protein, YFP-MetQ-R189CouA, showed large FRET change upon L-Met binding with strong binding affinity, while the protein also had weak affinity to D-Met and L-Gln, which needed to be improved for L-Met-specific sensing.
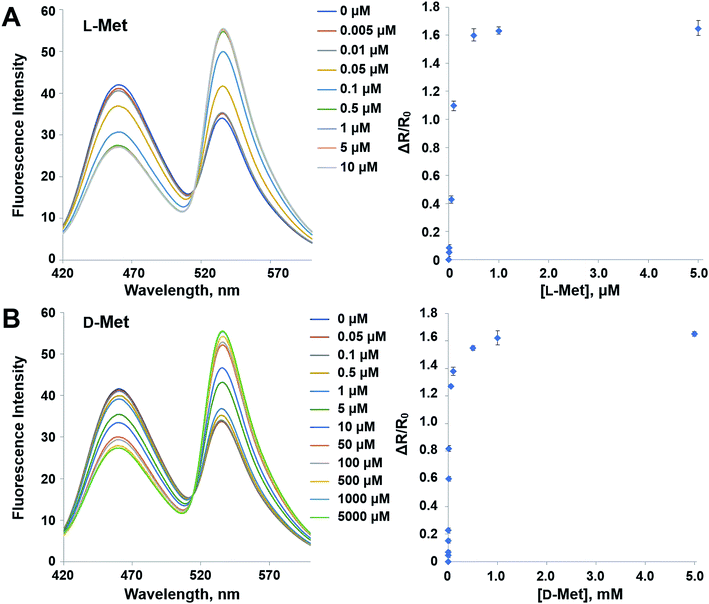 |
| | Fig. 3 Fluorescence spectra and FRET ratio changes of YFP-MetQ-R189CouA titrated with L-Met (A) and D-Met (B). Assay conditions: 100 nM sensor protein, 50 mM phosphate buffer (pH 9.0), 50 mM NaCl and Met (indicated concentration). Each data point represents an average of three independent experiments. | |
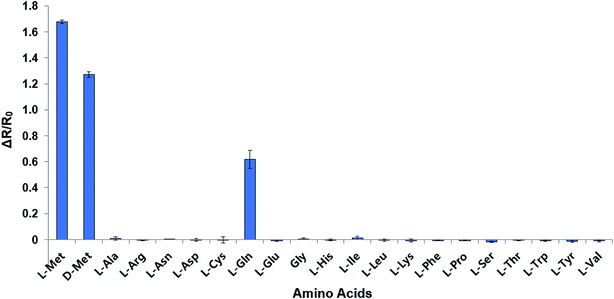 |
| | Fig. 4 Selectivity assays of YFP-MetQ-R189CouA against 20 natural AAs and D-Met. FRET ratios were calculated from ICouA, 468 nm and IYFP, 537 nm upon excitation at 360 nm, in the presence and the absence of each AA. Changes in FRET ratio were calculated from eqn (1). Each data point represents the average of three independent experiments. Assay conditions: 100 nM sensor protein, 50 mM phosphate buffer (pH 9.0), 50 mM NaCl and 50 μM AA. | |
3.4 Engineering the sensor protein for improved selectivity
In order to reduce the affinity of MetQ to D-Met and L-Gln, the protein was engineered by mutating residues near the binding site. Y69, His88 and N141 are located in the ligand binding site in the crystal structure of MetQ32,33 and are expected to affect binding affinity of the protein. The residues in YFP-MetQ-R189CouA were mutated to other amino acids (Fig. S3†), and each mutant sensor protein was expressed and purified as described above (Fig. S4†). ΔR/R0 values were obtained at three different concentrations of L-Met, D-Met and L-Gln for each mutant sensor protein (Fig. 5). In all mutants, affinities for all three amino acids decreased, but the mutant with H88F mutation showed minimal affinity to D-Met and L-Gln with small decrease in the affinity to L-Met. The best mutant, YFP-MetQ-R189CouA-H88F, was then evaluated for detailed binding properties. The titration experiments afforded dissociation constants, Kd = 1.4 μM for L-Met and Kd = 10 mM for D-Met (Fig. 6), and the selectivity assay showed minimal affinity to all tested amino acids at 50 μM (Fig. 7). By the H88F mutation, the specificity of the sensor was significantly improved by decreasing the affinity to D-Met and L-Gln. The binding affinity to L-Met decreased slightly, but the affinity was adequate for biochemical applications (see below).
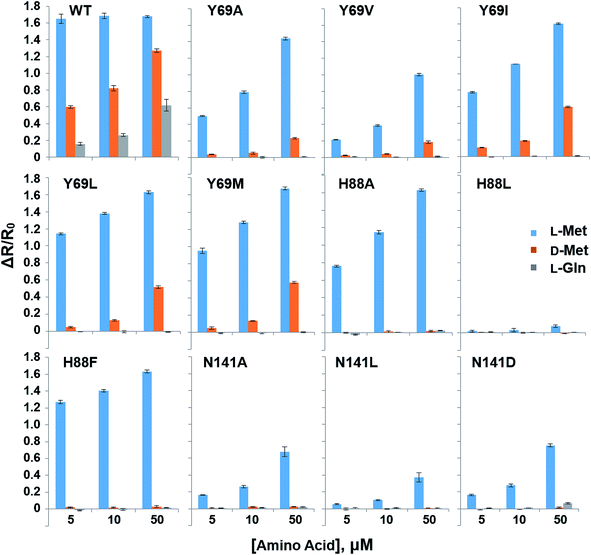 |
| | Fig. 5 Selectivity assays of YFP-MetQ-R189CouA mutants containing the indicated mutations against L-Met, D-Met and L-Gln. FRET ratios were calculated from ICouA, 468 nm and IYFP, 537 nm upon excitation at 360 nm, in the presence and the absence of each AA. FRET ratio changes were calculated from eqn (1). Each data-point represents the average of three independent experiments. Assay conditions: 100 nM sensor protein, 50 mM phosphate buffer (pH 9.0), 50 mM NaCl, and AA (indicated concentration). | |
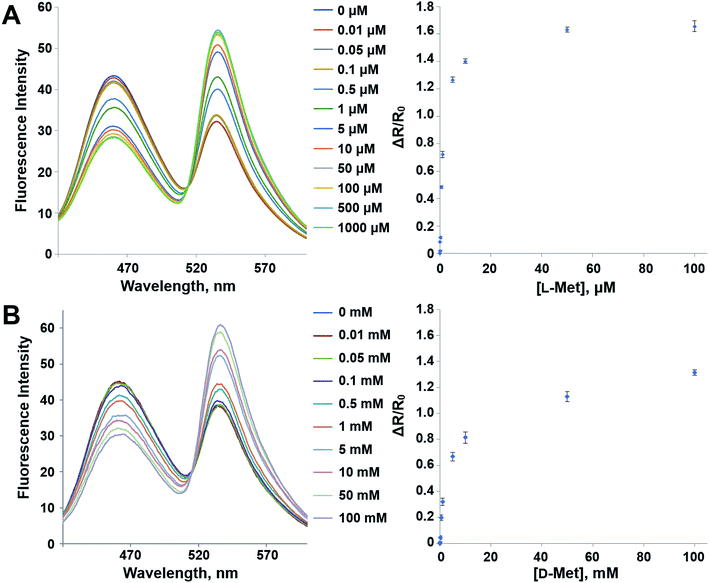 |
| | Fig. 6 Fluorescence spectra and FRET ratio changes of YFP-MetQ-R189CouA-H88F titrated with L-Met (A) and D-Met (B). Assay conditions: 100 nM sensor protein, 50 mM phosphate buffer (pH 9.0), 50 mM NaCl and Met (indicated concentration). Each data point represents an average of three independent experiments. | |
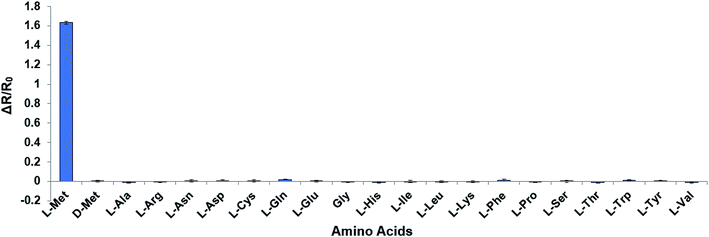 |
| | Fig. 7 Selectivity assays of YFP-MetQ-R189CouA-H88F against 20 natural AAs and D-Met. Changes in FRET ratio were calculated by the method described in Fig. 4. Each data point represents the average of three independent experiments. Assay conditions: 100 nM sensor protein, 50 mM phosphate buffer (pH 9.0), 50 mM NaCl, and 50 μM AA. | |
3.5 Applications of the sensor protein
YFP-MetQ-R189CouA-H88F showed a large FRET change upon L-Met binding with little change for other AAs including D-Met. Based on the data in Fig. 6, the sensor was expected to be able to measure L-Met concentration in the range of 0.5 μM and 10 μM with a detection limit of 0.1 μM. The sensor protein was applied to measure L-Met concentration in a complex biological sample. FBS is a liquid portion of the blood taken from a bovine fetus and is commonly used in cell culture as an essential nutrient source. FBS consists of various biomolecules including bovine serum albumin, growth factors, amino acids, vitamins, sugars, and lipids. Analysis of AA concentration in a blood sample is clinically important because AA metabolism is involved in human diseases, as mentioned in the Introduction. Typically, AA concentration in complex biological samples is measured by HPLC after derivatization of AAs with an aldehyde such as o-phthalaldehyde (OPA), which is labor-intensive and time-consuming. FRET signal change of the sensor protein from L-Met binding is large and highly specific to L-Met, which is optimal for determination of L-Met concentration in a blood sample. Initially, a fitting equation was derived from the titration experiment in Fig. 6A. Then, ΔR/R0 values were calculated from fluorescence measurements of FBS with varied dilution using the sensor protein (Fig. 7). These measurements resulted in the determination of L-Met concentration in FBS, which was 18.3 μM. The value was within the reported range (15–30 μM) of L-Met concentration in the blood.45
α-AAs have a stereogenic center, and determination of optical purity of AAs is an important analytical process in chemistry. As an alternative to current methods such as chiral HPLC and specific rotation analyses, optical purity of a mixture of D- and L-Met was determined by FRET analysis using the sensor protein. Mixtures of D- and L-Met with different composition were prepared, and ΔR/R0 values of each mixture were measured using the sensor protein (Fig. 8). From these results, optical purity of each sample was determined, and the values were close to the theoretical values (Table 1). This method is experimentally simple and requires a small amount of sample (less than 1 μg), which is advantageous over other methods.
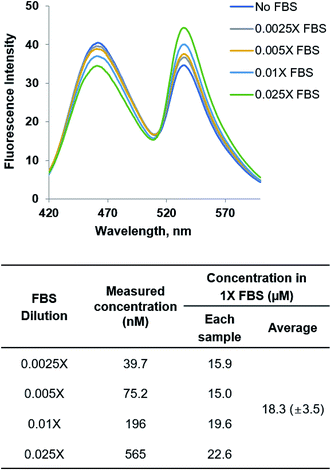 |
| | Fig. 8 Fluorescence spectra of YFP-MetQ-R189CouA-H88F titrated with FBS for determination of L-Met concentration in FBS. Fluorescence spectra were recorded at each concentration of FBS with excitation at 360 nm. The concentration of L-Met in each FBS sample was determined using the fitting equation from the titration experiment in Fig. 6A. Assay conditions: 100 nM sensor protein, 50 mM phosphate buffer (pH 9.0), 50 mM NaCl and FBS (indicated concentration). | |
Table 1 Determination of optical purity of Met by fluorescence measurement using YFP-MetQ-R189CouA-H88F. Samples were prepared by mixing defined amounts of D- and L-Met. Enantiomeric excesses were determined using the fitting equation from the titration experiment in Fig. 6A
| Sample |
[L-Isomer] (μM) |
[D-Isomer] (μM) |
Theoretical ee (%) |
Measured ee (%) |
| 1 |
0 |
10.0 |
−100 |
−99.95 (±0.043) |
| 2 |
1.0 |
9.0 |
−80 |
−80.20 (±0.65) |
| 3 |
2.5 |
7.5 |
−50 |
−48.27 (±0.35) |
| 4 |
4.0 |
6.0 |
−20 |
−18.69 (±1.91) |
| 5 |
5.0 |
5.0 |
0 |
−0.95 (±1.99) |
| 6 |
6.0 |
4.0 |
20 |
22.21 (±4.33) |
| 7 |
7.5 |
2.5 |
50 |
48.10 (±4.43) |
| 8 |
9.0 |
1.0 |
80 |
78.31 (±4.98) |
| 9 |
10.0 |
0 |
100 |
99.77 (±4.37) |
4. Conclusions
FRET-based protein sensors were designed and evaluated for stereospecific L-Met analysis. A natural Met-binding protein, MetQ, was selected, and a fluorescent UAA and YFP were introduced into the protein for FRET by using genetic code expansion technology and genetic fusion. The designed sensor protein produced significant FRET change upon L-Met binding with 1.7 of ΔR/R0, corresponding to a 2.7-fold increase in FRET ratio. Although the natural Met-binding protein has strong binding affinity to L-Met, the protein showed significant FRET signal change with D-Met and L-Gln at 50 μM concentration. To improve its selectivity, selected residues in the binding site of MetQ were mutated, and 11 mutant proteins were evaluated for improved binding selectivity. Among the mutant proteins, the mutant with H88F mutation showed minimal FRET change at 50 μM of D-Met and L-Gln, while retaining the FRET change for L-Met at the maximum. The sensor protein was applied to determine L-Met concentration in FBS and optical purity of a mixture of D- and L-Met by FRET measurements and turned out to be useful for these applications. Finally, the sensor design strategy using genetic code expansion technology can be applied to other natural small molecule-binding proteins to develop useful FRET-based protein sensors.
Conflicts of interest
The authors declare no competing financial interests.
Acknowledgements
This research was supported by the Global Frontier Research Program (NRF-2015M3A6A8065833) and the Basic Science Research Program (NRF-2019R1A2C1010665 and 2018R1A6A1A03024940) through the National Research Foundation of Korea (NRF) funded by the Korean government.
References
- D. W. Gietzen and Q. R. Rogers, Trends Neurosci., 2006, 29, 91–99 CrossRef CAS PubMed.
- J. Gallinetti, E. Harputlugil and J. R. Mitchell, Biochem. J., 2013, 449, 1–10 CrossRef CAS PubMed.
- M. C. Gueli and G. Taibi, Neurol. Sci., 2013, 34, 1575–1579 CrossRef PubMed.
- F. Ianni, L. Pucciarini, E. Camaioni, G. Alunni, R. Sardella and B. Natalini, International Journal of Clinical Research & Trials, 2017, 2, 112 Search PubMed.
- S. M. Rutherfurd and G. S. Gilani, Curr. Protoc. Protein Sci., 2009, 58, 11.9.1–11.9.37 Search PubMed.
- A. Masuda and N. Dohmae, BioSci. Trends, 2011, 5, 231–238 CrossRef CAS PubMed.
- T. Nemkov, A. D'Alessandro and K. C. Hansen, Amino Acids, 2015, 47, 2345–2357 CrossRef CAS PubMed.
- Y. Akhlaghi, S. Ghaffari, H. Attar and A. A. Hoor, Amino Acids, 2015, 47, 2255–2263 CrossRef CAS PubMed.
- Y. Liu and L. Xu, Sensors, 2007, 7, 2446–2457 CrossRef CAS PubMed.
- Y. k. Yue, F. Huo, P. Ning, Y. Zhang, J. Chao, X. Meng and C. Yin, J. Am. Chem. Soc., 2017, 139, 3181–3185 CrossRef CAS PubMed.
- A. Buryak and K. Severin, J. Am. Chem. Soc., 2005, 127, 3700–3701 CrossRef CAS PubMed.
- M. Qin, F. Li, Y. Huang, W. Ran, D. Han and Y. Song, Anal. Chem., 2015, 87, 837–842 CrossRef CAS PubMed.
- T. Minami, N. A. Esipenko, B. Zhang, L. Isaacs and P. Anzenbacher, Chem. Commun., 2014, 61–63 RSC.
- B. Wang, J. Han, C. Ma, M. Bender, K. Seehafer, A. Herrmann and H. F. Bunz Uwe, Chem.–Eur. J., 2017, 23, 12471–12474 CrossRef CAS PubMed.
- B. Wang, J. Han, N. M. Bojanowski, M. Bender, C. Ma, K. Seehafer, A. Herrmann and U. H. F. Bunz, ACS Sens., 2018, 3, 1562–1568 CrossRef CAS PubMed.
- F. Octa-Smolin and J. Niemeyer, Chem.–Eur. J., 2018, 24, 16506–16510 CrossRef CAS PubMed.
- P. Cavuoto and M. F. Fenech, Cancer Treat. Rev., 2012, 38, 726–736 CrossRef CAS PubMed.
- E. Cellarier, X. Durando, M. P. Vasson, M. C. Farges, A. Demiden, J. C. Maurizis, J. C. Madelmont and P. Chollet, Cancer Treat. Rev., 2003, 29, 489–499 CrossRef CAS PubMed.
- B. M. Sutter, X. Wu, S. Laxman and B. P. Tu, Cell, 2013, 154, 403–415 CrossRef CAS PubMed.
- R. L. Wolfson and D. M. Sabatini, Cell Metab., 2017, 26, 301–309 CrossRef CAS PubMed.
- S. D. Holmstrom and J. A. Cox, Anal. Chem., 2000, 72, 3191–3195 CrossRef CAS PubMed.
- S. B. Revin and S. A. John, Electroanalysis, 2012, 24, 1277–1283 CrossRef CAS.
- M. Mohsin and A. Ahmad, Biosens. Bioelectron., 2014, 59, 358–364 CrossRef CAS PubMed.
- M. Murugavelu and B. Karthikeyan, Mater. Sci. Eng., C, 2017, 70, 656–664 CrossRef CAS PubMed.
- N. Tavakkoli, N. Soltani and E. Khorshidi, RSC Adv., 2017, 7, 21827–21836 RSC.
- Q. Lin, L. Liu, F. Zheng, P.-P. Mao, J. Liu, Y.-M. Zhang, H. Yao and T.-B. Wei, RSC Adv., 2017, 7, 34411–34414 RSC.
- Y. Li, S. Mei, S. Liu and X. Hun, J. Pharm. Biomed. Anal., 2019, 165, 94–100 CrossRef CAS PubMed.
- T. S. Young, I. Ahmad, J. A. Yin and P. G. Schultz, J. Mol. Biol., 2010, 395, 361–374 CrossRef CAS PubMed.
- M. J. Lajoie, A. J. Rovner, D. B. Goodman, H. R. Aerni, A. D. Haimovich, G. Kuznetsov, J. A. Mercer, H. H. Wang, P. A. Carr, J. A. Mosberg, N. Rohland, P. G. Schultz, J. M. Jacobson, J. Rinehart, G. M. Church and F. J. Isaacs, Science, 2013, 342, 357–360 CrossRef CAS PubMed.
- J. Wang, J. Xie and P. G. Schultz, J. Am. Chem. Soc., 2006, 128, 8738–8739 CrossRef CAS PubMed.
- P. Thordarson, Chem. Soc. Rev., 2011, 40, 1305–1323 RSC.
- P. T. Nguyen, Q. W. Li, N. S. Kadabaa, J. Y. Lai, J. G. Yang and D. C. Rees, Biol. Chem., 2015, 396, 1127–1134 CAS.
- P. T. Nguyena, J. Y. Laia, A. T. Lee, J. T. Kaisera and D. C. Rees, Proc. Natl. Acad. Sci. U. S. A., 2018, 115, E10596–E10604 CrossRef PubMed.
- R. J. Kadner, J. Bacteriol., 1974, 117, 232–241 CAS.
- J. Gál, A. Szvetnik, R. Schnell and M. Kálmán, J. Bacteriol., 2002, 184, 4930–4932 CrossRef PubMed.
- C. Merlin, G. Gardiner, S. Durand and M. Masters, J. Bacteriol., 2002, 184, 5513–5517 CrossRef CAS PubMed.
- N. S. Kadaba, J. T. Kaiser, E. Johnson, A. Lee and D. C. Rees, Science, 2008, 321, 250–253 CrossRef CAS PubMed.
- C.-D. Hsiao, Y.-J. Sun, J. Rose and B.-C. Wang, J. Biol. Chem., 1996, 262, 225–242 CAS.
- Y.-J. Sun, J. Rose, B.-C. Wang and C.-D. Hsiao, J. Biol. Chem., 1998, 278, 219–229 CAS.
- J. C. Spurlino, G.-Y. Lu and F. A. Quiocho, J. Biol. Chem., 1991, 266, 5202–5219 CAS.
- A. J. Sharff, L. E. Rodseth, J. C. Spurlino and F. A. Quiocho, Biochemistry, 1992, 31, 10657–10663 CrossRef CAS PubMed.
- U. Magnusson, B. Salopek-Sondi, L. A. Luck and S. L. Mowbray, J. Biol. Chem., 2004, 279, 8747–8752 CrossRef CAS PubMed.
- W. Ko, S. Kim, S. Lee, K. Jo and H. S. Lee, RSC Adv., 2016, 6, 78661–78668 RSC.
- W. Ko, S. Kim and H. S. Lee, Org. Biomol. Chem., 2017, 15, 8761–8769 RSC.
- S. Małgorzewicz, A. Debska-Slizień, B. Rutkowski and W. Lysiak-Szydłowska, J. Renal Nutr., 2008, 18, 239–247 CrossRef PubMed.
Footnote |
| † Electronic supplementary information (ESI) available. See DOI: 10.1039/c9ra01317b |
|
| This journal is © The Royal Society of Chemistry 2019 |
Click here to see how this site uses Cookies. View our privacy policy here.  Open Access Article
 *
*
![[thin space (1/6-em)]](https://www.rsc.org/images/entities/char_2009.gif) 000 rpm for 5 min at 4 °C, resuspended in a lysis buffer (50 mM NaH2PO4, 300 mM NaCl, 10 mM imidazole, and pH 8.0) and sonicated. Target proteins were purified using Ni-NTA affinity chromatography under native conditions, according to the manufacturer's protocol (Qiagen, Hilden Germany). Purified proteins were dialyzed eight times against a phosphate buffer (50 mM NaH2PO4, 50 mM NaCl, and pH 9.0) to remove L-Met bound to them.
000 rpm for 5 min at 4 °C, resuspended in a lysis buffer (50 mM NaH2PO4, 300 mM NaCl, 10 mM imidazole, and pH 8.0) and sonicated. Target proteins were purified using Ni-NTA affinity chromatography under native conditions, according to the manufacturer's protocol (Qiagen, Hilden Germany). Purified proteins were dialyzed eight times against a phosphate buffer (50 mM NaH2PO4, 50 mM NaCl, and pH 9.0) to remove L-Met bound to them.


