DOI:
10.1039/C9RA01312A
(Paper)
RSC Adv., 2019,
9, 10437-10444
The use of a sucrose precursor to prepare a carbon membrane for the separation of hydrogen from methane
Received
21st February 2019
, Accepted 28th March 2019
First published on 3rd April 2019
Abstract
In this study, we present the use of sucrose (C12H22O11), which exists in abundance in nature, to prepare a carbon membrane without any preceding treatments. The preparation procedure was conducted using a low pyrolysis temperature, i.e., in the range of 300–500 °C, followed by complete formation of the structure of the carbon membrane. The gas separation characteristics of the resulting membranes were assessed by evaluating both hydrogen and methane permeation. The highest selectivity obtained for H2/CH4 was 31.34 with H2 permeability of 459.24 GPU. The entire fabrication procedure was designed to be economical in order to facilitate any future commercialization.
Introduction
Membranes are thin barriers that separate different molecules in a selective manner through their chemical or physical properties.1 Different membranes can have different structural shapes, materials, and properties, which can be adjusted synthetically and tailored for use in given applications and processes.2,3 Structurally, membranes can be classified as either symmetric or asymmetric. Symmetric membranes can be porous or nonporous (dense). In this type of membrane, the properties, such as the transport flow and diffusion rates, are identical over the entire cross section of the membrane due to its uniform structure.2 Conversely, asymmetric membranes usually consist of at least two different layers that have different thicknesses. The concept behind these membranes is to synthesize an extremely thin layer over another thick layer that provides the required mechanical strength. The thicknesses of these layers have significant effects on the transport rate, which increases as the thickness decreases.4,5 Both inorganic and organic materials are used to fabricate membranes for gas-separation applications. Inorganic materials, such as carbon, have been considered to be strong candidates for many separation tasks due to their advantages, which include their pore structure, thermal stability, and ability to adsorb some gases.1 Carbon membranes have been used in gas separation applications since the early 1970s, but the development of carbon membranes is still an ongoing process. Carbon membranes are produced in a heat-treatment process i.e., a pyrolysis process, using an extensive variety of precursors.6 However, to date, the utilization of many precursors has not been investigated.7–11 In this paper, carbon membranes were prepared using simple sucrose as a carbon precursor. Sucrose was chosen due to its advantage of being a natural resource that can be produced without the extensive use of energy.12 A sucrose precursor was pyrolized using a relatively low temperature to form a carbon matrix. The permeability of the membrane was enhanced by using an asymmetric structure that consisted of a very thin film supported by a thicker structure.13,14 Therefore, in this study, we prepared the carbon layer on a porous, stainless-steel support. These membranes were evaluated to determine their effectiveness in separating hydrogen from methane.
Experimental work
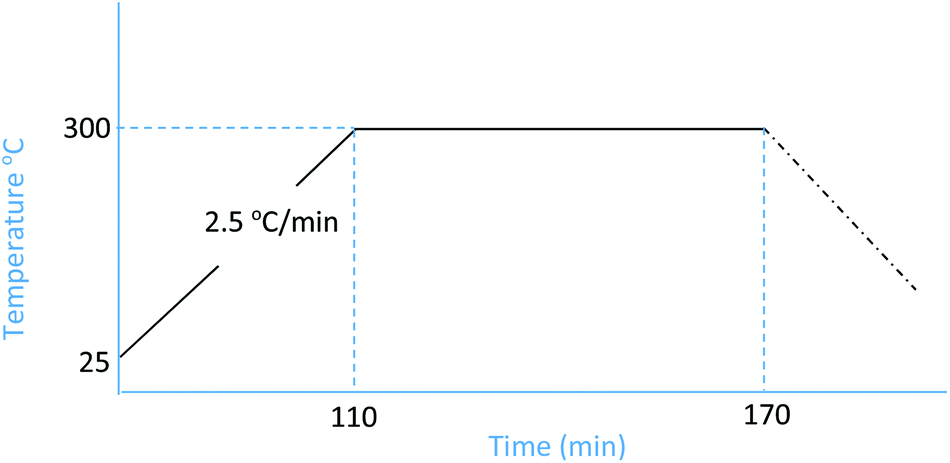
The thin carbonized sucrose layer was supported by a porous stainless steel disc to provide the required mechanical strength. Thus, it was very important for the surface of the stainless steel to be clean, because any impurities would affect the interaction between the sucrose solution and the surface of the support.15 Therefore, the support was washed with a detergent solution and sonicated with deionized water for 1 h at room temperature. Then, the sucrose solution was painted over the stainless steel support and left to dry overnight prior to being subjected to the pyrolysis process. The sucrose solution was prepared using various amounts of sucrose dissolved in water to produce different concentrations, i.e., the sucrose![[thin space (1/6-em)]](https://www.rsc.org/images/entities/char_2009.gif) :water weight relationships were 1:1, 2:1, and 3:1. For each concentration, the pyrolysis was conducted at 300 °C with a heating rate of 2.5 °C min−1 and a soak time of 60 min. Nitrogen was used as the inert gas (Fig. 1).
:water weight relationships were 1:1, 2:1, and 3:1. For each concentration, the pyrolysis was conducted at 300 °C with a heating rate of 2.5 °C min−1 and a soak time of 60 min. Nitrogen was used as the inert gas (Fig. 1).
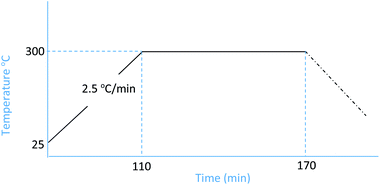 |
| | Fig. 1 Temperature system trend used in the pyrolysis process. | |
In order to acquire better interaction between the surface of the support and the sucrose solution, we also used a dip-coating method. In this approach, the stainless steel support was immersed in the sucrose solution for 10 minutes, after which they were removed from the solution and allowed to dry for 30 minutes at room temperature. The thickness of the carbon membrane generally was difficult to obtain since the membrane was in asymmetric form. However, the mass of the carbon could be determined, and the results are provided in Table 1. The final reduction in the weight of the carbon during the pyrolysis process was due to the range of products that were formed that had different volatilities.
Table 1 Carbon membrane weight during preparation (1:1 and 2:1 sucrose water ratio)a
| Membrane |
Surface painting (weight in g) |
Dip-coating (weight in g) |
| (1:1) |
(2:1) |
(3:1) |
(1:1) |
(2:1) |
(3:1) |
| S.S. = stainless steel. |
| S.S disc |
32.91 |
32.93 |
33.01 |
32.93 |
31.89 |
32.77 |
| S.S disc + sucrose |
36.05 |
36.44 |
37.47 |
38.31 |
38.07 |
37.91 |
| Membrane after pyrolysis |
32.96 |
33.01 |
33.1 |
33.00 |
32.01 |
32.92 |
| Mass of carbon |
0.05 |
0.08 |
0.09 |
0.07 |
0.12 |
0.15 |
Table 1 shows that, for both preparation methods, the (3:1) sucrose-to-water concentration had the highest amount of carbon mass on the stainless steel support. Obviously, this was due to the high viscosity of this solution. Yet, the mass gained cannot be considered as a precise measure of how much of the carbon is active within the support surface. Therefore, the membranes were evaluated for gas separation by measuring the extent to which they were permeated by hydrogen and methane. For this purpose, we used a membrane gas unit (Convergence Inspector Neptunus) with the flow diagram shown in Fig. 2. The operating conditions were set at 25 °C, a feed pressure of 5 to 15 bar, and a feed flow rate of 100 L h−1. The flux and selectivity of the carbon membrane were calculated from the data that were collected using eqn (1) and (2), respectively. Where (P)i is the fluxes, (Qi) is the volumetric flow rate of gas, (Δp) is the transmembrane pressure drop, (A) is the surface area of the membrane, and (αA/B) is the separation factor or selectivity. The permeability units that usually are used in membrane studies are the gas permeation unit (GPU) and the Barrer. In our study, the GPU (1 GPU = 1 × 10⁻⁶ cm3 (STP)/cm2 s cm Hg) was used to avoid implementing the membrane thickness.
| |
 | (1) |
| |
 | (2) |
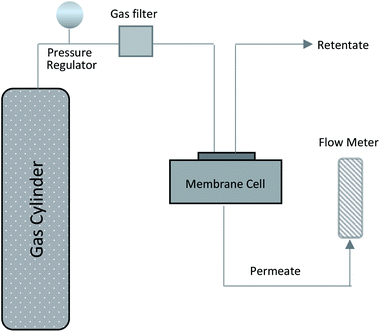 |
| | Fig. 2 Flow diagram of membrane gas unit (Convergence Inspector Neptunus). | |
Results and discussion
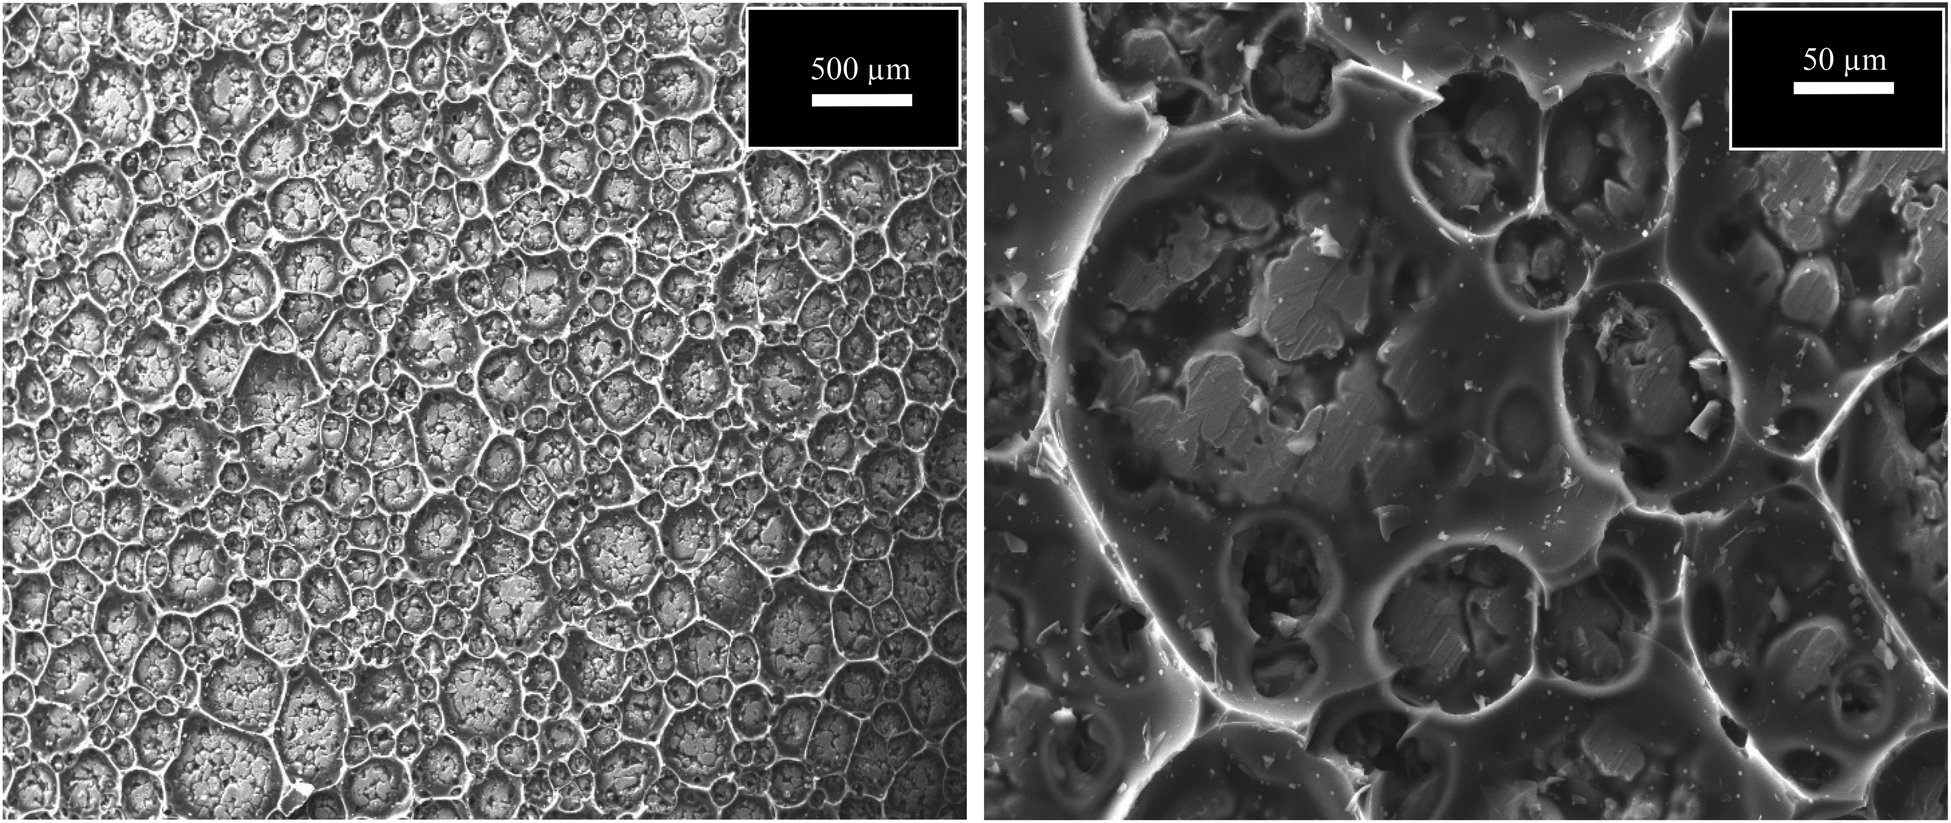
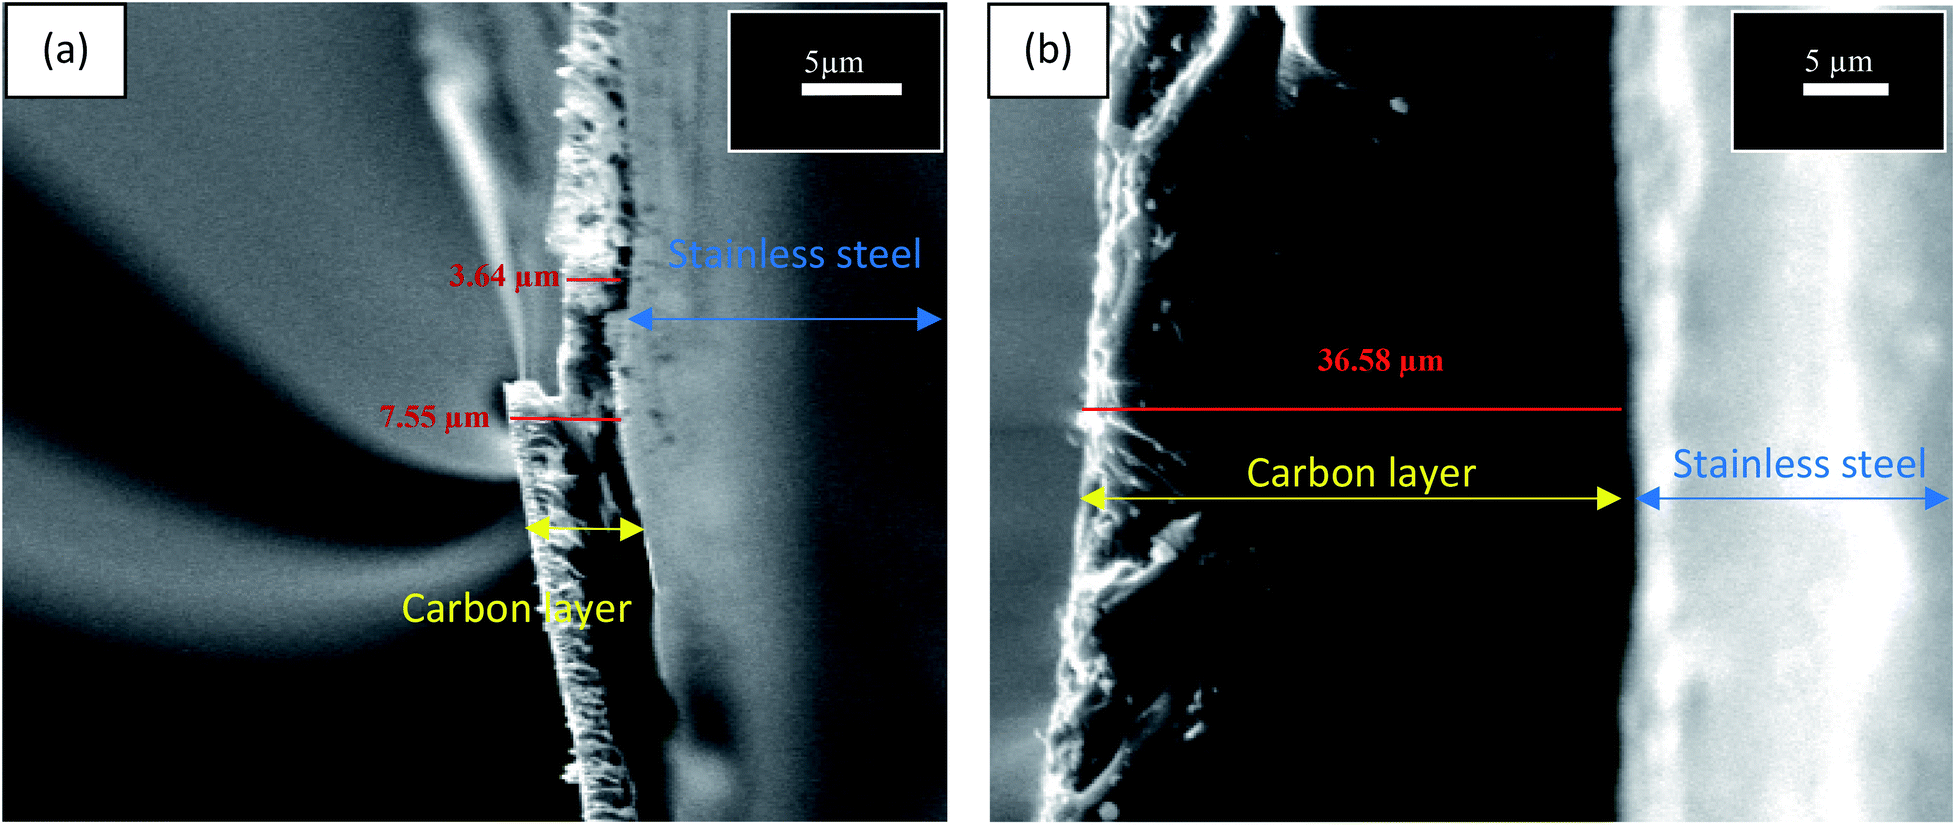
Table 2 presents the evaluation and comparison of the performances of the membranes we prepared using the two methods described above. The results clearly indicated that the dip-coating method performed better than the surface-painting method. Obviously, the dip-coating method provided a more thorough coverage of the supports by the sucrose solution. Another possibility that potentially contributed to the low performance of the surface-painting method was the presence of surface defects, which diminished the ability of the membrane to act as a sieve, as indicated by the Scanning Electron Microscopy (SEM), (JEOL, JSM-IT300), images in Fig. 3. The lack of coverage in the surface-painted membranes was attributed to the fact that the solution was applied only on the surface of the support and did not infiltrate the support, resulting in the formation of some pinholes and cracks after the evolution had taken place during the pyrolysis process.16 Fig. 4 shows that the dip-coated membrane had less defects and cracks than the surface-painted membrane. Also, the dip-coating method provided better distribution of the carbon over the entire support structure after the pyrolysis was conducted as shown in Fig. 5. Where the thicknesses of the dip-coated membrane and surface-painted membrane were 36.58 and (3.64–7.55) μm, respectively. Another variable, i.e., feed pressure, was also tested, as noted from the results that indicated that there was a trade-off between the fluxes and selectivity.17 As the feed pressure increased, the selectivity decreased and the fluxes increased. Fig. 6 shows the dip-coated membrane with the 3:1 sucrose-to-water concentration.
Table 2 Comparison between surface painting and dip-coating method using different sucrose to water concentrations
| Method |
Feed pressure (bar) |
Permeance (GPU) |
Selectivity H2/CH4 |
| Hydrogen |
Methane |
| Surface painting (1:1) |
5 |
723.47 |
535.90 |
1.35 |
| 7 |
764.44 |
574.77 |
1.33 |
| 10 |
792.97 |
609.98 |
1.30 |
| 15 |
801.32 |
626.03 |
1.28 |
| Surface painting (2:1) |
5 |
698.44 |
369.54 |
1.89 |
| 7 |
701.46 |
387.55 |
1.81 |
| 10 |
714.37 |
405.89 |
1.76 |
| 15 |
720.97 |
414.35 |
1.74 |
| Surface painting (3:1) |
5 |
645.39 |
337.90 |
1.91 |
| 7 |
657.11 |
359.08 |
1.83 |
| 10 |
679.54 |
373.37 |
1.82 |
| 15 |
697 20 |
389.49 |
1.79 |
| Dip-coating (1:1) |
5 |
522.49 |
22.12 |
23.62 |
| 7 |
525.89 |
22.89 |
22.97 |
| 10 |
529.41 |
24.01 |
22.05 |
| 15 |
534.34 |
25.15 |
21.25 |
| Dip-coating (2:1) |
5 |
480.09 |
17.48 |
27.46 |
| 7 |
485.88 |
18.54 |
25.77 |
| 10 |
491.04 |
20.54 |
23.91 |
| 15 |
496.77 |
22.12 |
22.46 |
| Dip-coating (3:1) |
5 |
470.64 |
16.74 |
28.11 |
| 7 |
479.25 |
17.39 |
27.56 |
| 10 |
488.77 |
21.27 |
22.97 |
| 15 |
497.90 |
26.51 |
18.78 |
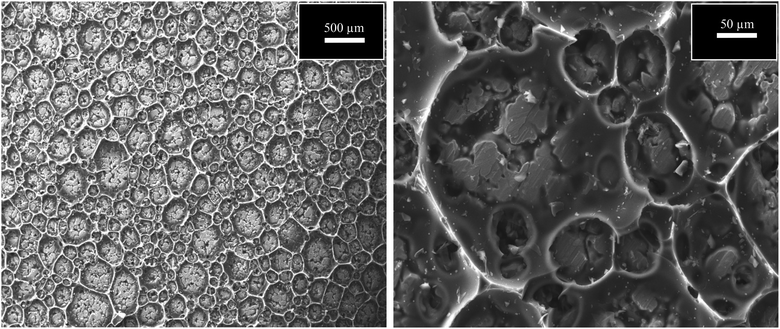 |
| | Fig. 3 SEM images of surface-painting method using 3:1 concentration at magnification of 500 and 50 μm. | |
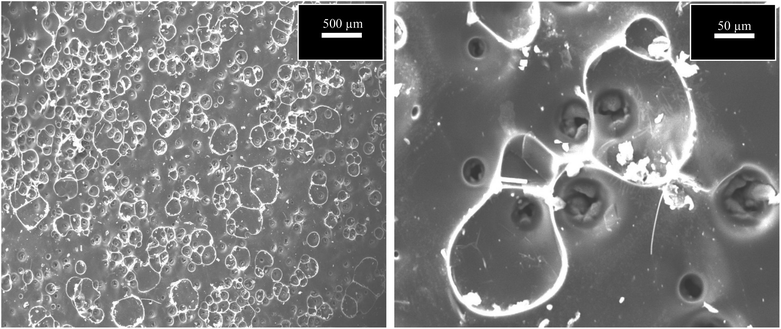 |
| | Fig. 4 SEM images of dip-coating method using 3:1 concentration at magnification of 500 μm and 50 μm. | |
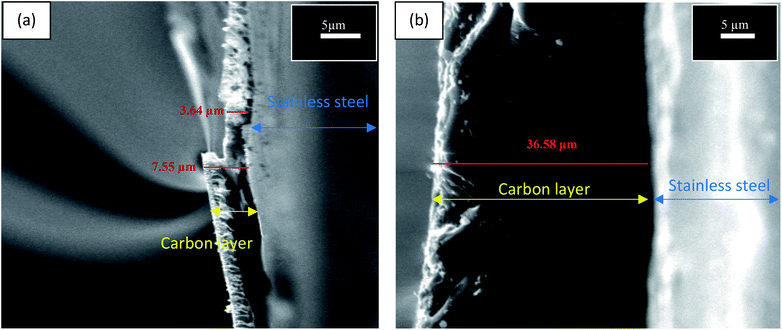 |
| | Fig. 5 SEM edge view images (a) surface-painting and (b) dip coating methods using 3:1 concentration. | |
 |
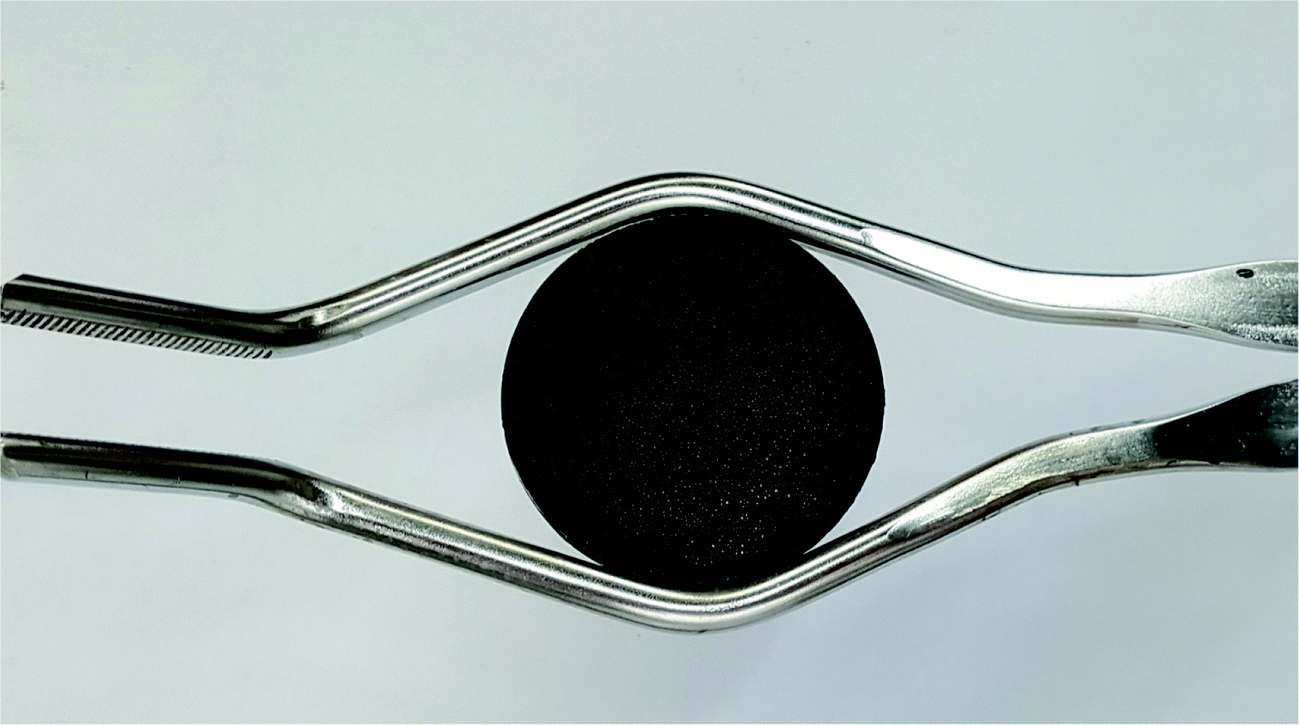
| | Fig. 6 Carbon membrane prepared using dip-coating with 3:1 concentration. | |
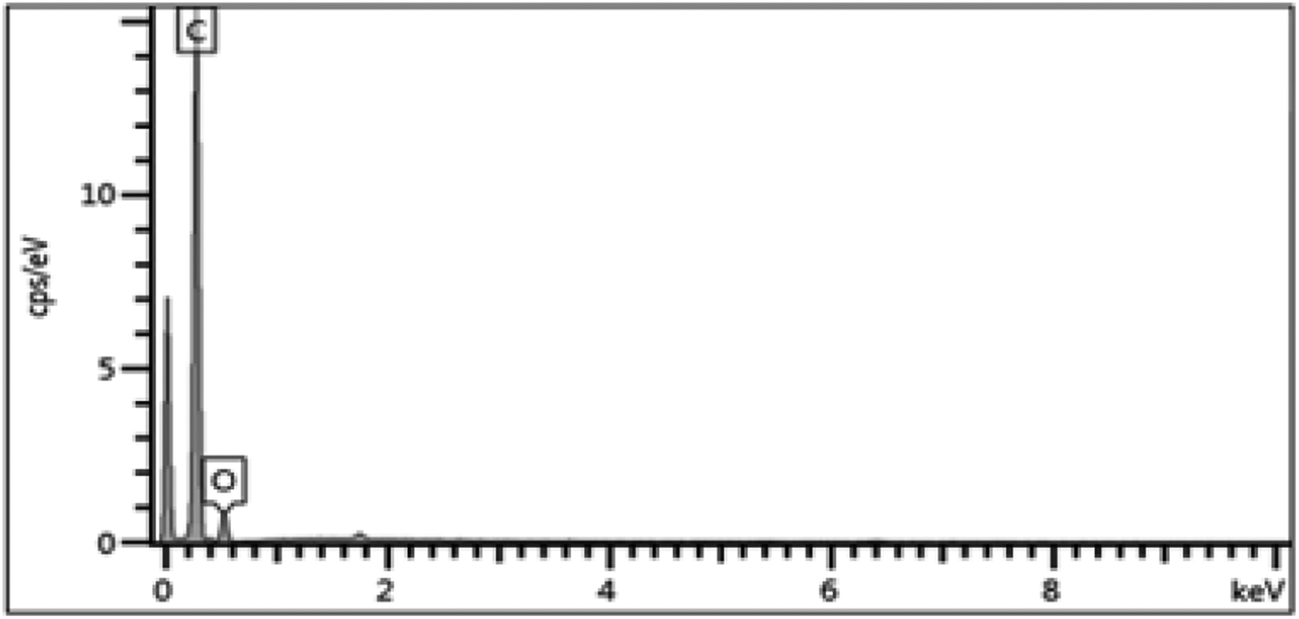
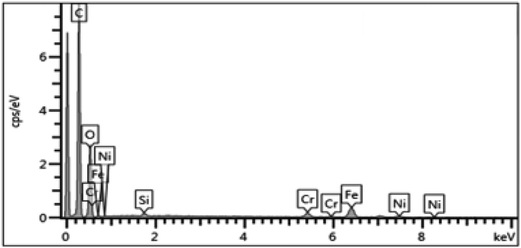
Electron-dispersive X-ray spectroscopy (EDX) obtained from Oxford Instrumentation, INCA X-ACT, was used for additional characterization and analysis. The EDX indicated that the major element present in the dip-coated membrane was carbon, which indicated the good coverage of the carbon over the stainless steel support, as shown in Fig. 7.
 |
| | Fig. 7 EDX of dip-coated membrane with 3:1 concentration. | |
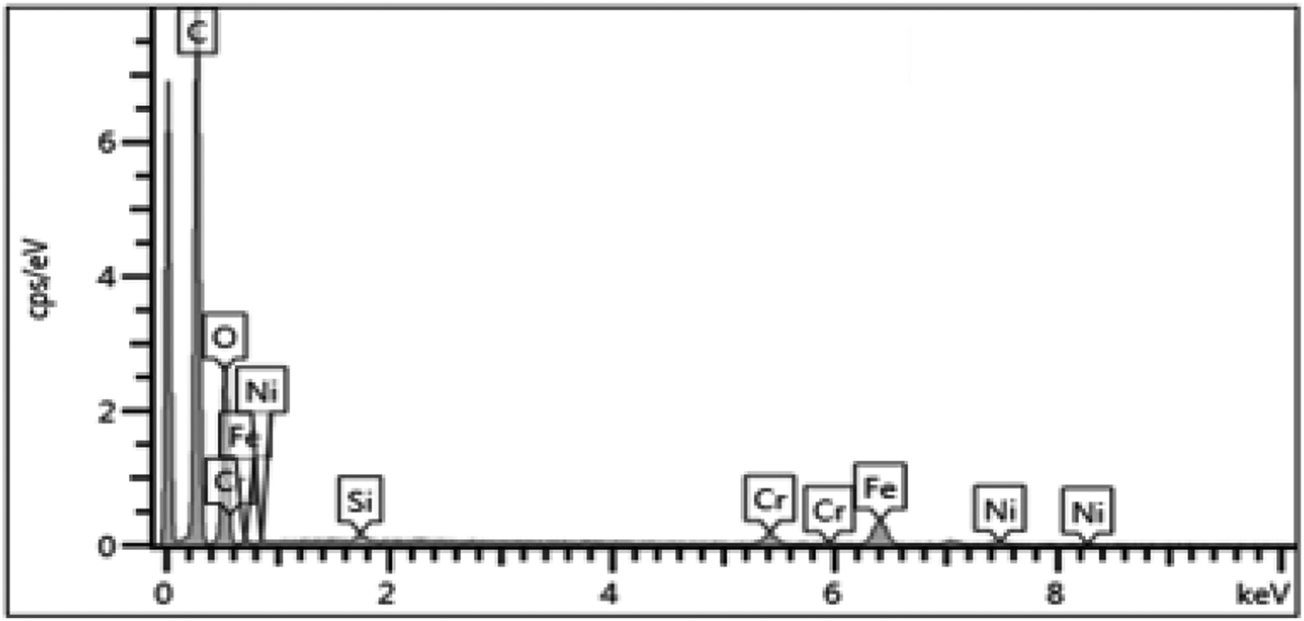
On the other hand, the EDX analysis of the surface-painted membrane (Fig. 8) identified the presence of other elements, including nickel, iron, and chromium. These elements were in the uncovered parts of the stainless steel support, and this compromised the selectivity performance.
 |
| | Fig. 8 EDX of surface painted membrane with 3:1 concentration. | |
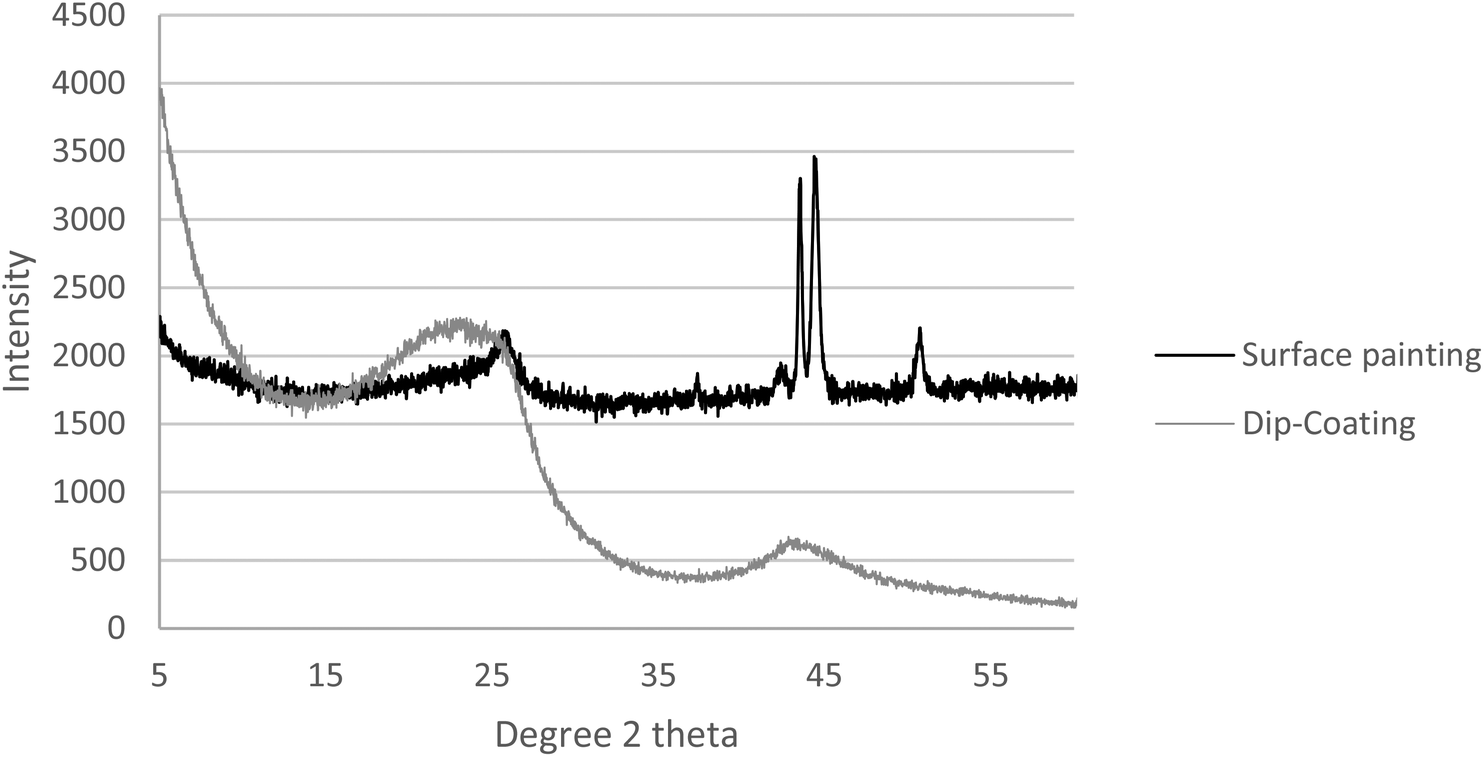
In addition to the SEM and EDX, the membranes we prepared were subjected to X-ray diffraction (XRD) analysis (PANalytical, Empyrean XE) to determine the crystallinity of the surface. Fig. 9 compares the XRD analysis of the two methods. The key peaks of iron, nickel, and chromium are presented in the surface painting pattern, indicating the exposure of the surface of the stainless steel. However, peaks were not present for these elements in the dip-coated sample, which was attributed to the abundant coverage of carbon on the stainless steel disk with carbon peaks at 2 theta = 24 and 43.
 |
| | Fig. 9 XRD comparison between the two preparation methods i.e., dip-coating and surface-painting. | |
At this stage, it was concluded that the dip-coating method with the (3:1) concentration produced the highest selectivity of H2/CH4, and it was investigated further. The effects of different pyrolysis temperatures were evaluated to test the feasibility of performance optimization. Therefore, the membrane with the concentration of 3:1 was subjected to different pyrolysis temperatures, i.e., 350–500 °C, as shown in Table 3. Both the H2 and the CH4 fluxes decreased as the pyrolysis temperature increased, because the pore structure of the sucrose membrane became smaller as the pyrolysis temperature increased due to the higher crystallinities and the formation of a dense layer, leading to the increase of selectivity.12
Table 3 Selectivity and permeability of membrane 3:1 at different pyrolysis temperatures at feed pressure of 5 bar
| Pyrolysis temperature (°C) |
Permeance (GPU) |
Selectivity H2/CH4 |
| Hydrogen |
Methane |
| 300 |
470.64 |
16.74 |
28.11 |
| 350 |
468.11 |
16.19 |
28.92 |
| 400 |
467.44 |
15.95 |
29.30 |
| 450 |
465.33 |
15.86 |
29.34 |
| 500 |
459.24 |
14.65 |
31.34 |
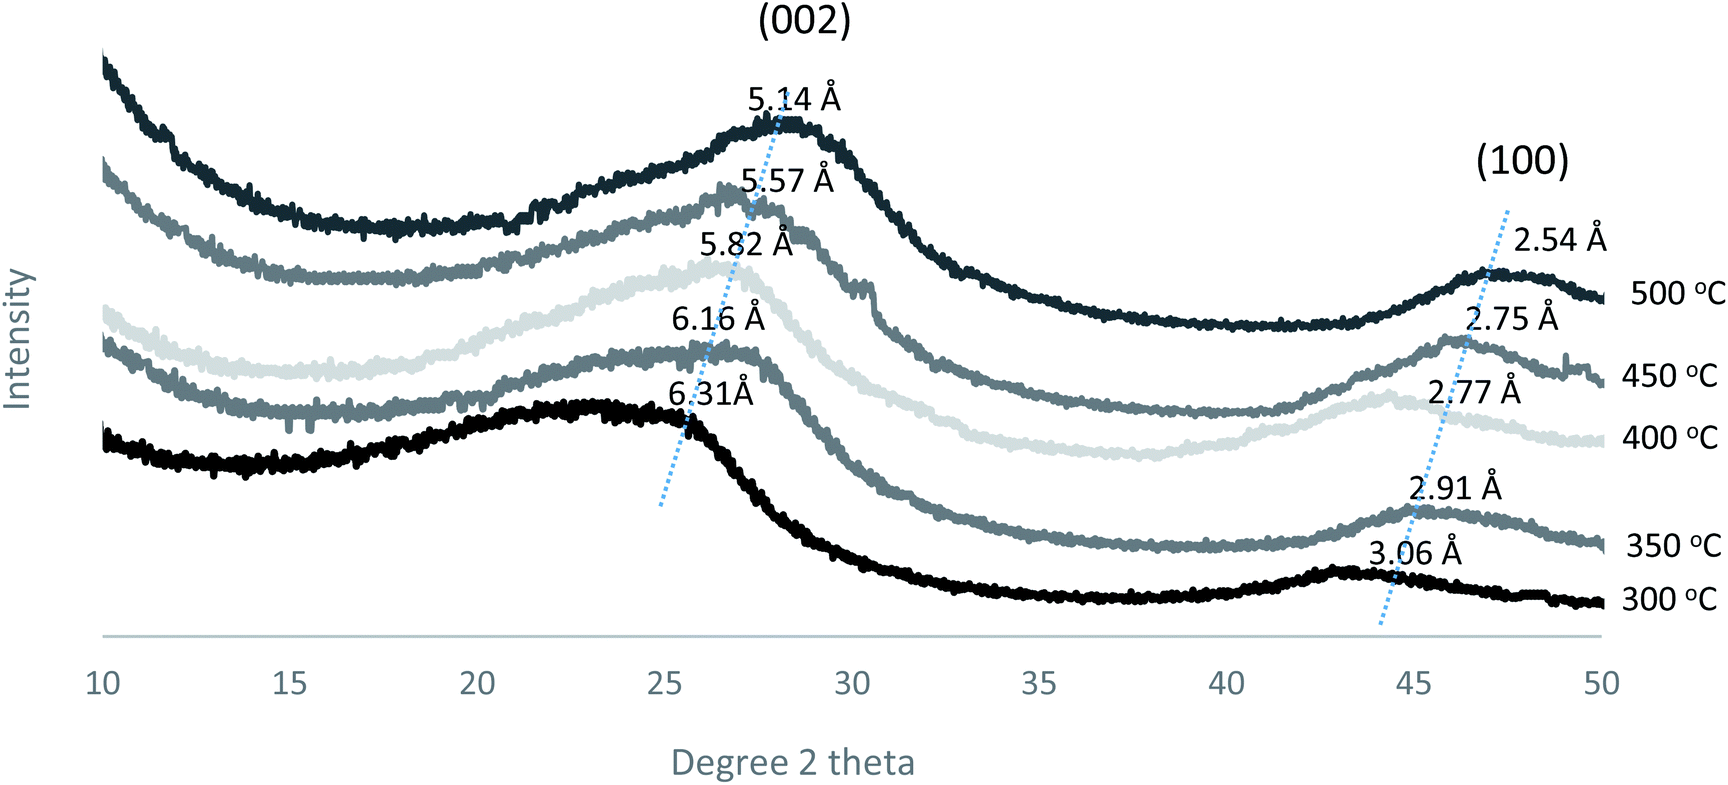
Furthermore, the d-spacing of the prepared membranes at different pyrolysis temperatures was estimated from Bragg's formula (d = λ/2sinθ) as shown in Fig. 10. The d-spacing values decreased gradually from 6.31 to 5.14 Å as the pyrolysis temperature increased, indicating the formation of a compact carbon structure.18 Also, the (002 and 100) peaks became sharper and narrower as the pyrolysis temperature increased, indicating that the formation of an ordered structure occurred at the higher temperatures.
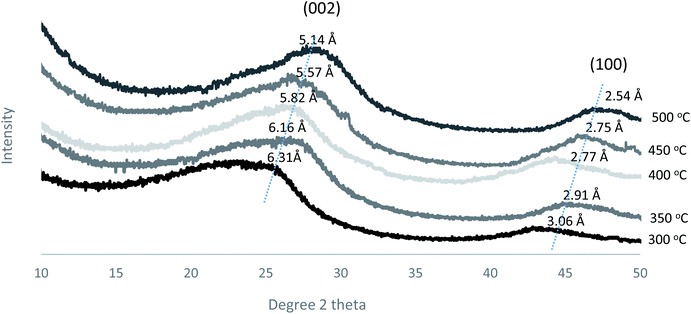 |
| | Fig. 10 XRD patterns of carbon membranes prepared at different pyrolysis temperatures. | |
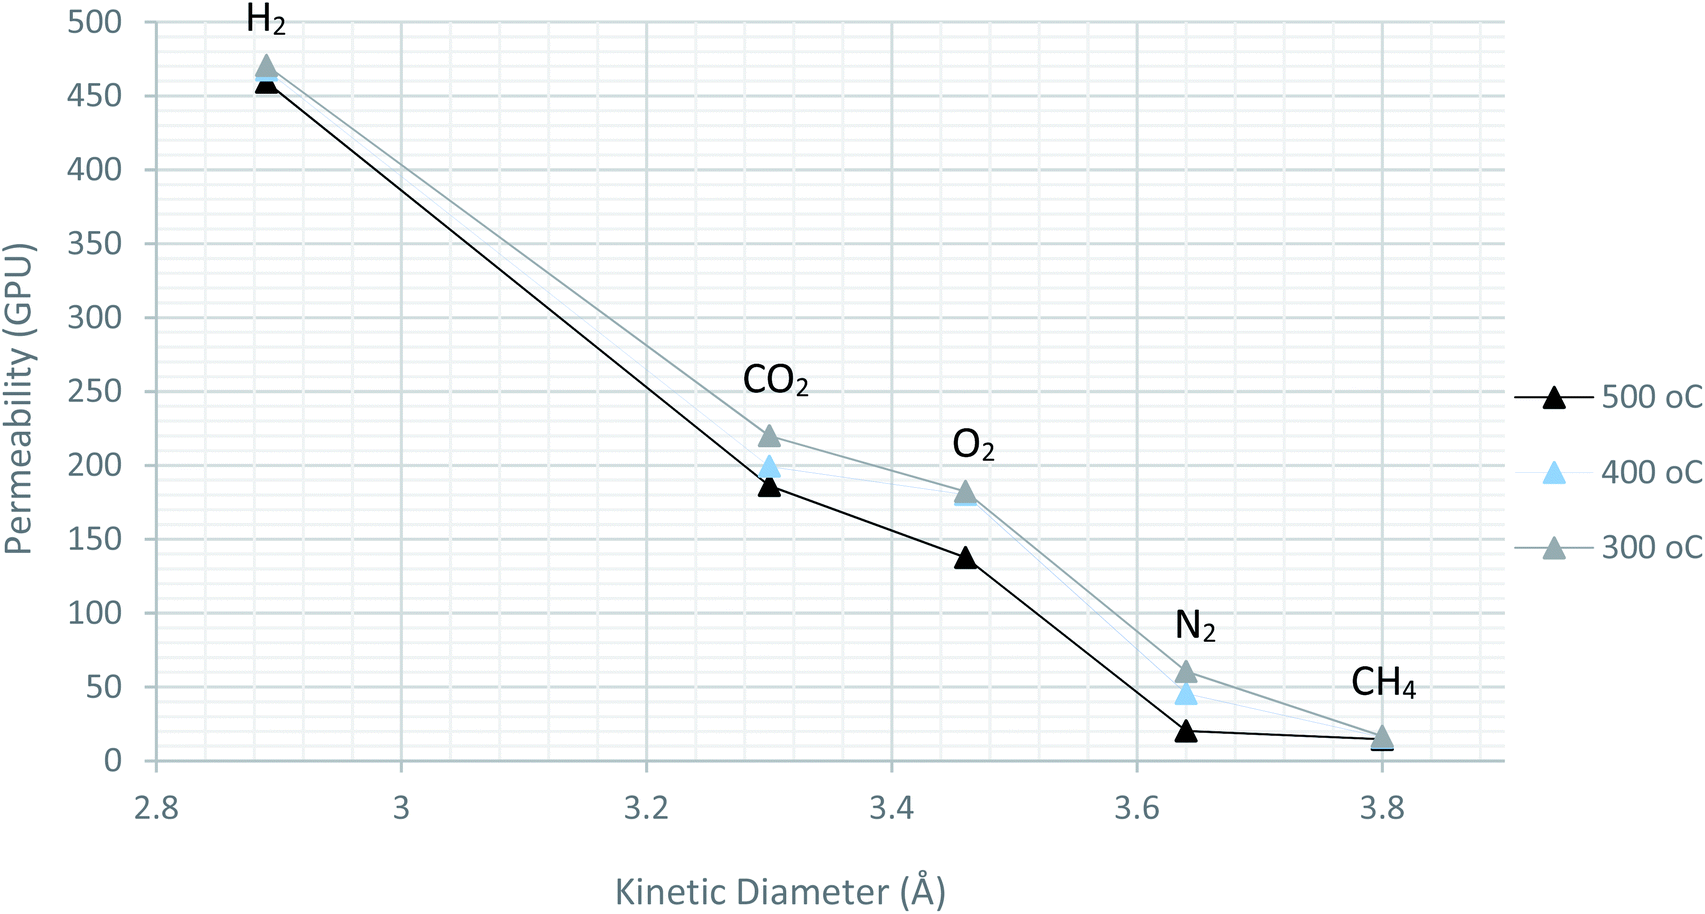
In order to determine the permeation mechanism, other pure gases with different kinetic diameter were subjected for evaluation using the prepared membranes with pyrolysis temperature of 300, 400 and 500 °C. As shown in Fig. 11, the permeability trend was decreasing with increasing the kinetic diameter of the pure gases. This indicates the faster movement of the gases with smaller size molecules across the membrane than the bigger ones. This can be referred to molecular sieving mechanism, rather than Knudsen diffusion.
 |
| | Fig. 11 The dependency of pure gas permeability on Kinetic diameter of penetrant molecules. | |
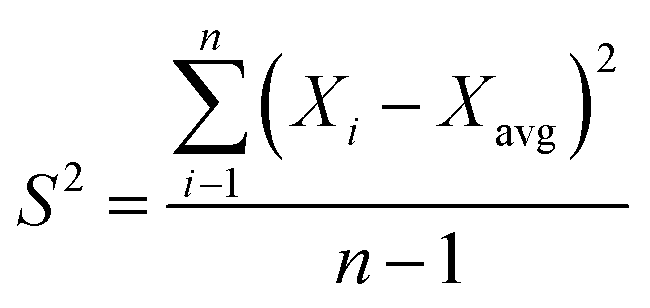
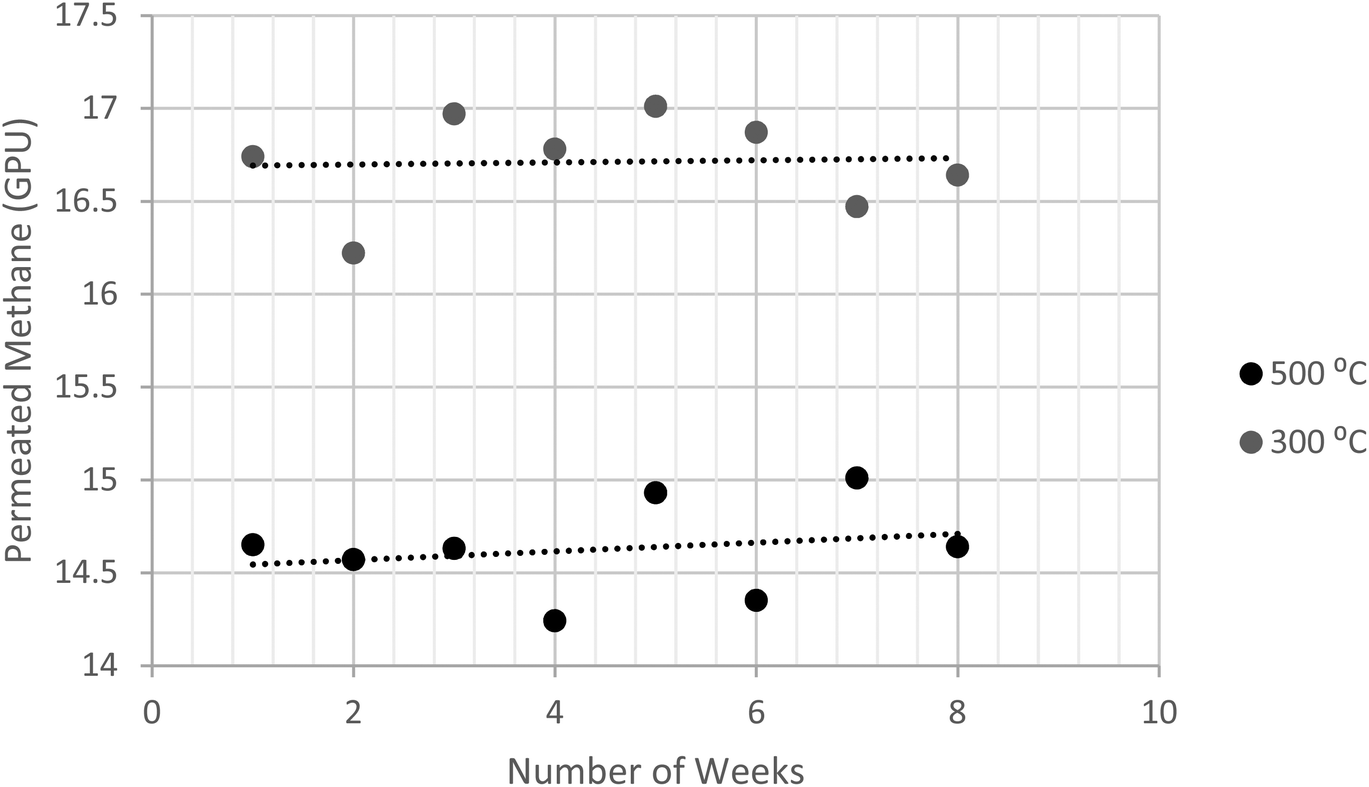
The durability of the dip-coated carbon membrane was tested and assessed. The 3:1 membranes prepared at 300 °C and 500 °C were subjected to the CH4 feed at 5 bars. The durability/repeatability test was conducted for four hours at different intervals. Fig. 12 shows that the preparation method of fabricating carbon membranes, which was introduced in this study, yielded a stable performance. This was estimated using the deviation in the data variances (S2), as shown in eqn (3). The membranes were permeating CH4 within variances of 0.031 and 0.034 for 300 °C and 500 °C, respectively. Since the other concentrations were prepared using the same procedure, they were expected to have similar behaviors.
| |
 | (3) |
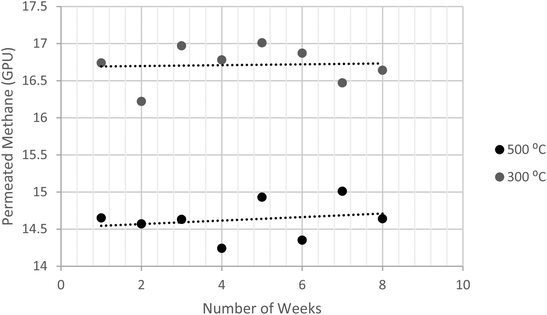 |
| | Fig. 12 Illustration of permeated methane at different intervals, using of dip-coated membrane at 5 bar. | |
Conclusion
The work presented in this study resulted in the development of a method that can be used to utilize simple sucrose as a membrane precursor. The fabrication of a carbon membrane using a sucrose precursor was achieved successfully at a relatively low pyrolysis temperature for H2/CH4 separation. This was accomplished by exploring two precursor treating methods, i.e., the surface-painting method and the dip-coating method. Both of these preparation methods produced selective membranes. However, the dip-coating method yielded a membrane with a better selectivity than the surface-painting method due the improved coverage of the carbon that formed on the stainless steel support. The dip-coated membranes that were prepared at 500 °C with 3:1 sucrose-to-water concentrations yielded a selectivity of 31.34 and an H2 permeability of 459 GPU. Also, the pyrolysis temperature is important in determining the performance of the membrane that is produced, as indicated by the observation that the selectivity of the carbon membrane was improved slightly by increasing the pyrolysis temperature. This can be related to the fact that higher pyrolysis temperatures lead to higher crystallinities and lead to the formation of dense and narrow spacing of the carbon layers, resulting in a structure with small pore sizes. That would eventually lead to the formation of dense structures that minimize the existence of pinholes or defects on the surface. As for the permeate mechanism, molecular sieving is concluded to be the dominant mechanism, rather than Knudsen diffusion, by comparing the permeability of different gases i.e., H2, CO2, O2 N2 and CH4. The dip-coated membranes obtained from this work had greater selectivity than the carbon membranes prepared by Chen et al. using a glucose precursor,19 but more selective carbon membranes using polymeric precursors have been reported in the literature.20–23 Yet, the main objective of this study was to use sucrose as the precursor compound in order to avoid the use of the expensive and hazardous solvents involved in preparing these conventional precursors. In addition, the performance of the dip-coated carbon membranes presented in this work was better than the polymeric membranes prepared in our previous study in terms of selectivity and permeability using the same evaluation unit.17 In summary, the method described in this study avoids the lengthy process and the toxic solvents involved in the conventional precursors and preparation methods. Therefore, the work presented in this study is a step forward in the preparation of carbon membranes, and it should be beneficial in the future development of carbon membranes.
Conflicts of interest
There are no conflicts to declare.
References
- R. Baker, Membrane technology and applications, Hoboken, N.J., Wiley, 2013 Search PubMed.
- H. Strathmann, L. Giorno, and E. Drioli, Introduction to membrane science and technology, Wiley-VCH Verlag and Company, 2011 Search PubMed.
- A. Ismail and L. David, A review on the latest development of carbon membranes for gas separation, J. Membr. Sci., 2001, 193(1), 1–18 CrossRef CAS.
- H. Haryadi, Structural and Transport Properties of Hybrid Organic Inorganic Silica Membranes, IPTEK The Journal for Technology and Science, 2007, 18(2), 74–80 CrossRef.
- N. Gnusin, Mathematical model of electrodiffusion transfer through three-layer membrane system: Diffusion layer-ion-exchange membrane-diffusion layer, Russ. J. Electrochem., 2009, 45(10), 1149–1155 CrossRef CAS.
- C. Anderson, S. Pas, G. Arora, S. Kentish, A. Hill and S. Sandler, et al., Effect of pyrolysis temperature and operating temperature on the performance of nanoporous carbon membranes, J. Membr. Sci., 2008, 322(1), 19–27 CrossRef CAS.
- A. Ismail, Carbon-based membranes for separation processes, Springer, 2014 Search PubMed.
- M. Yoshimune and K. Haraya, CO2/CH4 Mixed Gas Separation Using Carbon Hollow Fiber Membranes, Energy Procedia, 2013, 37, 1109–1116 CrossRef CAS.
- M. Van Koten, A. Seive and W. Stork, Process for preparing a large-pore molecular sieve, Zeolites, 1997, 18(1), 89 CrossRef.
- N. Sazali, W. Salleh, M. Nur Izwanne, Z. Harun and K. Kadirgama, Precursor Selection for Carbon Membrane Fabrication: A Review, Journal of Applied Membrane Science & Technology, 2018, 22(2), 132–140 Search PubMed.
- C. Liang, G. Sha and S. Guo, Carbon membrane for gas separation derived from coal tar pitch, Carbon, 1999, 37(9), 1391–1397 CrossRef CAS.
- E. Echeverria and T. Humphreys, Involvement of sucrose synthase in sucrose catabolism, Phytochemistry, 1984, 23(10), 2173–2178 CrossRef CAS.
- V. Linkov, R. Sanderson and E. Jacobs, Highly asymmetrical carbon membranes, J. Membr. Sci., 1994, 95(1), 93–99 CrossRef CAS.
- N. Tanihara, H. Shimazaki, Y. Hirayama, S. Nakanishi, T. Yoshinaga and Y. Kusuki, Gas permeation properties of asymmetric carbon hollow fiber membranes prepared from asymmetric polyimide hollow fiber, J. Membr. Sci., 1999, 160(2), 179–186 CrossRef CAS.
- A. Alomair, S. Al-Jubouri and S. Holmes, A novel approach to fabricate zeolite membranes for pervaporation processes, J. Mater. Chem. A, 2015, 3(18), 9799–9806 RSC.
- A. Lua and J. Su, Effects of carbonisation on pore evolution and gas permeation properties of carbon membranes from Kapton® polyimide, Carbon, 2006, 44(14), 2964–2972 CrossRef CAS.
- Y. Alqaheem, A. Alomair, A. Alhendi, S. Alkandari, N. Tanoli and N. Alnajdi, et al., Preparation of polyetherimide membrane from non-toxic solvents for the separation of hydrogen from methane, Chem. Cent. J., 2018, 12(1), 4–7 CrossRef PubMed.
- W. Watt, Polymeric carbons — Carbon fibre, glass and char, Polymer, 1977, 18(6), 640 CrossRef.
- X. Chen, J. Eugene Chong, Z. Celine Fah and L. Hong, Glucose-derived carbon molecular sieve membrane: An inspiration from cooking, Carbon, 2017, 111, 334–337 CrossRef.
- C. Jones and W. Koros, Carbon molecular sieve gas separation membranes-I. Preparation and characterization based on polyimide precursors, Carbon, 1994, 32(8), 1419–1425 CrossRef CAS.
- W. Wei, G. Qin, H. Hu, L. You and G. Chen, Preparation of supported carbon molecular sieve membrane from novolac phenol–formaldehyde resin, J. Membr. Sci., 2007, 303(1–2), 80–85 CrossRef CAS.
- X. Ning and W. Koros, Carbon molecular sieve membranes derived from Matrimid® polyimide for nitrogen/methane separation, Carbon, 2014, 66, 511–522 CrossRef CAS.
- S. Kazama and M. Sakashita, Gas separation properties and morphology of asymmetric hollow fiber membranes made from cardo polyamide, J. Membr. Sci., 2004, 243(1–2), 59–68 CrossRef CAS.
|
| This journal is © The Royal Society of Chemistry 2019 |
Click here to see how this site uses Cookies. View our privacy policy here. 
 Open Access Article
 This Open Access Article is licensed under a Creative Commons Attribution-Non Commercial 3.0 Unported Licence
 *a,
Yousef Alqaheem
*a,
Yousef Alqaheem