 Open Access Article
Ethylene glycol coated nanoceria protects against oxidative stress in human lens epithelium†
Belal I. Hanafy ,
Gareth W. V. Cave
 ,
Yvonne Barnett
 and
Barbara Pierscionek
 *
*
School of Science and Technology, Nottingham Trent University, Clifton Lane, Nottingham NG11 8NS, UK. E-mail: barbara.pierscionek@ntu.ac.uk
First published on 28th May 2019
Abstract
Chronic diseases are rising in incidence and prevalence because of increases in life expectancy in many parts of the world coupled with advances in medicine which manage disease progression, rather than curing and alleviating the causes. Cataract is one such chronic condition. Identifying a therapeutic intervention that is successful in reversing or preventing cataracts may have applications for other chronic diseases of protein misfolding, such as diabetes and Alzheimer's disease as these have similar causation factors, notably oxidative stress and/or glycation. Cerium oxide nanoparticles (nanoceria) which have antioxidant, radioprotective and enzyme-mimetic properties have the potential to lead to an effective non-surgical treatment. However, nanoceria stability in physiological media is poor thus hindering their effective use in biomedical applications. Here we report a highly efficient one-pot synthesis of nanoceria (2–5 nm) coated with ethylene glycol, that is colloidally stable in physiological media and exhibits multiwavelength photoluminescence. The formulation, up to concentrations of 200 μg ml−1, was not toxic to human lens epithelial cells and had no adverse effect on the cellular morphology or proliferation rate. More significantly, these nanoceria showed protective effects against oxidative stress induced by hydrogen peroxide in lens epithelial cells. Electron microscopy studies show the internalization and cytoplasmic localization of the nanoceria was found to be largely in the perinuclear region.
Introduction
A major cause of chronic diseases that are exacerbated by ageing are changes in protein structure that lead to malfunction of tissues, organs and, ultimately, the organism. These are conditions such as diabetes, Alzheimer's disease and cataracts.1,2 The latter can occur as solely ocular, or as a secondary manifestation of a systemic condition.3 This presents the opportunity of using cataracts as a model for investigating the causal factors of visual impairment and to gain insight into causal factors that underpin systemic protein-based diseases. Cataract is an opacification of the eye lens that prevents light from reaching the retina by either scattering or absorbing traversing rays. It is the leading cause of blindness worldwide with over 24 million cases in the United States reported in 2010 which is expected to double by 2050.4 Cataracts is a multifactorial disease with oxidative stress considered to be one of the major factors contributing to its development.3,5–9 The human lens possesses natural defence mechanisms against reactive oxygen species (ROS) including the presence of reduced glutathione and antioxidant enzymes such as superoxide dismutase and catalase.8 With ageing, such defences weaken, rendering the cells prone to oxidative insult that can lead to post-translational modifications and aggregation of lens proteins (crystallins) eventually causing cataracts.3,8,9 Human lens epithelial cells (HLECs) are the stem cells of the lens that differentiate into fibre cells forming the lens body. Oxidative stress induced damage to the lens epithelial cells would result in faulty protein synthesis and aggregation that eventually would cause lens opacity.10 As such the use of HLECs as an in vitro model has become important to draw conclusions on cataracts progression. Currently, surgical extraction of the cataractous lenses and replacement by intraocular implants is the only approved treatment. This comes with limitations such as accessibility in the developing world and the associated perioperative and postoperative complications.11 Additionally, to date there is no single implant model that can replicate the image quality and the capacity to alter focus of the biological lens.12 The annual cost associated with cataracts surgeries in the US is estimated to be around $6.8 billion. This is expected to increase as the average population age increases.13 As such, there is a growing interest in developing a therapeutic means of reversing, or at least halting, the progression of cataracts.Cerium oxide is a rare earth metal oxide with multiple applications in diverse products such as solar cells,14 oxygen sensors,15 catalysis,16 UV filters,17 and polishing.18 Cerium oxide (CeO2) nanoparticles or “nanoceria”, have shown potential for the treatment and prevention of various disorders including cancers,19 inflammatory diseases,20 neurodegenerative disorders,21 retinopathy,22 and cardiovascular dysfunctions.23 The therapeutic effects of nanoceria are attributed to their antioxidant properties and their ability to eliminate ROS,24 and are therefore promising candidates for treatment of cataracts and associated systemic conditions. The antioxidant attributes of nanoceria originate from the presence of crystal defects and their associated oxygen vacancies allowing cerium atoms to co-exist in and transition between trivalent and tetravalent states (Ce3+ and Ce4+), a transition that is dependent on the ambient environment.25,26 This antioxidant mechanism is distinct from other molecular antioxidants for two main reasons. First, CeO2 can deactivate free radicals without being transformed into a free radical itself. Secondly, the particles can recycle themselves in an ambient environment regenerating their antioxidant properties in the process.25,27 Importantly, nanoceria have manifested the ability to mimic the activity of key enzymatic antioxidants, such as that of superoxide dismutase (SOD) by reducing superoxide (O2−) to H2O2 as cerium transitions from Ce3+ to Ce4+,28 and the subsequent oxidization of H2O2 into innocuous oxygen as cerium reverts to its (III) oxidation state.29,30 Nanoceria have previously been found to prevent retinal degeneration in rats,31 and preliminary genotoxicity studies have shown that negatively charged nanoceria do not induce DNA damage in HLECs.32
Despite the therapeutic potential nanoceria hold, their poor stability in physiological media is still challenging. Nanoceria are highly susceptible to aggregation and subsequent sedimentation in biological media.33 The aggregation is believed to be caused by the presence of surface defects that increase with particle size reduction.19 A formulation with poor colloidal stability results in the sedimentation of the nanoparticles in physiological media, consequently leading to the exposure of cellular monolayers to a higher concentration than the stated bulk concentration, and so compromising the reliability of in vitro experiments.34 Efficient dispersion of nanoparticles in media is therefore of paramount importance to draw accurate conclusions about the biological effects of the employed nanoparticle concentrations. Coating nanoceria with different materials improves colloidal stability.33 However, this is often accompanied by drastic changes in particle size, the use of biologically incompatible coatings, organic synthesis routes, in addition to the lack of sufficient colloidal stability data.33,35
In this study, we describe the successful formulation and characterization of aqueously monodisperse nanoceria coated with ethylene glycol and ethylene glycol acetates (EGCNPs) using a simple and aqueous one pot precipitation reaction. Cerium(III) acetate hydrate was employed as a precursor to provide the reaction with acetate ligands that bind to ethylene glycol forming a hybrid coat of ethylene glycol and its acetate derivatives with high polarity. The formulation has superior colloidal stability in aqueous solution and the nanoparticles were readily dispersible from dried powder with mild agitation. We have demonstrated that EGCNPs are safe in HLECs at the concentrations required to provide significant in vitro protection against oxidative stress. The work described here indicates potential for nanoceria to be an anti-cataractogenic treatment.
Experimental
Synthesis of ethylene glycol-coated cerium oxide nanoparticles (EGCNPs)
EGCNPs were formulated using the alkaline precipitation method with modifications.33,36 Briefly, cerium(III) acetate hydrate (20 mmol, 6.3 g, Sigma Aldrich), ethylene glycol (10 ml, 99.99%, Fisher Scientific), and HCl (0.2 ml, 1 M) were added to distilled water (100 ml), and left to homogenize (15 min at 40 °C). Ammonia solution (35%, Fischer Scientific) was then added dropwise until the pH reached 9.6. The initial buff coloured precipitate turned dark purple after stirring (ca. 10 min). The reaction was left stirring for 2 hour and the colour changed to yellow. The reaction mixture was diluted with ethanol (50 ml), and the precipitate was then collected by centrifugation (3000 rpm, 5 min), washed several times with distilled water and ethanol and left to dry in an oven at 60 °C. After drying, the precipitate was ground into fine powder and stored in an airtight container. Europium-doped nanoceria (EuCNPs) were synthesized as above by adding europium nitrate (99.99%, Sigma Aldrich) to the reaction mixture with a Ce![[thin space (1/6-em)]](https://www.rsc.org/images/entities/char_2009.gif) :
:![[thin space (1/6-em)]](https://www.rsc.org/images/entities/char_2009.gif) Eu molar ratio of 1
Eu molar ratio of 1![[thin space (1/6-em)]](https://www.rsc.org/images/entities/char_2009.gif) :
:![[thin space (1/6-em)]](https://www.rsc.org/images/entities/char_2009.gif) 0.2.37
0.2.37
EGCNPs characterization
Transmission electron microscopy (JeoL-2010, Tokyo, Japan) was used to determine the morphology and particle size. The crystalline structure of nanoceria was confirmed by powder X-ray diffraction (X'Pert PRO, PANalytical) and the crystallite size was calculated by applying the Scherrer equation. The colloidal stability and surface charge in different media were studied by dynamic light scattering (NanoPlus, Particulate Systems). Excitation and emission spectra were recorded using a spectrofluorometer (Clariostar, BMG LABTECH). The composition of the coating was confirmed by thermogravimetric analysis (TGA 4000, PerkinElmer) connected to a GC-MS system (GC Clarus 580 – MS Clarus SQ 8 S, PerkinElmer). Detailed experimental conditions are provided in the ESI.†Cell culture
Human lens epithelial cells (HLECs) B3 (ATCC® CRL11421™) were grown in Eagle's minimum essential media (EMEM) (ATCC® 30–2003) supplemented with foetal bovine serum (20%, Scientific Lab Supplies), penicillin (100 IU ml−1) and streptomycin (0.1 mg ml−1). Cells were incubated at 37 °C and 5% CO2 in a humidified environment. All experiments were conducted on cells in the logarithmic growth phase.Live cell imaging and cell membrane integrity
The effect of different EGCNPs concentrations on the cytotoxicity, proliferation and morphological features of HLECs was observed using real-time live cell analysis. Cells were seeded in 6-well plates at a seeding density of 1 × 10⁵ cells per well in completed growth media (5 ml) and immediately treated with different concentrations of EGCNPs (0, 50, 100, 200, 400 μg ml−1). This was conducted in the presence of Incucyte Cytotox red for counting dead cells (250 nM, Essen Bioscience), a cyanine nucleic acid dye that only permeates cells with compromised cell membranes. Three fields of view were imaged in each well, with a 10× objective every three hours over four days using the Incucyte S3 Live Cell Analysis System (Essen BioScience) fitted inside an incubator. Confluence percentages and cytotoxicity levels were calculated using the integrated Incucyte S3 software.Cell viability of human lens epithelial cell line after EGCNPS exposure (MTT assay)
HLECs were seeded in 96-well plates with a seeding density of 5000 cells per well in 200 μl growth media. The cells were left to recover from handling for 24 hours before treatment. Media were then gently aspirated and replaced with fresh media containing different concentrations of EGCNPs. The tested EGCNPs concentrations were 0, 100, 200, 400, 600, 800, 1000 μg ml−1 with four wells per condition. After treatment durations (24 h or 48 h), 20 μl of MTT solution 3-(4,5-dimethylthiazol-2-yl)-2,5-diphenyltetrazolium bromide, 5 mg ml−1 in PBS (Sigma Aldrich) were added to each well to reach a final concentration of 0.5 mg ml−1 and cells were incubated at 37 °C for 2 hours. After incubation, the MTT solution was gently aspirated and 200 μl dimethyl sulfoxide (DMSO) were added to each well and left on a plate shaker for 10 minutes protected from light to solubilize the formazan crystals. Absorbance readings were taken at 570 nm using a plate reader (Clariostar, BMG LABTECH).Protective effect against oxidative stress
The effect of EGCNPs on oxidative stress levels in HLECs after H2O2 exposure was investigated using 2′,7′-dichlorodihydrofluorescein diacetate (H2DCFDA) staining (D399, ThermoFisher) according to supplier's instructions. Briefly, cells were seeded in 96-well plates as before, established for 24 h, then pre-treated with different EGCNPs concentration (0, 50 and 100 μg ml−1) for 24 h. After treatment period, media was removed, and cells were washed with PBS and replaced with complete media containing H2O2 (100 μM) for 1 h. Media was then removed, washed once with PBS, and cells were incubated in H2DCFDA solution (10 μM in PBS) for 30 min at 37 °C. Cells were then washed with PBS and 200 μl PBS was added to each well. DCF fluorescence intensity was measured using a plate reader (TECAN infinite 200 PRO) at excitation 495 nm/emission 529 nm.Uptake and localization studies
Cells were grown to 70% confluence in full growth media on cover slips in 6-well plates and then treated with 200 μg ml−1 EGCNPs and incubated for one minute, 4 and 24 hours. After each treatment duration, media were aspirated, and the cell monolayers washed with serum free media followed by fixation in 4% paraformaldehyde in PBS buffer for 15 minutes. Cells were then washed three times with PBS and dehydrated in graded alcohol solutions (50%, 60%, 70%, 80%, 90% and 100% ethanol) for five minutes each. The specimens were coated with gold (5 nm) using a sputter coater (Q150R ES, Quorum) and visualized under SEM (JEOL, JSM-7100f) with accelerating voltage (10 kV) and probe current (10 mA). EDX spectra were collected in at least ten different cell compartments using Aztec software (Oxford Instruments). Details of confocal imaging of EGCNPs and EuCNPs are available in ESI.†Statistical analysis
Each experiment was conducted at least three times (n ≥ 3). Statistical analysis was carried out using GraphPad prism 7 software. Where relevant, analysis of variance (one-way ANOVA) followed by Dunnett's multiple comparisons test was used to compare groups with statistical significance set at p < 0.05.Results & discussion
EGCNPs characterization
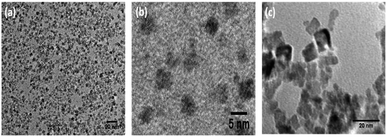
Ethylene glycol has the ability to complex with Ce3+ ions, making the reaction homogenous for the ensuing ammonia precipitation step.33,38 Coating nanoceria with ethylene glycol starting from a nitrate was previously reported to produce relatively large particle sizes (>10 nm) and significant polydispersity due to aggregation in both water and cell media that adversely impact biomedical applications.33 The ability to produce water dispersible ultra-small (<5 nm) nanoceria is desirable as size reduction increases ROS deactivation capacity and regenerative properties29,39 and provides better penetration into the cells than larger sized particles.40Electron microscopic images (Fig. 1a and b) show the nanoparticles to be crystalline with core sizes ranging from 2–5 nm and an average size of 4.0 nm ± 0.8 nm. The images show mosaic-like patterns of monodisperse and well-separated nanoparticles. This is caused by the presence of ethylene glycol which appears as transparent coronae in the TEM image because of its low electron density compared to electron-rich cerium oxide cores. Non-coated nanoceria exhibited larger particle sizes (7–13 nm) with significant aggregation and lack of uniformity, highlighting the role of ethylene glycol coating in stabilizing the synthesis (Fig. 1c). Powder XRD data confirmed the cubic fluorite crystalline structure of cerium(IV) oxide (CeO2) which was in agreement with the structure reported in the literature (JCPDS 75–0390). The characteristic 2θ diffraction peaks at 28.4, 33.3, 47.3, 56.12 correspond to the (111), (200), (220), and (311) planes respectively, and are annotated on the diffractogram (Fig S1a, ESI†). The peaks were significantly broader than non-coated nanoceria which is indicative of smaller crystallite size.28 The crystallite size, calculated by applying the Scherrer equation on (111) diffraction peak, was 3.5 nm. This is close to the average particle size calculated from TEM images (4 nm).
The nature of the surface coating is shown in Fig. 2. Two main regions of weight loss were observed. The initial weight loss (10%) detected at 150 °C was attributed to loss of residual water and the outermost layer of the coating, while the second weight loss (20%) indicated full decomposition of the coating from 200–700 °C. Mass spectroscopic data revealed that the coating was a mixture of three compounds; ethylene glycol, ethylene glycol monoacetate and ethylene glycol diacetate. The additional carbonyl groups conferred by the acetate ligands on the surface of the nanoparticles play an important role in the aqueous stability of nanoceria through hydrogen bonding with water molecules. Additionally, longer surface ligands are generally associated with enhanced stability of the nanoparticles through the steric hindrance effect.41,42
 | ||
| Fig. 2 Thermogravimetric analysis (TGA) of EGCNPs showing two main weight loss regions. The decomposed coating was separated by gas chromatography and analysed by mass spectrometry. The arrow indicates the time at which GC-MS analysis was triggered. Chromatogram peaks at 2.1, 3.1 and 4.5 min correspond to ethylene glycol, ethylene glycol monoacetate and ethylene glycol diacetate respectively (mass spectra are available in ESI†). | ||
The presence of ethylene glycol surface coating was confirmed not to interfere with the antioxidant and auto-regenerative properties of nanoceria by testing EGCNPs reactivity with H2O2. Transitions between Ce3+ and Ce4+ were marked by colour change of EGCNPs solution and a corresponding shift in UV absorbance spectra (Fig S5, ESI†).25,27
FTIR spectra (Fig S1b, ESI†) confirmed the structure of EGCNPs and this concurs with findings reported in the literature.43 The presence of ethylene glycol coating was indicated by the presence of two characteristic peaks corresponding to methylene (CH2) stretching at 2950 and 2850 cm−1 and a very broad peak at 3400 cm−1 corresponding to (O–H) stretching.33 The (O–H) stretching band was significantly prominent compared to a non-coated formulation indicating that the band pertains to additional (OH) groups from ethylene glycol and does not primarily arise from moisture adsorption on the surface.44 The UV-vis spectrum for EGCNPs aqueous dispersion showed a strong absorption peak at <299 nm (Fig. S1c, ESI†) signifying the presence of Ce3+ the surface of the nanoparticles. Ce3+ is known to absorb light between 230–260 nm while Ce4+ absorbs light in the region of 300–400 nm.19 A typical nanoceria crystal contains cerium predominantly in its oxidized state (Ce4+). As the crystal size decreases, surface defects associated with oxygen vacancies arise, increasing Ce3+ at the surface. The Ce4+/Ce3+ ratio is critical in determining the mechanism by which nanoceria scavenge for ROS.29 The elemental composition of EGCNPs was confirmed by energy dispersive X-ray spectroscopy (EDX) (Fig. S1d, ESI†).
Colloidal stability and sterilization
The intensity weighted mean hydrodynamic diameter (Z-average), polydispersity index (PDI) and zeta potential of EGCNPs are summarized in Table 1.| Media | Z-average (nm) | PDI | Zeta (mV) |
|---|---|---|---|
| (1) Distilled water | 21.8 ± 0.6 | 0.28 | +44.1 |
| (2) DMEM + FBS (20%) | 128.7 ± 9.2 | 0.17 | −9.7 |
| (3) 0.9% saline | 158.1 ± 20.6 | 0.24 | +14.0 |
In all tested media, EGCNPs showed unimodal distribution of mean hydrodynamic diameters. The hydrodynamic diameter was the smallest in water (21.86 nm) and increased significantly in other media while maintaining monodispersity. This was demonstrated by small PDI values (Table 1). The increase in hydrodynamic diameter in serum-containing DMEM can be attributed to the adsorption of a thin layer of serum proteins on the surface of particles forming a corona that contributes to its overall measured hydrodynamic diameter.45,46 The association of surface proteins was reflected in the surface charge of the nanoceria and its inversion to a negative value.47 Serum proteins are negatively charged at physiological pH and hence their accumulation on the surface alters the nanoparticle zeta potential.48 In saline solution, the increase in hydrodynamic diameter was expected as high salt concentrations are known to shield the electrical field around nanoparticles reducing the electrostatic repulsion and causing agglomeration.49 This is clearly manifested in the decrease in positive charge in saline solution compared to the value in water (Table 1). Despite that, the nanoparticles remained well dispersed in all media with no signs of precipitation. The small particle size in water permitted sterilization by filtration through 0.22 μm filters with minimal loss of the nanoparticles (less than 6% loss) as confirmed spectrophotometrically at 300 nm. The amount of EGCNPs lost after sterilization was found to decrease as the volume of filtered solution passing through the same filter increased, suggesting that the loss was due to adsorption on the filter surface.
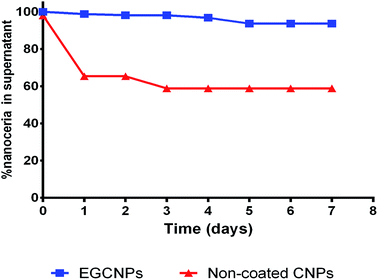
When left to precipitate over one week at room temperature in water, EGCNPs showed a slight loss in the supernatant concentration (6%) over the testing duration. This level of stability was superior to their non-coated counterparts for which a significant loss in supernatant concentration (>35%) was observed after 24 h, highlighting the role of ethylene glycol coating in stabilizing the dispersion (Fig. 3). The previously reported synthesis of ethylene-glycol coated nanoparticles from a nitrate precursor resulted in hydrodynamic diameters of 222 nm and 206 nm in water and RPMI + FBS (10%) respectively, and both exhibited significant polydispersity with bimodal size distribution.33 Moreover, the colloidal stability study of that formulation showed 38% loss of nanoceria content in the supernatant when a dispersion was left to precipitate for 7 days. This could be attributed to better stability and monodispersity of EGCNPs to the reaction initiation from an acetate precursor (as opposed to a nitrate precursor) that reacted with ethylene glycol and formed monoacetate and diacetate ethylene glycol derivatives. These ligands were more stable because steric hindrance prevented aggregation. Additionally, the acetate derivatives provided the coating with carbonyl groups that can form hydrogen bonding in aqueous solvents. To the best of our knowledge, the EGCNPs described here are the simplest aqueously stable nanoceria with a well-defined colloidal stability that can be formulated and stored in a dry powder form.
Photoluminescence and optical properties
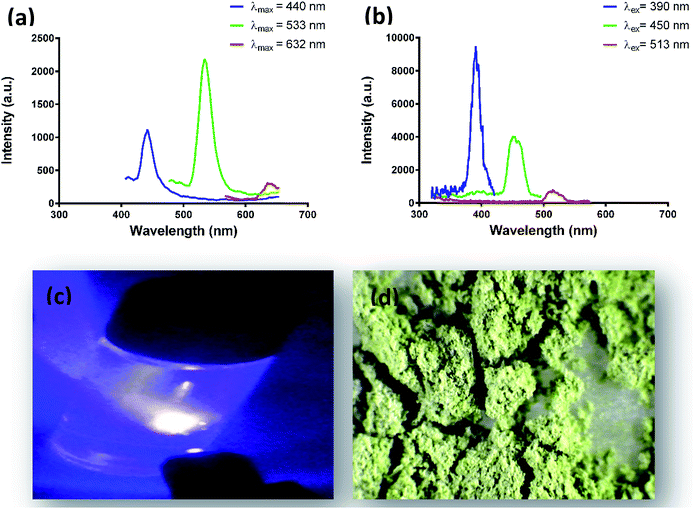
EGCNPs exhibited multi-coloured emissions that extend from the UV to the long wavelength region of the visible spectrum. Fig. 4a and b show the EGCNPs emissions in the short, medium and long wavelength ranges of the visible spectrum when excited with 390, 450 and 513 nm respectively. The short wavelength emission was broad with the peak tail reaching beyond 600 nm (Fig. 4a). Both excitation and emission spectra have sufficient breadth, rendering the detection of nanoparticles highly tunable. In general, the fluorescence is relatively faint and requires strong laser power for excitation. Blue and green emissions were detected in both dispersion and powder forms when excited with the appropriate wavelengths (Fig. 4c and d).When examined with laser scanning confocal microscopy, emissions from EGCNPs powder were detected across the visible spectrum using a single excitation wavelength of 405 nm as shown in Fig. 5. This agrees with the broad emission spectra of EGCNPs after UV excitation (Fig. 4a).
 | ||
| Fig. 5 Confocal images of a cluster of EGCNPs powder upon 405 nm excitation with emissions detected at (a) 450 nm, (b) 550 nm and (c) 630 nm. | ||
The photoluminescent behaviour of nanoceria has been reported in the literature, but findings are not consistent. Krishnan et al. reported multi-coloured fluorescence of organophilic 2–3 nm oleic acid-coated CeO2 nanodots (OACNPs) fabricated by solvothermal decomposition.50 OACNPs dispersed in toluene exhibited blue (λex = 350), green (λex = 405) and red emissions (λex = 532).50 These unique fluorescent properties were attributed to a large number of crystal defects associated with nanoparticle size (2 nm) with a higher Ce3+ to Ce4+ ratio.50 A CeO2 film deposited (80 nm) on a silica substrate was reported to have violet to blue luminescence at 380 nm.51 Nanoceria (2 nm), coated with a double layer of oleic acid prepared by thermal decomposition, were reported to have a broad spectrum with maximum emission at 515 nm with 400 nm excitation.52 To our knowledge, no other study has found that nanoceria prepared by an aqueous precipitation method can exhibit such multi-coloured photoluminescence, nor that nanoceria can be detected using a fluorescent microscope in all visible regions of light spectrum using a single excitation wavelength.
Cell viability, proliferation and morphology
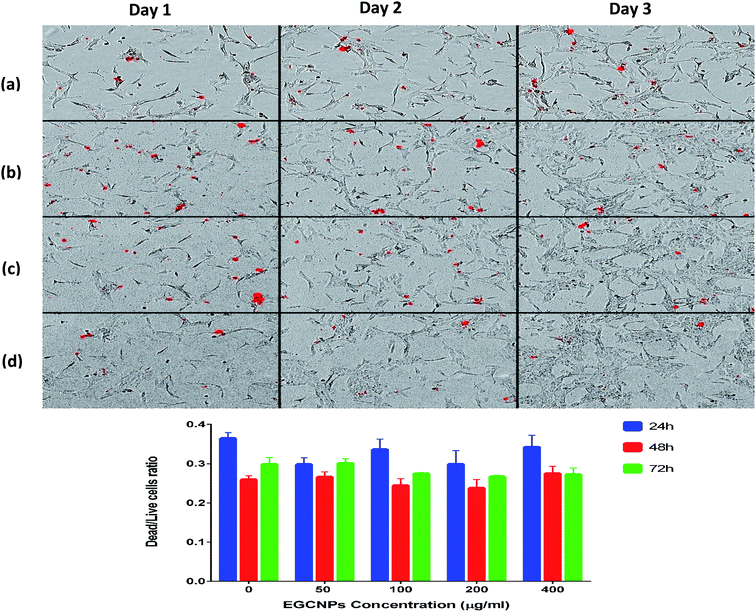
The impact of different concentrations of EGCNPs (0 to 1000 μg ml−1) on cultured HLECs, after 24 h and 48 h exposure in culture media is shown in Fig. 6. EGCNPs with concentrations up to 200 μg ml−1 did not have any significant effect on cell viability, when compared to control cells at the two tested time points (p value < 0.05). However, the 24 h exposure to concentrations of 400 μg ml−1 or higher resulted in a statistically significant decrease in viability ranging from 27% (at 400 μg ml−1) to 40% (1000 μg ml−1). The genotoxicity of negatively charged nanoceria have been previously investigated on HLECs – the durations were longer than in this study but the concentrations were not as high.10,32 Previous studies have shown no cytotoxicity of negatively charged ethylene glycol-coated nanoceria on Jurkat human T-lymphocytes after three days of exposure.33 However, no uptake studies were conducted and hence the lack of cytotoxicity might have been the result of a lack of uptake of the nanoparticles. Poor or lack of internalization of negatively charged nanoceria has been previously found in two normal cell lines; embryonic kidney cells and H9c2 cardiac myocytes.53 The same study showed significant cytotoxicity of positively charged nanoceria (1 mM, 172 μg ml−1) on the same cell lines after 24 hour exposure.53 It is noteworthy that the positive charges on the surface of nanomaterials promote cellular adhesion and penetration owing to the ionic interactions with negatively charged cell surfaces and hence their cytotoxicity is generally expected to be more pronounced compared to negatively charged nanomaterials.54,55 It is possible that the adsorption of negatively charge coronae on the surface of EGCNPs reduced their toxicity by mitigating cell membrane damage normally associated with positive charged nanoparticles.56Fig. 7 shows the proliferation of HLECs incubated with different EGCNPs concentrations (0 to 400 μg ml−1) for three days without media change. All cells with different treatments were able to reach 100% confluence following a similar growth pattern to negative controls. This contrasted with results from the MTT assay that showed a decrease in viability for cells incubated with EGNCPs (400 μg ml−1). The results of further investigation with nucleic acid staining are shown in Fig. 8. No cytotoxicity was observed for concentrations (50–400 μg ml−1) for exposure durations up to 72 h. This could be a result of the 400 μg ml−1 concentration interfering with mitochondrial activity which could in turn have affected the MTT viability.57 Nonetheless, we conclude that EGCNPs concentrations, from 50 to 200 μg ml−1 were safe and had no harmful effect on the morphology, proliferation, and cell membrane integrity of the HLECs after 72 h exposure.
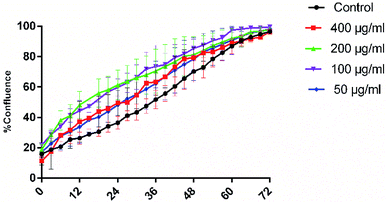 | ||
| Fig. 7 Effect of different EGCNPs concentrations on HLECs proliferation. Cells were imaged in 6-well plates at an interval of 3 hours for 3 days while growing in full growth media using IncuCyte S3 live cell imaging system. Four different spots were imaged in each well. % Confluence was analysed by the integrated IncuCyte software and plotted against elapsed time in hours. Confluence at 0 h indicates the cell density at the point of seeding. All cells reached full confluence by 72 h. Small variations in early stage of growth arise from statistically insignificant variations in the four areas imaged in each well. A time lapse movie of cell growth over 4 days is available in the ESI.† | ||
Protective effects of EGCNPs against ROS in lens cells
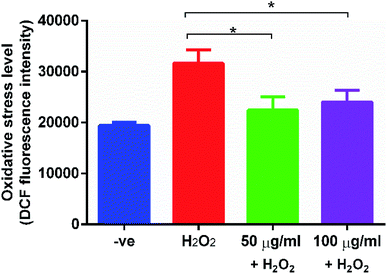
EGCNPs, with predetermined safe concentrations (50 and 100 μg ml−1), were tested for their ability to protect HLECs from oxidative damage induced by H2O2 using H2DCFDA probe. As shown in Fig. 9, the tested EGCNPs concentrations exhibited a significant protective effect compared to non-EGCNPs treated cells demonstrated by the low fluorescence levels in cells pre-treated with EGCNPs. Both concentrations showed a similar level of protection against H2O2-induced oxidative stress. Such protective effect shows that EGCNPs inside the HLECs can exert catalase-like activity where excess H2O2 was deactivated.39 Moreover, cultured cells that were exposed to EGCNPs were able to reach full confluence after three days compared to the positive control in which cell proliferation was significantly halted supporting H2DCFDA assay findings (Fig S6, ESI†).Uptake and localization of EGCNPs in human lens epithelial cells
The cellular localization of nanoparticles plays an important role in their overall toxicity and activity.58 Many factors impact on the uptake of nanoparticles such as particle size, polydispersity, zeta potential and surface coating.Fig. 10 shows the uptake and localization of EGCNPs in HLECs after incubation for 4 h (Fig. 10b) and 24 h (Fig. 10c). EGCNPs entered the cells at significant levels for both tested time points. The nanoparticles were heavily localized in the cytoplasm, mainly in perinuclear regions (Fig. 10b and c). Minimal amounts of nanoceria were detected in the nuclei as confirmed by EDX spectra (Fig S4, ESI†).
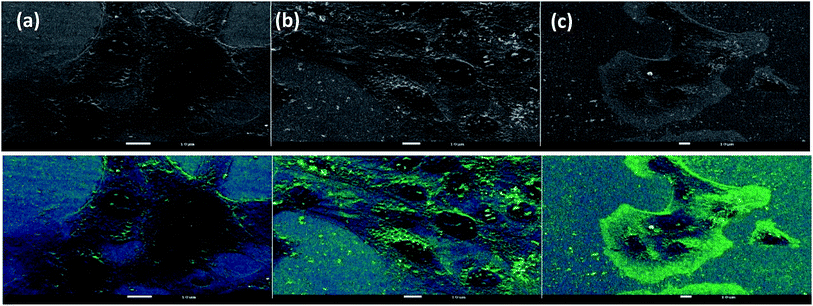 | ||
| Fig. 10 SEM images showing uptake and localization of EGCNPs in HLECs at different time points: (a) 1 min incubation showing no uptake of EGCNPs, (b) EGCNPs uptake and localization after 4 h incubation, (c) EGCNPs uptake and localization after 24 h incubation. Strong uptake was detected at 4 h and 24 h time points with heavy localization around the nuclei as detected by EDX. Areas with most nanoceria localization are distinguished by brightness arising from atomic number contrast of cerium element (Ce atomic number = 58) and hence it gives off more secondary and backscattered electrons. Contrast sensitive pseudocolour was applied simultaneously to the images highlighting nanoceria localization as bright green. EDX spectra are available in the ESI.† | ||
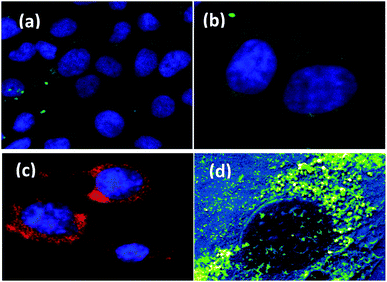
For further validation of SEM-EDX uptake and localization, confocal microscopy experiments were conducted. HLECs exhibited strong autofluorescence in the blue and green regions. Even though the fluorescence of EGCNPs is relatively weak compared to cellular autofluorescence, it can still be tracked inside the cells by taking advantage of the lanthanides ability to resist photobleaching.59 Fig. 11a and b confirm that EGCNPs are predominantly localised in the cytoplasm, specifically in the perinuclear regions. This concurs with SEM data. The images show that some nanoparticles penetrate the nucleus. Such minimal nuclear uptake is likely to have taken place during mitosis where nuclear membrane breaks down.60 To our knowledge this the first time unlabelled nanoceria have been tracked inside the cells.
The EuCNPs exhibited typical strong red emission at 612 nm under multiple excitation wavelengths from UV to end of green region (ranging from 350–550 nm);61 particle size (5 nm) and surface charge (+34.49 mV in water, −2.4 mV in media) were similar to those of EGCNPs. Doping with Europium is preferred over attachment of traditional fluorescent dyes since the latter involves surface modifications that could affect the behaviour of the nanoparticle uptake.62 Characterization of EuCNPs is available in the ESI (Fig S2†). After 24 hour incubation with HLECs, EuCNPs were found in the cytoplasm mainly in the perinuclear region corroborating the previous findings (Fig. 11c). EuCNPs also showed a similar localization pattern to EGCNPs when examined by SEM-EDX (Fig. 11b). It remains to be investigated whether surface charge manipulation may have an impact on the uptake and localization of nanoceria in HLECs cells and its relationship to cytotoxicity and protective behaviour.
Uptake studies show that EGCNPs preferentially reside in the cytoplasm surrounding the nuclei. Such localisation resulted in no cytotoxicity to HLECs and the nanoparticles showed protection against oxidative stress.
Conclusions
A nanoceria formulation coated with ethylene glycol and ethylene glycol acetates (EGCNPs) was successfully formulated using a simple precipitation reaction starting from cerium acetate as the precursor. The formulation has superior aqueous stability and monodispersity in different physiological media allowing for more reliable biological studies with no sedimentation-induced variabilities. EGCNPs were found to be heavily localised in the cytoplasm and provided protection in human lens epithelial cells from H2O2-induced oxidative stress, rendering these particles a potential candidate for an anti-cataracts therapy. Future work is needed to elucidate the mechanism and mode of action of nanoceria within the cellular organelles and their regenerative antioxidant properties if these are to be effective for the treatment of cataracts.Conflicts of interest
There are no conflicts to declare.Acknowledgements
The authors would like to thank Kathryn Kroon for the technical assistance with electron microscopy, and BH acknowledges PhD studentship from Nottingham Trent University.Notes and references
- A. Pollreisz and U. Schmidt-Erfurth, J. Ophthalmol., 2010, 1–8 CrossRef PubMed.
- A. Mukherjee, D. Morales-Scheihing, P. C. Butler and C. Soto, Trends Mol. Med., 2015, 21, 439–449 CrossRef CAS PubMed.
- J. J. Harding, Ageing Res. Rev., 2002, 1, 465–479 CrossRef CAS PubMed.
- NEI charts a clearer future for cataract prevention and treatment, National Eye Institute, https://nei.nih.gov/content/nei-charts-clearer-future-cataract-prevention-and-treatment, accessed 15 November 2018.
- J. Bai, Y. Zheng, G. Wang and P. Liu, Oxid. Med. Cell. Longevity, 2016, 1–12 Search PubMed.
- S. K. Gupta, D. Trivedi, S. Srivastava, S. Joshi, N. Halder and S. D. Verma, Nutrition, 2003, 19, 794–799 CrossRef CAS PubMed.
- Y. Zheng, Y. Liu, J. Ge, X. Wang, L. Liu, Z. Bu and P. Liu, Mol. Vision, 2010, 16, 1467–1474 CAS.
- E. Ganea and J. J. Harding, Curr. Eye Res., 2006, 31, 1–11 CrossRef CAS PubMed.
- R. J. W. Truscott, Exp. Eye Res., 2005, 80, 709–725 CrossRef CAS PubMed.
- B. K. Pierscionek, Y. Li, R. A. Schachar and W. Chen, Nanomedicine, 2012, 8, 383–390 CrossRef CAS PubMed.
- H. Abdelkader, R. G. Alany and B. Pierscionek, J. Pharm. Pharmacol., 2015, 67, 537–550 CrossRef CAS PubMed.
- K. Wang and B. K. Pierscionek, Prog. Retinal Eye Res., 2018 DOI:10.1016/j.preteyeres.2018.11.004.
- H. E. Gollogly, D. O. Hodge, J. L. St. Sauver and J. C. Erie, J. Cataract Refractive Surg., 2013, 39, 1383–1389 CrossRef PubMed.
- A. Corma, P. Atienzar, H. García and J. Y. Chane-Ching, Nat. Mater., 2004, 3, 394–397 CrossRef CAS PubMed.
- N. Izu, W. Shin, I. Matsubara and N. Murayama, J. Electroceram., 2004, 13, 703–706 CrossRef CAS.
- T. Montini, M. Melchionna, M. Monai and P. Fornasiero, Chem. Rev., 2016, 116, 5987–6041 CrossRef CAS PubMed.
- F. Caputo, M. De Nicola, A. Sienkiewicz, A. Giovanetti, I. Bejarano, S. Licoccia, E. Traversa and L. Ghibelli, Nanoscale, 2015, 7, 15643–15656 RSC.
- V. D. Kosynkin, A. A. Arzgatkina, E. N. Ivanov, M. G. Chtoutsa, A. I. Grabko, A. V. Kardapolov and N. A. Sysina, J. Alloys Compd., 2000, 303–304, 421–425 CrossRef CAS.
- E. Alpaslan, H. Yazici, N. H. Golshan, K. S. Ziemer and T. J. Webster, ACS Biomater. Sci. Eng., 2015, 1, 1096–1103 CrossRef CAS.
- S. M. Hirst, A. S. Karakoti, R. D. Tyler, N. Sriranganathan, S. Seal and C. M. Reilly, Small, 2009, 5, 2848–2856 CrossRef CAS PubMed.
- S. Naz, J. Beach, B. Heckert, T. Tummala, O. Pashchenko, T. Banerjee and S. Santra, Nanomedicine, 2017 Search PubMed.
- J. Chen, S. Patil, S. Seal and J. F. McGinnis, Adv. Exp. Med. Biol., 2008, 53–59 CrossRef PubMed.
- F. Pagliari, C. Mandoli, G. Forte, E. Magnani, S. Pagliari, G. Nardone, S. Licoccia, M. Minieri, P. Di Nardo and E. Traversa, ACS Nano, 2012, 6, 3767–3775 CrossRef CAS PubMed.
- C. von Montfort, L. Alili, S. Teuber-Hanselmann and P. Brenneisen, Redox Biol., 2015, 4, 1–5 CrossRef CAS PubMed.
- C. Xu and X. Qu, NPG Asia Mater., 2014, 6, e90 CrossRef CAS.
- N. V. Skorodumova, S. I. Simak, B. I. Lundqvist, I. A. Abrikosov and B. Johansson, Phys. Rev. Lett., 2002, 89 DOI:10.1103/PhysRevLett.89.166601.
- J. M. Perez, A. Asati, S. Nath and C. Kaittanis, Small, 2008, 4, 552–556 CrossRef CAS PubMed.
- C. Korsvik, S. Patil, S. Seal and W. T. Self, Chem. Commun., 2007, 1056–1058 RSC.
- T. Pirmohamed, J. M. Dowding, S. Singh, B. Wasserman, E. Heckert, A. S. Karakoti, J. E. S. King, S. Seal and W. T. Self, Chem. Commun., 2010, 46, 2736–2738 RSC.
- C. Li, X. Shi, Q. Shen, C. Guo, Z. Hou and J. Zhang, J. Nanomater., 2018, 2018, 1–12 CAS.
- J. Chen, S. Patil, S. Seal and J. F. McGinnis, Nat. Nanotechnol., 2006, 1, 142–150 CrossRef CAS PubMed.
- B. K. Pierscionek, Y. Li, A. A. Yasseen, L. M. Colhoun, R. A. Schachar and W. Chen, Nanotechnology, 2009, 21, 035102 CrossRef PubMed.
- F. Caputo, M. Mameli, A. Sienkiewicz, S. Licoccia, F. Stellacci, L. Ghibelli and E. Traversa, Sci. Rep., 2017, 7, 1–14 CrossRef CAS PubMed.
- E. C. Cho, Q. Zhang and Y. Xia, Nat. Nanotechnol., 2011, 6, 385–391 CrossRef CAS PubMed.
- A. S. Karakoti, N. A. Monteiro-Riviere, R. Aggarwal, J. P. Davis, R. J. Narayan, W. T. Seif, J. McGinnis and S. Seal, Nanoceria as antioxidant: Synthesis and biomedical applications, 2008, vol. 60 Search PubMed.
- G. W. V. Cave, US Pat., 20180280910-A1, 2018.
- A. Kumar, S. Babu, A. S. Karakoti, A. Schulte and S. Seal, Langmuir, 2009, 25, 10998–11007 CrossRef CAS PubMed.
- A. Hall, V. J. Mundell, C. Blanco-Andujar, M. Bencsik, G. McHale, M. I. Newton and G. W. V. Cave, Chem. Commun., 2010, 46, 2420 RSC.
- R. Singh and S. Singh, Colloids Surf., B, 2019, 175, 625–635 CrossRef CAS PubMed.
- S. Singh, A. Ly, S. Das, T. S. Sakthivel, S. Barkam and S. Seal, Artif. Cells, Nanomed., Biotechnol., 2018, 46, S956–S963 CrossRef CAS PubMed.
- A. S. Karakoti, S. V. N. T. Kuchibhatla, K. S. Babu and S. Seal, J. Phys. Chem. C, 2007, 111, 17232–17240 CrossRef CAS.
- J. Lovrić, S. J. Cho, F. M. Winnik and D. Maysinger, Chem. Biol., 2005, 12, 1227–1234 CrossRef PubMed.
- L. De Marzi, A. Monaco, J. De Lapuente, D. Ramos, M. Borras, M. Di Gioacchino, S. Santucci and A. Poma, Int. J. Mol. Sci., 2013, 14, 3065–3077 CrossRef CAS PubMed.
- J. Coates, in Encyclopedia of Analytical Chemistry, 2006 Search PubMed.
- P. Del Pino, B. Pelaz, Q. Zhang, P. Maffre, G. U. Nienhaus and W. J. Parak, Mater. Horiz., 2014, 1, 301–313 RSC.
- T. Cedervall, I. Lynch, S. Lindman, T. Berggard, E. Thulin, H. Nilsson, K. A. Dawson and S. Linse, Proc. Natl. Acad. Sci. U. S. A., 2007, 104, 2050–2055 CrossRef CAS PubMed.
- N. V. Konduru, R. M. Molina, A. Swami, F. Damiani, G. Pyrgiotakis, P. Lin, P. Andreozzi, T. C. Donaghey, P. Demokritou, S. Krol, W. Kreyling and J. D. Brain, Part. Fibre Toxicol., 2017, 14 DOI:10.1186/s12989-017-0223-3.
- C. Gräfe, A. Weidner, M. V. D. Lühe, C. Bergemann, F. H. Schacher, J. H. Clement and S. Dutz, Int. J. Biochem. Cell Biol., 2016, 75, 196–202 CrossRef PubMed.
- R. A. Sperling and W. J. Parak, Philos. Trans. R. Soc., A, 2010, 368, 1333–1383 CrossRef CAS PubMed.
- A. Krishnan, T. S. Sreeremya, E. Murray and S. Ghosh, J. Colloid Interface Sci., 2013, 389, 16–22 CrossRef CAS PubMed.
- F. Gao, G. H. Li, J. H. Zhang, F. G. Qin, Z. Y. Yao, Z. K. Liu, Z. G. Wang and L. Y. Lin, Chin. Phys. Lett., 2001, 18, 443–448 CrossRef.
- A. Krishnan, T. S. Sreeremya and S. Ghosh, RSC Adv., 2016, 6, 53550–53559 RSC.
- A. Asati, S. Santra, C. Kaittanis and J. M. Perez, ACS Nano, 2010, 4, 5321–5331 CrossRef CAS PubMed.
- X. Jiang, B. Du, Y. Huang and J. Zheng, Nano Today, 2018, 21, 106–125 CrossRef CAS.
- B. Li, V. Agarwal, D. Ho, J. P. Vede and K. S. Iyer, New J. Chem., 2018, 42, 7237–7240 RSC.
- W. Hu, C. Peng, M. Lv, X. Li, Y. Zhang, N. Chen, C. Fan and Q. Huang, ACS Nano, 2011, 5, 3693–3700 CrossRef CAS PubMed.
- S. K. Jana, P. Banerjee, S. Das, S. Seal and K. Chaudhury, J. Nanopart. Res., 2014, 16 DOI:10.1007/s11051-014-2441-z.
- A. Asati, S. Santra, C. Kaittanis and J. Perez, ACS Nano, 2010, 4, 5321–5331 CrossRef CAS PubMed.
- O. S. Wolfbeis, Chem. Soc. Rev., 2015, 44, 4743–4768 RSC.
- E. Fröhlich, Int. J. Nanomed., 2012, 7, 5577–5591 CrossRef PubMed.
- A. Kumar, S. Babu, A. S. Karakoti, A. Schulte and S. Seal, Langmuir, 2009, 25, 10998–11007 CrossRef CAS PubMed.
- A. Ostrowski, D. Nordmeyer, A. Boreham, C. Holzhausen, L. Mundhenk, C. Graf, M. C. Meinke, A. Vogt, S. Hadam, J. Lademann, E. Ruhl, U. Alexiev and A. D. Gruber, Beilstein J. Nanotechnol., 2015, 6, 263–280 CrossRef PubMed.
Footnote |
| † Electronic supplementary information (ESI) available. See DOI: 10.1039/c9ra01252d |
| This journal is © The Royal Society of Chemistry 2019 |

