
 Open Access Article
 This Open Access Article is licensed under a Creative Commons Attribution-Non Commercial 3.0 Unported Licence
The effect of fermentation conditions on the structure and anti-tumor activity of polysaccharides from Cordyceps gunnii
Xiao-Cui Liuab,
Hongran Liacd,
Tong Kangacd,
Zhen-Yuan Zhu *acd,
Ying-Liang Liue,
Hui-Qing Sunacd and
Li-chao Panacd
*acd,
Ying-Liang Liue,
Hui-Qing Sunacd and
Li-chao Panacd
aState Key Laboratory of Food Nutrition and Safety, Tianjin University of Science and Technology, Tianjin 300457, PR China. E-mail: zhyuanzhu@tust.edu.cn; Fax: +86 22 60601437; Tel: +86 22 60601437
bKey Laboratory of Food Bio-technology, School of Food and Bioengineering, Xihua University, Chengdu 610039, P. R. China
cKey Laboratory of Food Nutrition and Safety, Ministry of Education, Tianjin University of Science and Technology, Tianjin 300457, PR China
dCollege of Food Science and Biotechnology, Tianjin University of Science and Technology, Tianjin 300457, PR China
eSchool of Life Sciences, Guizhou Normal University, Guiyang, Guizhou 550001, China
First published on 10th June 2019
Abstract
This study investigates the effect of fermentation conditions on the structure and anti-tumor activity of intracellular polysaccharides (IPS) of Cordyceps gunnii (C. gunnii) in submerged fermentation. The environmental and nutritional conditions are determined in a shaker flask by a single factor test. The inhibition of IPS on S180 cells was as an optimization index. The results show that the optimal fermentation conditions of C. gunnii are an initial pH value of 6, a temperature of 25 °C, a rotation speed of 150 rpm, 4% glucose, and 1.0% peptone. Under these conditions, the macro molecular weight (Mw) polysaccharide content and anti-tumor activity of IPS are significantly higher than that in the basal culture medium. GC, HPGPC, periodate oxidation-Smith degradation, NMR, and FT-IR determine the structural characteristics of CPS-JC and CPS-YH (pure IPS cultured in basal culture medium and optimal culture medium, respectively). The results indicate that CPS-JC is mainly composed of α-D-glucans, whereas CPS-YH primarily contain α-D-glucans with a trace amount of β-D-glucans.
Introduction
Cordyceps, a well-known and valued Chinese medicinal mushroom, has various biological and pharmacological functions such as anti-tumor, antioxidant, antiaging, anti-inflammatory, and immunity improving qualities.1,2 Although C. gunnii and Cordyceps sinensis are different species, they display similar pharmacological activities,3,4 which is generally attributed to the presence of essential bioactive ingredients. These include polysaccharides, cordycepic acid, cordycepin, superoxide dismutase (SOD), and amino acids.5–9 Polysaccharides are the major bioactive constituents of Cordyceps, contributing to the maintenance of good health and anti-cancer activity.10,11 During a previous study, a high-molecular-weight polysaccharide (CPS) obtained from the mycelia of C. gunnii, was isolated and purified. Results indicated that CPS significantly inhibited the growth of K562 cells in vitro.12 Recently, fungus polysaccharides and polysaccharide–protein complexes have attracted attention in the biochemical and medical fields due to their anti-cancer effects.13–16Since the fruiting bodies of wild C. gunnii are rare and expensive, an effective way to obtain large quantities of polysaccharides from Cordyceps is from the mycelium via liquid submerged fermentation.17,18 Fermentation is a useful way to produce bioactive substances with health-promoting properties. The fermentation conditions are crucial to the production of bioactive materials since they are directly related to secondary metabolite biosynthesis and cell proliferation.19,20 Moreover, the fermentation conditions affect the activity of metabolites. Lin and Chiang reported that C. militaris samples cultured in Radix astragali displayed higher anti-tumor activity than those cultured in the synthetic medium.21 These results proved that the fermentation conditions played a significant role in the anti-tumor benefits of polysaccharides, and have an essential effect on structural variability. The research results of Kai et al. indicated that the monosaccharide composition of hetero-polysaccharides was highly dependent on the type of monosaccharide obtained from the fermentation medium.22 However, no notable studies currently exist involving the relationship between fermentation conditions, anti-tumor activity, and the structure of C. gunnii polysaccharides subjected to submerged.
Sarcoma 180 (S180) cell line is commonly used to establish the model of transplanted tumor in mice, because it lacks major histocompatibility complex molecules and is not easy to be rejected by recipient mice. And there is no specific requirement for the recipient mouse species. In addition, S180 ascites sarcoma cells are easier to subculture, and have higher survival rate. Therefore, researchers usually select S180 cells to investigate the anti-tumor activity of some substances from medicinal fungi. Shin et al. reported that the fruiting bodies polysaccharide of Paecilomyces japonica, a new type of Cordyceps spp., had antitumor activity on the S180 tumor cells.23 Huang et al. reported that the water-soluble polysaccharides (Pi-PCM0 to Pi-PCM2) from Poria cocos all exhibited anti-tumor activities in vivo (Sarcoma 180 solid tumor implanted 1 in BALB/c mice).24 Our previous research showed that polysaccharides extracted by different methods from C. gunnii mycelia have significant inhibition ability toward S180 sarcoma cells.25 MTT assay is widely used to detect the promoting cell proliferative activity and cytotoxicity of some natural active ingredients. This method is simple to operate, safe to use, low cost, and can achieve high detection sensitivity by controlling experimental conditions. Wei et al. reported that polysaccharide isolated from Dendrobium officinale had anti-tumor activity on HepG-2 cells by MTT assay.26 The growth inhibitory rates of the crude polysaccharides to human gastric cancer cells were evaluated in vitro by MTT assay.3 The polysaccharide of strain FK1 was extracted from the mycelium free supernatant by boiling water method and evaluated for antitoxicity effect on two human cancer cell lines: HeLa cell line and lymphoblastoid cell line (LCL) by MTT method.27 The antitumor activities of Ganoderma lucidum polysaccharide to the human breast cancer cell (MDA-MB-231) in vitro was evaluated by MTT assay.16 Hence, in this paper we took the S180 ascites sarcoma cells and MTT assay to investigate the anti-tumor activity of polysaccharide from mycelium of C. gunnii in vitro. Different analysis types to determine anti-tumor activity such as morphological, genetic or molecular analysis need be further studied.
This study utilizes different environmental and nutritional conditions to cultivate C. gunnii and investigate the anti-tumor activity of the fermentation products. The purpose is to obtain the optimal culture medium suitable for the formation of polysaccharides possessing higher anti-tumor activity. Furthermore, the structural characteristics of CPS-JC and CPS-YH were compared using a combination of chemical and instrumental analysis, such as acid hydrolysis, GC, HPGPC, periodate oxidation-Smith degradation, NMR, and FT-IR.
Materials and methods
Materials
Sarcoma 180 (S180) cells, obtained from the American type culture collection (ATCC), were prepared from peritoneal cavity of the tumor inoculated mice under aseptic conditions. The C. gunnii used in this study were obtained from the Key Laboratory of Food Nutrition and Safety (Ministry of Education, China), and the College of Food Science and Biotechnology (Tianjin University of Science and Technology, Tianjin, China). The strain of C. gunnii was maintained on Potato Dextrose Agar (PDA) slants, and was stored at 4 °C after the slant was incubated at 25 °C for 7 d. The S180 cells were maintained in RPMI Medium 1640 supplemented with 10% fetal bovine serum, 100 μg mL−1 streptomycin, and 100 mU L−1 penicillin at 37 °C in a humidified atmosphere of 5% CO2.The standard monosaccharides (D-glucose, D-xylose, D-galactose, L-rhamnose, D-mannose, and D-arabinose), Sephadex G-100 and 3-(4,5-dimethylthiazol-2-yl)-2,5-diphenyl-tetrazolium bromide (MTT) were purchased from the Sigma Chemical Co. (St. Louis, MO, USA). All other chemicals used in this study were of analytical grade.
Preparation of the mycelium
The mycelium of C. gunnii was activated by culturing the sample on a PDA plate at 25 °C for 7 d. Following this process, the sample was transferred to the seed culture medium by punching out agar discs of approximately 5 mm in diameter from the culture grown on the PDA plates. The seed liquid was grown in a 250 mL flask containing 100 mL of seed culture medium (sucrose 20 g L−1, peptone 10 g L−1, KH2PO4 3 g L−1, MgSO4·7H2O 1.5 g L−1, distilled water, initially natural pH) at 25 °C on a rotary shaker incubator at 150 rpm for 3 d.The flask culture experiments were conducted in 250 mL flasks containing 100 mL of the basal culture medium (sucrose 40 g L−1, peptone 5 g L−1, KH2PO4 3 g L−1, MgSO4·7H2O 1.5 g L−1, distilled water, initially natural pH) after being inoculated with 8% (v/v) of the seed liquid.
A single factor-screening test was used to investigate each factor of the optimal medium,28 and to ascertain the optimal culture conditions (environmental conditions and nutrition requirements) for determining the IPS displaying the highest anti-tumor activity. First, the anti-tumor activity of IPS was considered as optimization indexes to select the optimal environmental conditions including initial pH value, temperature, and rotation speed. Then, based on these established environmental conditions, the anti-tumor activity of IPS was used as an additional indicator to select the optimal nutritional requirements including carbon source types, nitrogen source types, as well as their concentration levels. Finally, the mycelium of C. gunnii was cultured in the basal culture medium and the optimal medium, respectively. The cultured mycelia from one sample were freeze-dried after being separated from the medium and thoroughly rinsed with a large amount of distilled water.29 Moreover, the crude polysaccharides extracted from the two types of mycelium were named JC and YH, respectively.
The extraction and purification of crude IPS
IPS were extracted from dry mycelial powder (400 mg) by suspending the mycelia in 8 mL distilled water at 80 °C for 2 h and repeating twice. The extracts were gathered in a container and added to four volumes of 95% (v/v) ethanol to precipitate overnight at 4 °C. Following this process, the samples were centrifuged at 4500 × g for 20 min, and the supernatant fluid was collected. The extract was concentrated to a volume of 6 mL by being exposed to reduced pressure. The concentrated solution was deproteinated using the Sevag method and repeating the process seven times. The crude polysaccharides (JC and YH) were subjected to gel filtration on a column (30 cm × 3 cm) of Sephadex G-100, eluted with deionized water at a flow rate of 0.3 mL min−1, and monitored using the phenol-sulfuric acid method.Anti-tumor activity analysis
The anti-tumor activity of the IPS in S180 ascites tumor cells was evaluated in vitro with an MTT assay. The S180 cells were seeded at a concentration of 1 × 10⁵ cells per mL in a volume of 100 μL in 96-well plates. Cells were incubated with the IPS samples at respective concentrations of 25 μg mL−1, 50 μg mL−1, 100 μg mL−1, 200 μg mL−1, and 400 μg mL−1. After 20 h, 44 h, 68 h, respectively, 20 μL of 5 mg mL−1 of MTT was added to each well and incubated for another 4 h. The culture media were subsequently removed, and 100 μL of dimethyl sulfoxide (DMSO) was added to each well. A micro-plate ELISA reader was used to detect absorbance length at 490 nm.30 The inhibition ratio of S180 cell proliferation was calculated as follows:ODa is the absorbance value of the negative control group, and ODb is that of the sample group.

Determination of Mw distribution
The Mw distribution of IPS was determined by HPGPC with an Agilent-1200 instrument (Agilent, USA), equipped with a TSK gel G4000PWxl column (7.8 mm × 300 mm, and a column temperature 30 °C). The sample was eluted with deionized water at a flow rate of 0.6 mL min−1. Elution was monitored with a Refractive Index Detector (RID), at a detecting temperature of 35 °C. The standard curve was established using T-series Dextran as the standards (T-10, T-40, T-70, T-500, and T-2000). The Mw of each composition was calculated by comparison with the retention time of the monosaccharide reference standard. Based on the peak area values, the relative percentage content of each fraction could be determined.31Fourier transform infrared (FT-IR) analysis
The FT-IR spectrum analysis was performed on a 1 mm pellet by pressing 1 mg of polysaccharide grinding mixture with 150 mg of dried KBr. The spectra length was recorded at the absorbance mode in the region of 4000–400 cm−1 on an FT-IR spectrophotometer (VECTOR-22).Nuclear magnetic resonance (NMR) spectroscopy
1H NMR and 13C NMR spectra were recorded on a Bruker spectrometer (600 MHz) at a probe temperature of 298 K. Before the analysis, the samples were exchanged twice with D2O while freeze-drying.Monosaccharide analysis
The polysaccharides were hydrolyzed with 2 M trifluoroacetic acid (TFA) at 110 °C in a sealed tube for 3 h. One part of the hydrolysate was analyzed by Thin-Layer Chromatography (TLC) was used to analyze one part of the hydrolysate. The other part was acetylated and analyzed using gas chromatography (GC) after the TFA was removed. D-Glucose, D-xylose, D-galactose, L-rhamnose, D-mannose, and D-arabinose were derived as standards.Periodate oxidation and Smith degradation analysis
A 5.0 mg volume of the samples were dissolved in a 25 mL solution containing 0.03 M NaIO4, and kept in darkness at 4 °C. A 0.1 mL volume of the solution was drawn every 8 h, diluted to 25 mL with distilled water, and detected with a UV spectrophotometer at 223 nm. The process completed after 96 h, and ethylene glycol (0.2 mL) was added to the solution to quench the reaction. Consumption of NaIO4 was measured using the spectrophotometric method, and the production of formic acid was determined by titration with 0.01 M NaOH. The reaction mixture was then dialyzed in distilled water, and the non-dialysate was reduced with NaBH4 (30 mg) for 12 h.32 Finally, the pH was adjusted to 5.0–6.0, the solution was dialyzed, the non-dialysate was lyophilized, and then hydrolyzed with 2 mL of 2 M TFA at 110 °C for 3 h. The subsequent hydrolysate was analyzed by GC.Statistical analysis
Data were expressed as means ± SD at least three independent experiments. Data in all the bioassays were statistically evaluated by analysis of variance. *p < 0.05, **p < 0.01.Results and discussion
The effect of different fermentation conditions on the anti-tumor activity and Mw distribution of crude IPS in C. gunnii
The Mw of the polysaccharides were determined by a universal calibration curve using Dextran as standards. The calibration curve of the Dextran standards was plotted as the Mw on a log scale versus the retention time.33 The regression equation was lg![[thin space (1/6-em)]](https://www.rsc.org/images/entities/char_2009.gif) Mw = 9.3621 − 0.3481tR, R2 = 0.9899 (Mw: weight-average molar mass, Da; tR: the retention time, min). As shown in Table 1, the HPGPC profile of each crude IPS had three peaks, indicating that they contained three types of polysaccharides, respectively. The relative content of three fractions displayed significant differences, while the first fraction exhibited the highest content.10 On the basis of the theory of the macromolecular polysaccharide appeared firstly in HPGPC chromatogram, it indicated that all samples were main containing macro Mw polysaccharide (macro Mw: molecular weight approximately 3 × 10⁶ Da), with a trace amount of medium Mw (medium Mw: Mw approximately 4 × 10⁵ Da) and low Mw (low Mw: Mw approximately 1 × 10⁴ Da) polysaccharide.
Mw = 9.3621 − 0.3481tR, R2 = 0.9899 (Mw: weight-average molar mass, Da; tR: the retention time, min). As shown in Table 1, the HPGPC profile of each crude IPS had three peaks, indicating that they contained three types of polysaccharides, respectively. The relative content of three fractions displayed significant differences, while the first fraction exhibited the highest content.10 On the basis of the theory of the macromolecular polysaccharide appeared firstly in HPGPC chromatogram, it indicated that all samples were main containing macro Mw polysaccharide (macro Mw: molecular weight approximately 3 × 10⁶ Da), with a trace amount of medium Mw (medium Mw: Mw approximately 4 × 10⁵ Da) and low Mw (low Mw: Mw approximately 1 × 10⁴ Da) polysaccharide.
| Group | IPS production (mg/100 mL) | Macro Mw (%) | Medium Mw (%) | Low Mw (%) |
|---|---|---|---|---|
| a Experiments were performed in triplicate and results were presented as mean ± SD; *p < 0.05, **p < 0.01 vs. maximum IPS production. | ||||
| Initial pH | ||||
| pH = 5 | 84.01 ± 3.01* | 78.919 | 10.9574 | 10.123 |
| pH = 6 | 95.47 ± 2.92 | 82.717 | 5.972 | 11.311 |
| pH = 7 | 80.63 ± 4.24* | 72.554 | 13.2682 | 14.178 |
| pH = 8 | 66.21 ± 3.96** | 81.747 | 8.476± | 9.786 |
|
||||
| Temperature | ||||
| 20 °C | 86.41 ± 4.36* | 84.548 | 6.440 | 9.012 |
| 25 °C | 97.36 ± 4.35 | 89.910 | 6.560 | 2.529 |
| 30 °C | 67.08 ± 3.46** | 80.449 | 9.009 | 5.726 |
|
||||
| Rotation speed | ||||
| 100 rpm | 89.45 ± 4.37 | 82.956 | 11.0790 | 4.264 |
| 150 rpm | 90.74 ± 4.21 | 85.312 | 8.197 | 3.246 |
| 180 rpm | 87.39 ± 3.79 | 73.838 | 9.835 | 8.146 |
|
||||
| Carbon source types | ||||
| Sucrose | 83.25 ± 4.03* | 76.146 | 9.821 | 14.033 |
| Glucose | 93.00 ± 6.84 | 77.766 | 12.2883 | 9.737 |
| Soluble starch | 81.47 ± 3.97* | 54.546 | 42.1617 | 3.293 |
|
||||
| Nitrogen source types | ||||
| Peptone | 98.87 ± 4.77 | 87.057 | 0 | 12.943 |
| Yeast extract powder | 85.59 ± 3.36* | 66.016 | 13.7327 | 20.252 |
| NaNO3 | 56.05 ± 4.47** | 73.252 | 17.7811 | 8.967 |
|
||||
| Carbon source concentrations | ||||
| 1% | 87.61 ± 4.53* | 66.356 | 19.5361 | 14.108 |
| 2% | 62.45 ± 3.74** | 66.654 | 20.1321 | 13.214 |
| 3% | 93.98 ± 4.51* | 54.083 | 16.7526 | 29.166 |
| 4% | 138.78 ± 5.24 | 71.046 | 14.5347 | 14.420 |
| 5% | 32.64 ± 3.15** | 65.861 | 19.8571 | 14.281 |
|
||||
| Nitrogen source concentrations | ||||
| 0.5% | 67.27 ± 2.46** | 75.104 | 10.425 | 14.471 |
| 1.0% | 130.41 ± 4.79 | 86.531 | 4.336 | 5.133 |
| 1.5% | 67.12 ± 2.31** | 77.616 | 3.690 | 17.695 |
| 2.0% | 58.09 ± 2.36** | 80.019 | 8.140 | 11.841 |
| 2.5% | 80.51 ± 1.89* | 79.668 | 4.587 | 15.745 |
|
||||
| Crude IPS | ||||
| JC | 99.63 ± 3.16* | 73.070 | 16.253 | 10.677 |
| YH | 115.27 ± 4.28 | 82.326 | 15.2471 | 2.427 |
A medium pH level has a seemingly significant impact on cell membrane function, cell morphology and structure, as well as the uptake of various nutrients, and product biosynthesis in all the environmental factors.34 As shown in Table 1, the highest macro Mw polysaccharide of IPS reached 82.717% when the pH value of fermentation medium was 6.0, and the IPS production reached (95.47 ± 2.92 mg/100 mL) and was higher (10–20) mg/100 mL than other samples in the pH group. Additionally, the IPS cultured at pH 6.0 exhibited a higher inhibition ratio at about 60% in the S180 cells at a concentration of 400 μg mL−1 (Fig. 1A). The results indicated that pH 6.0 was the optimal pH value to promote the initial growth of IPS displaying the highest anti-tumor activity.
 | ||
| Fig. 1 The growth inhibitory effect of polysaccharide on S180 cell at different concentrations (n = 6) under different pH values (A), temperatures (B), rotation speed (C), carbon sources (D), nitrogen sources (E), carbon source concentrations (F), and nitrogen source concentrations (G). *p < 0.05, **p < 0.01 vs. the highest inhibition rate at the same concentration of different groups. | ||
S180 cells, were exposed to three different fermentation temperatures (20 °C, 25 °C, and 30 °C) in shake flask cultures to evaluate anti-tumor activity (Fig. 1B). There is no significant difference of inhibition ratio between 25 °C and 30 °C at the concentration of 200 μg mL−1 and 400 μg mL−1. However, the IPS obtained a relatively higher inhibition ratio at 25 °C than that at 30 °C for 400 μg mL−1 concentration. At the same culture temperature, macro Mw polysaccharide content and IPS production of C. gunnii both reached the highest level at 89.91% and 97.36 ± 4.35 mg/100 mL, respectively (Table 1). This result corresponded with the findings of existing literature that the optimal cultivation temperature for Cordyceps mycelia in a submerged fermentation culture medium appeared to be 25 °C.21
It is well-known that oxygen supply is closely related to the formation and accumulation of bioactive metabolites in medicinal fungal submerged cultivation processes.35 Rotation speeds of the shaking table can directly affect the oxygen capacity of the fermented liquid. Therefore, the effects of rotation speeds (100 rpm, 150 rpm, and 180 rpm) on the IPS production and activity were also investigated. As shown in Table 1, the IPS production and macro Mw polysaccharide content at a rotation speed of 150 rpm exhibited a relatively higher level than that at the other two rotation speeds. Additionally, anti-tumor activity of IPS reached the highest levels at a rotation speed of 150 rpm for 200 μg mL−1 and 400 μg mL−1 concentrations (Fig. 1C). In comparison with other rotation speeds, 150 rpm was a good candidate for the rotation speed for its suitable dissolved oxygen amount and low machine loss. Therefore, 150 rpm was the best choice of rotation speed.
Carbon sources exerted considerable influence on the production and compositions of polysaccharides in fungi.36 To determine a suitable carbon source for the production of C. gunnii with a higher anti-tumor activity IPS, various carbon sources such as sucrose, glucose, and soluble starch were individually utilized at a concentration of 40 g L−1 in the basal medium. As shown in Table 1, the maximum IPS production (93.00 ± 6.84 mg/100 mL) was obtained by using glucose as the carbon source in the basic medium, and was significantly higher than sucrose and soluble starch (*p < 0.05). This result does not correspond to the nutritional requirements of other species of Cordyceps in submerged cultures. Hsieh et al. reported that sucrose could significantly affect the mycelium growth of C. sinensis.37 The fact that carbon sources improved the production of polysaccharides might be attributed to energy provision for the fungi growth, and the accumulation of polysaccharides. Moreover, the macro Mw polysaccharide content and anti-tumor activity of IPS (Table 1 and Fig. 1D) in the glucose group appeared to be higher than in other carbon source groups. Moreover, the promoting effect was evident in S180 cell growth when soluble starch was used as the carbon source. The reasons might be that the starch was not completely dissolved in the medium. Compared with other carbon sources, glucose was a good candidate for the carbon source due to its ease-of-use and low cost. Therefore, glucose was selected as the primary carbon source for subsequent experiments.
The nitrogen sources are essential factors for mycelium growth and polysaccharide production.38 The results (Table 1) showed that the maximum IPS production (98.87 ± 4.77 mg/100 mL) and macro Mw polysaccharide content 87.057% were obtained by using peptone as a nitrogen source. The effects of nitrogen sources on the anti-tumor activity of IPS in C. gunnii during submerged cultivation are shown in Fig. 1E. IPS cultured in an inorganic nitrogen source (NaNO3) medium exhibited relatively lower anti-tumor activity than the samples cultured in an organic nitrogen source (peptone, yeast extract powder) medium. This result is consistent with previous suggestions that most basidiomycetes prefer complex organic nitrogen sources to promote their growth in submerged cultures,39 and possibly for certain essential amino acid(s) that were barely synthesized from inorganic nitrogen sources in the cultivation of active substances.40 Peptone yielded the best IPS with higher anti-tumor activity compared with all other organic sources.
Additionally, in order to obtain the optimal carbon source and nitrogen source concentration, C. gunnii was cultivated with various levels of glucose (i.e. 1%, 2%, 3%, 4%, and 5%, w/v), and peptone concentrations (i.e. 0.5%, 1.0%, 1.5%, 2.0% and 2.5%, w/v). As shown in Table 1, the highest IPS production and macro Mw polysaccharide content were obtained at 4% glucose (138.78 ± 5.24 mg/100 mL; 71.046%) and 1.0% peptone (130.41 ± 4.79 mg/100 mL; 86.531%), respectively. As shown in Fig. 1F and G, considering the four different concentration levels, IPS exhibited significantly higher anti-tumor activity when the glucose concentration was at 4%, and the nitrogen source concentration was at 1.0%. These results indicated that a higher glucose concentration and a lower peptone concentration were beneficial to the production and anti-tumor activity of IPS. These findings correspond with previous studies that high concentrations of glucose were beneficial to the mycelial formation.41
In this study, the polysaccharide at lower concentrations exhibited proliferative effect on S180 cells. The result was coincided with the report in the literature that extracellular polysaccharide (Pi-PCM0) from Poria cocos mycelia exhibit proliferative effect on human MCF-7 cells at the lower concentration of 50 μg mL−1.42 Peng et al. reported that the heteropolysaccharide coded as EPF1 was obtained from the crude extracellular polysaccharide of Ganoderma tsugae mycelium also exhibit proliferative effect on Sarcoma 180 cells at the lower concentration of 0.005 g L−1.43 It implied that some polysaccharide at lower concentration did not have toxicity to tumor cells, which need to be explained by further research.
Therefore, all the fermentation conditions (including environmental conditions and nutritional conditions) significantly affected the production, Mw distribution, and anti-tumor activity of IPS in C. gunnii in submerged fermentation. Wang et al. reported that the cytokine nitric oxide (NO) can inhibit of a variety of tumors, and polysaccharides with a Mw above 100 kDa could significantly promote the release of NO.44 Therefore, the fermentation conditions influenced the Mw of polysaccharides, and related to the anti-tumor activity. Moreover, the results of this study indicated that polysaccharides with a larger Mw displayed higher anti-tumor activity when they were cultured in different fermentation mediums.
Considering all the available results, the optimal culture process of C. gunnii was determined at an initial pH value of 6, a temperature of 25 °C, a rotation speed of 150 rpm, 4% glucose, and 1.0% peptone. The crude IPS fermented in the optimized medium was defined as YH, while the crude IPS fermented in the basal medium was defined as JC.
Isolation and purification of JC and YH
JC and YH, were obtained from the mycelium of C. gunnii using hot water extraction and ethanol precipitation. As shown in Table 1, the IPS production of JC and YH were 99.63 ± 3.16 mg/100 mL. and 115.27 ± 4.28 mg/100 mL, respectively. The total sugar content of JC and YH were 42.30% and 54.07%, respectively, and was detected using a phenol-sulfuric acid assay as D-glucose equivalents. Additionally, JC and YH were separated with Sephadex G-100 column chromatography, and the elution curve is shown in Fig. 2A and B, respectively. The main fraction (CPS-JC and CPS-YH) was collected and lyophilized for further study relating to structure and anti-tumor activity. The HPGPC profile demonstrated that CPS-JC and CPS-YH (Fig. 2C and D) produced a single and symmetrical peak, revealing that both were homogeneous polysaccharides. Based on the equation of the standard curve generated by various Dextran standards and the retention time of CPS-JC and CPS-YH, the average Mw was estimated to be 8.8 × 10⁵ Da and 12.68 × 10⁵ Da, respectively. The specific optical rotation of CPS-JC and CPS-YH were determined to be +95° and −35°, respectively. The UV absorption spectra of CPS-JC and CPS-YH exhibited no absorption at 280 and 260 nm, indicating the absence of proteins and nucleic acids from the polysaccharides. The total sugar content of CPS-JC and CPS-YH were 64.93% and 75.01%, respectively. Interestingly, the measured value of polysaccharide content was lower than the theoretical value, which might be attributed to polyol–water crystallization water. | ||
| Fig. 2 Elution profiles of JC (A) and YH (B) in Sephadex G-100 column chromatography; HPGPC profiles of CPS-JC (C) and CPS-YH (D); the growth inhibitory effect of CPS-JC and CPS-YH (E) on S180 cell at different concentrations (n = 6). *p < 0.05, **p < 0.01, compared to the control. | ||
The anti-tumor activity in vitro of CPS-JC and CPS-YH
In this study, S180 cells were cultured with different concentrations of CPS-JC and CPS-YH for various periods. As shown in Fig. 2E, at a concentration of 400 μg mL−1, CPS-YH exhibited a substantially higher inhibition ratio at about >75%, while CPS-JC displayed an inhibition ratio about 70%. At concentrations of 200 μg mL−1 and 100 μg mL−1, the activity presented a significant difference (*p < 0.05); the inhibition ratio reached about 70% in CPS-YH, while it reached only 40% in CPS-JC. At a concentration of 50 μg mL−1, the inhibition ratios in the S180 cells were 24.63% and 54.66% of CPS-JC and CPS-YH, respectively. Additionally, the inhibition ratio of CPS-YH on S180 cells reached 65.18% and was significantly higher than CPS-JC when exposed to the same conditions with 25 μg mL−1.Structural analysis of CPS-JC and CPS-YH
In TLC the hydrolysates of CPS-JC, CPS-YH and standard monosaccharides (Fig. 3A) appeared as a homogenous point, indicating that all samples displayed signs of complete acid degradation. Additionally, the location of CPS-JC and CPS-YH was similar to that of D-mannose, L-arabinose, and D-glucose, indicating the presence of these sugars. The exact monosaccharide compositions of CPS-JC and CPS-YH were further determined using GC. | ||
| Fig. 3 Thin-Layer Chromatography (TLC) of CPS-JC and CPS-YH (A) after acid hydrolysis; the gas chromatography (GC) of derivatives CPS-JC (B) and CPS-YH (C). | ||
The monosaccharide compositions of CPS-JC and CPS-YH are shown in Fig. 3B and C, respectively. The results indicated that CPS-JC and CPS-YH were both primarily composed of D-mannose, D-glucose, and D-galactose in the molar ratio of 1.18:4.39:1.30 and 2.37:4.56:2.23, respectively, with a trace amount of other sugars.
The IR spectra for the CPS-JC and CPS-YH samples are shown in Fig. 4A and B. The broad stretching peaks at 3373 cm−1 (CPS-JC) and 3418 cm−1 (CPS-YH) were ascribed to hydroxyl groups with stretching vibration, while the weak absorption peaks at 2925 cm−1 (CPS-JC) and 2933 cm−1 (CPS-YH) were characteristic of C–H stretching vibration. Additionally, the bands at 1653 cm−1 (CPS-JC) and 1648 cm−1 (CPS-YH) exhibited a strong absorption peak indicative of C![[double bond, length as m-dash]](https://www.rsc.org/images/entities/char_e001.gif) O stretching vibration. Therefore, the three bands above were characteristic IR absorption peaks of polysaccharides. Furthermore, strong absorption in the range of 1200–1000 cm−1 was apparent, suggesting that the monosaccharides in CPS-JC and CPS-YH both displayed a pyranose ring.45 The characteristic absorption bands at 854 cm−1 indicated that CPS-JC contained α-glycosidic linkages. However, CPS-YH exhibited no visible characteristic absorption peaks at 850 cm−1. These results suggest that CPS-JC could be a type of alpha-pyran polysaccharide. However, further study is required to establish the exact configuration of CPS-YH.
O stretching vibration. Therefore, the three bands above were characteristic IR absorption peaks of polysaccharides. Furthermore, strong absorption in the range of 1200–1000 cm−1 was apparent, suggesting that the monosaccharides in CPS-JC and CPS-YH both displayed a pyranose ring.45 The characteristic absorption bands at 854 cm−1 indicated that CPS-JC contained α-glycosidic linkages. However, CPS-YH exhibited no visible characteristic absorption peaks at 850 cm−1. These results suggest that CPS-JC could be a type of alpha-pyran polysaccharide. However, further study is required to establish the exact configuration of CPS-YH.
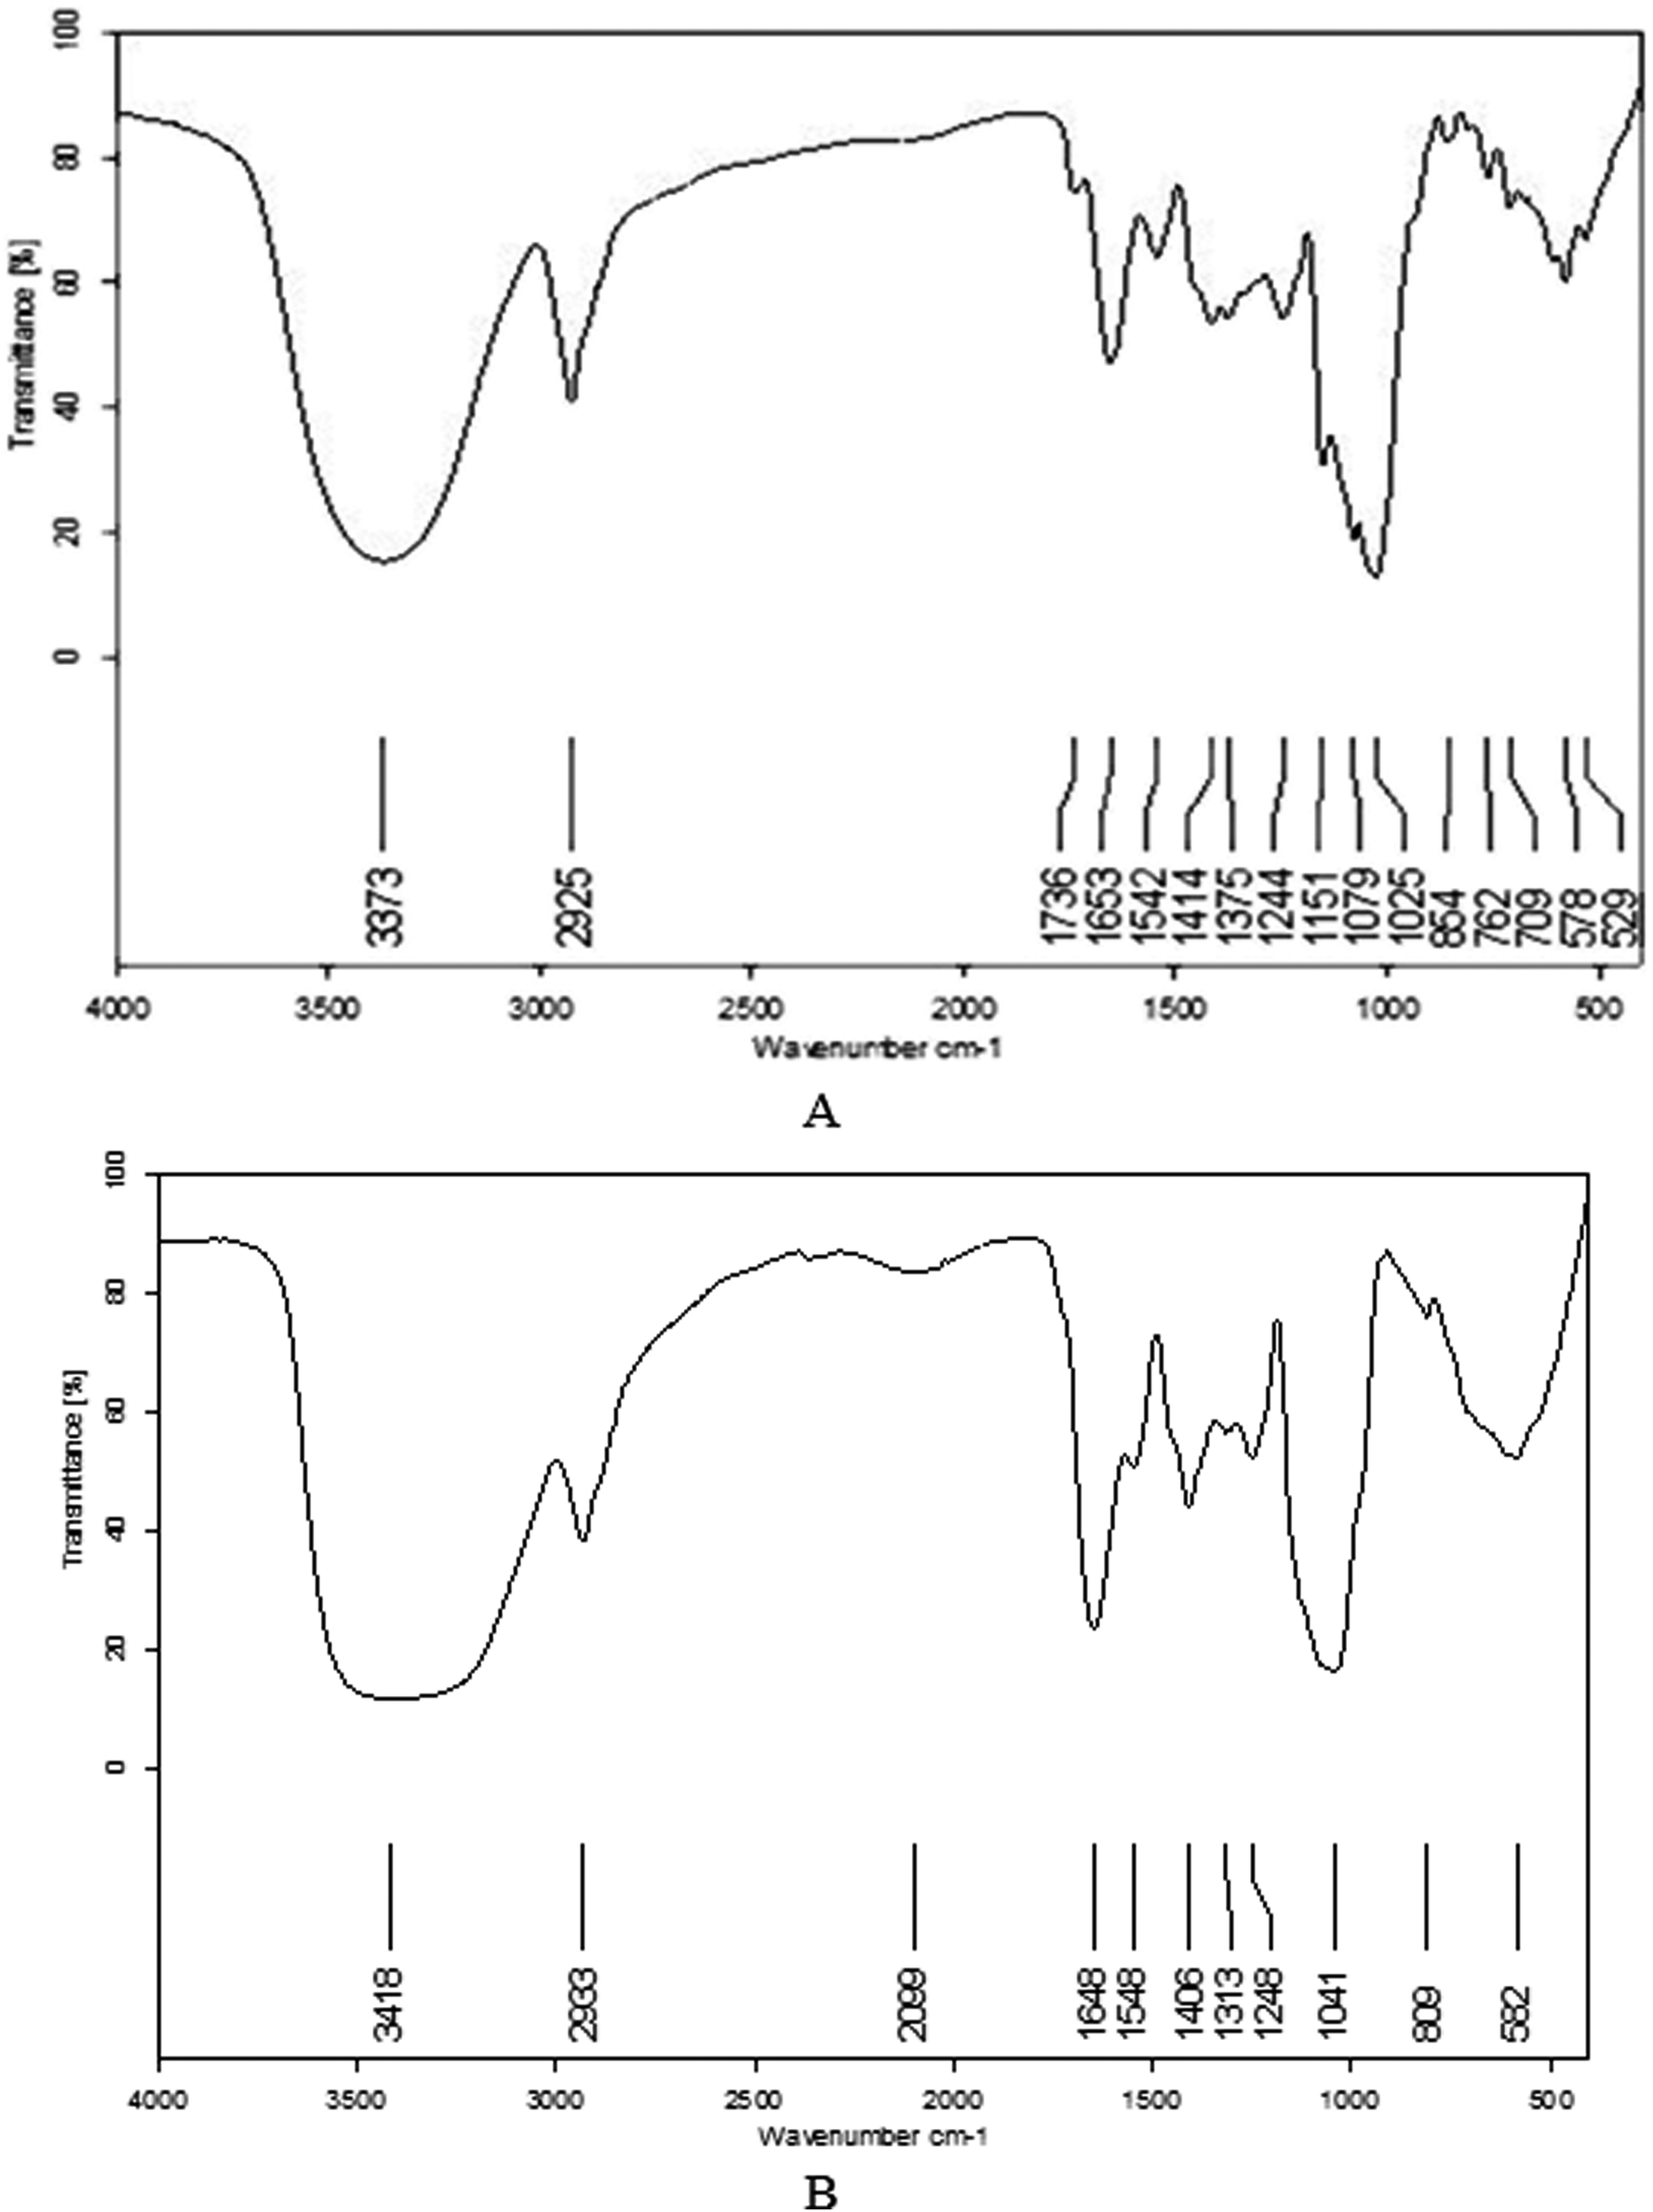 | ||
| Fig. 4 The IR spectrum of CPS-JC (A) and CPS-YH (B). | ||
The results of NMR analysis involving 1H-NMR and 13C-NMR experiments were used to assign the chemical shifts of the sugar residues.46 The 1H NMR spectrum of CPS-JC (Fig. 5A) showed that the anomeric proton resonance exceeded 4.95 ppm, and is attributed to α-pyranose. There were three primary anomeric H at δ5.374–δ4.964 ppm, indicating that CPS-JC was mainly composed of three types of sugar. Moreover, the 13C NMR spectrum of CPS-JC (Fig. 5C) displayed no signal at a low field from 160–180 ppm, which indicated that no uronic acid was present. Furthermore, three anomeric C at δ97–δ106 ppm were evident, and the peak at 99.76 ppm corresponded to C-1 of α-D-pyranose, which was in accordance with the analysis of the IR spectrum. The 1H NMR spectrum (Fig. 5B) and 13C NMR spectrum (Fig. 5D) of CPS-YH displayed similar signals when compared with CPS-JC. However, a weak signal at 106 ppm indicated that β-D-glycosidic linkage might be present in CPS-YH.
 | ||
| Fig. 5 1H NMR spectra of CPS-JC (A) and CPS-YH (B); 13C NMR spectra of CPS-JC (C) and CPS-YH (D) in D2O; GC chromatograms of the Smith degradation of CPS-JC (E) and CPS-YH (F). | ||
The periodate oxidation of CPS-JC and CPS-YH consumed 1.96 × 10⁻⁴ mol and 2.04 × 10⁻⁴ mol of NaIO4, respectively. No formic acid was observed, indicating the absence of 1→6 linked saccharides in the two samples. After Smith degradation analysis of the oxidation in CPS-JC (Fig. 5E) and CPS-YH (Fig. 5F), glycerol and a trace amount of erythritol were found in the degradation products using GC analysis. The molar ratio of glycerol and erythritol was 0.9164:0.0836 and 0.7686:0.2314, respectively in CPS-JC and CPS-YH. The relatively high content of glycerol was indicative of 1→2 linkage content in the main chain or branch. The substantially lower content of erythritol suggested the 1→4 linkages. The results from the periodate oxidation-Smith degradation indicated that 1→4, 1→2 linkages or 1→3 linkages might exist in CPS-JC and CPS-YH. These results implied that different fermentation conditions did not affect the linkage of carbohydrate chains.
Based on the TLC, GC, IR, NMR, and periodate oxidation-Smith degradation results, CPS-JC and CPS-YH might contain 1→4 linked Glcp residues, as well as some 1→2 linked, 1→3 linked Glcp residues. However, CPS-JC only had α-D-configuration, while CPS-YH had both α-D- and β-D-configurations.
Conclusion
The results of this research indicated that the balance of environmental and nutritional conditions control the biological activities of the C. gunnii polysaccharides. In optimized conditions, the highest inhibition ratio for IPS with α-glycosidic linkages in the S180 tumor cells reached 80%. However, IPS with a trace amount of β-glycosidic linkages displayed lower activity (less than 70%) in the same tumor cells. Additionally, the Mw of CPS-JC and CPS-YH were 8.8 × 10⁵ Da and 12.68 × 10⁵ Da, respectively, indicating that the IPS of C. gunnii with a higher Mw exhibited a higher inhibition ratio in S180 tumor cells. To conclude, the different fermentation conditions significantly affected the structure and anti-tumor activities of C. gunnii polysaccharides. The information obtained in this study will be used to examine the efficient and focused production of polysaccharides with anti-tumor properties in the submerged fermentation of Cordyceps. Further research about the inhibitory effect of polysaccharides on other tumor cells are in preparation.Conflicts of interest
There are no conflicts to declare.Acknowledgements
This work was financially supported by Sichuan Science and Technology Program (No. 2018ZR0283), the Open Research Subject of Key Laboratory (Research Base) of Food Bio-technology (No. szjj2017-107) and the National Natural Science Foundation of China (31871791).References
- Z. Y. Zhu, Y. Liu, C. L. Si, J. Yuan, Q. Lv and Y. Y. Li, Carbohydr. Polym., 2013, 92, 872–876 CrossRef CAS PubMed.
- Z. Y. Zhu, C. L. Si, Y. R. Zhong, C. M. Zhu, J. P. Zhou, A. J. Liu and Y. M. Zhang, J. Food Biochem., 2011, 35, 303–322 CrossRef CAS.
- B. Z. Zhang, P. S. Yan, H. Chen and J. He, Carbohydr. Polym., 2012, 87, 2569–2575 CrossRef CAS.
- Z. Y. Zhu, X. C. Liu, Y. L. Tang, F. Y. Dong, H. Q. Sun, L. Chen and Y. M. Zhang, J. Pharm. Biomed. Anal., 2016, 122, 494–498 CAS.
- L. Huang, Q. Z. Li, Y. Y. Chen, X. F. Wang and X. W. Zhou, Afr. J. Microbiol. Res., 2009, 3, 957–961 CAS.
- M. Mina, K. D. Shonkor, H. Masanori, F. Shinya and S. Akihiko, Process Biochem., 2014, 49, 181–187 CrossRef.
- F. S. Reis, L. Barros, R. C. Calhelha, A. Ćirić, L. J. van Griensven, M. Soković and I. C. Ferreira, Food Chem. Toxicol., 2013, 62, 91–98 CrossRef CAS PubMed.
- L. Y. Wang, K. L. Cheong, D. T. Wu, L. Z. Meng, J. Zhao and S. P. Li, Int. J. Biol. Macromol., 2015, 79, 180–185 CrossRef CAS PubMed.
- J. Zhao, J. Xie, L. Y. Wang and S. P. Li, J. Pharm. Biomed. Anal., 2014, 87, 271–289 CrossRef CAS PubMed.
- X. L. Chen, G. H. Wu and Z. L. Huang, Int. J. Biol. Macromol., 2013, 58, 18–22 CrossRef CAS PubMed.
- S. P. Nie, S. W. Cui, A. O. Phillips, M. Y. Xie, G. O. Phillips, S. Al-Assafd and X. L. Zhang, Carbohydr. Polym., 2011, 84, 894–899 CrossRef CAS.
- Z. Y. Zhu, N. Liu, C. L. Si, Y. Liu, L. N. Ding and J. Cheng, Carbohydr. Polym., 2012, 88, 1072–1076 CrossRef CAS.
- P. H. Leung, H. Zhao, K. P. Ho and J. Y. Wu, Food Chem., 2009, 114, 1251–1256 CrossRef CAS.
- R. M. Yu, W. Yang, L. Y. Song, C. Y. Yan, Z. Zhang and Y. Zhao, Carbohydr. Polym., 2007, 70, 430–436 CrossRef CAS.
- M. Zhang, L. Zhu, S. W. Cui, Q. Wang, T. Zhou and H. S. Shen, Int. J. Biol. Macromol., 2011, 48, 5–12 CrossRef CAS PubMed.
- L. Y. Zhao, Y. H. Dong, G. T. Chen and Q. H. Hu, Carbohydr. Polym., 2010, 80, 783–789 CrossRef CAS.
- J. S. Dixon and D. Lipkin, Anal. Chem., 1954, 26, 1092–1093 CrossRef CAS.
- L. D. Li, M. Z. Fan and Z. Z. Li, J. Microbiol., 2000, 27, 427–428 CAS.
- J. L. Casas López, J. A. Sánchez Pérez, J. M. Fernández Sevilla, F. G. Acién Fernández, E. Molina Grima and Y. Chisti, Enzyme Microb. Technol., 2003, 33, 270–277 CrossRef.
- S. W. Kim, H. J. Hwang, C. P. Xu, J. M. Sung, J. W. Choi and J. W. Yun, J. Appl. Microbiol., 2003, 94, 120–126 CrossRef PubMed.
- Y. W. Lin and B. H. Chiang, Process Biochem., 2008, 43, 244–250 CrossRef CAS.
- A. Kai, M. Kikawa, K. Hatanaka, K. Matsuzaki, T. Mimura and Y. Kaneko, Carbohydr. Polym., 2008, 54, 381–383 CrossRef.
- K. H. Shin, S. S. Lim, S. Lee, Y. S. Lee, S. H. Jung and S. Y. Cho, Phytother. Res., 2003, 17, 830–833 CrossRef PubMed.
- Q. L. Huang, Y. Jin, L. N. Zhang, P. C. K. Chenung and J. F. Kennedy, Carbohydr. Polym., 2007, 70, 324–333 CrossRef CAS.
- Z. Y. Zhu, F. Y. Dong, X. C. Liu, Q. Lv, F. Liu, L. T. Chen, T. Wang, Z. Wang and Y. M. Zhang, Carbohydr. Polym., 2016, 140, 461–471 CrossRef CAS PubMed.
- Y. Wei, L. W. Wang, D. J. Wang, D. Wang, C. W. Wen, B. X. Han and Z. Ouyang, Chin. Med., 2018, 13, 1–11 CrossRef PubMed.
- B. Salehi, M. Bayat, M. Dezfulian, A. Sabokbar and B. Tabaraie, Saudi J. Biol. Sci., 2018, 25, 1236–1241 CrossRef CAS PubMed.
- C. Wei, Z. Zhao, F. C. Shi and Q. L. Yong, Bioresour. Technol., 2008, 99, 3187–3194 CrossRef PubMed.
- J. K. Yan, W. Q. Wang and J. Y. Wu, J. Funct. Foods, 2014, 6, 33–47 CrossRef CAS.
- X. B. Mao and J. J. Zhong, Biotechnol. Prog., 2004, 20, 1408–1413 CrossRef CAS PubMed.
- S. A. Barker, E. J. Bourne, M. Stacey and D. H. Whiffen, J. Chem. Soc., 1954, 1, 171–176 RSC.
- A. Linker, L. R. Evans and G. Impallomeni, Carbohydr. Polym., 2001, 335, 45–54 CrossRef CAS.
- J. Dou, Y. H. Meng, L. Liu, J. Li, D. Y. Ren and Y. R. Guo, Int. J. Biol. Macromol., 2015, 72, 31–40 CrossRef CAS PubMed.
- S. Yang, L. Jin, X. D. Ren, J. H. Lu and Q. F. Meng, J. Food Drug Anal., 2014, 22, 468–476 CrossRef CAS PubMed.
- S. W. Zhan, J. Yang and J. Chen, Appl. Biocatal., 2004, 15, 256 Search PubMed.
- E. S. Lin and S. C. Sung, Int. J. Food Microbiol., 2006, 108, 182–187 CrossRef CAS PubMed.
- C. Hsieh, M. J. Tsai, T. H. Hsu, D. M. Chang and C. T. Lo, Appl. Biochem. Biotechnol., 2005, 120, 145–157 CrossRef CAS PubMed.
- M. Papagianni, Biotechnol. Adv., 2004, 22, 189–259 CrossRef CAS.
- S. W. Kim, C. P. Xu, H. J. Hwang, J. W. Choi, C. W. Kim and J. W. Yun, Biotechnol. Prog., 2003, 19, 428–435 CrossRef CAS PubMed.
- Q. F. Meng, X. Y. Lin and W. Li, Amino Acids Biotic Resour., 2005, 27, 33–35 Search PubMed.
- P. Xu, Z. Y. Ding, Z. Qian, C. X. Zhao and K. C. Zhang, Enzyme Microb. Technol., 2008, 42, 325–331 CrossRef CAS.
- Q. L. Huang, Y. Jin, L. N. Zhang, P. C. K. Cheung and J. F. Kennedy, Carbohydr. Polym., 2007, 70, 324–333 CrossRef CAS.
- Y. F. Peng, L. N. Zhang, F. B. Zeng and Y. X. Xu, Carbohydr. Polym., 2003, 54, 297–303 CrossRef CAS.
- J. Q. Wang, L. J. Kan, S. P. Nie, H. H. Chen, S. W. Cui, A. O. Phillips, G. O. Phillips, Y. J. Li and M. Y. Xie, LWT--Food Sci. Technol., 2015, 63, 2–7 CrossRef CAS.
- Y. Zhang, M. Gu, K. Wang, Z. X. Chen, L. Q. Dai, J. Y. Liu and F. Zeng, Fitoterapia, 2010, 81, 1163–1170 CrossRef CAS PubMed.
- H. Y. Li, W. J. Mao, Y. J. Hou, Y. Gao, X. H. Qi and C. Zhao, Bioresour. Technol., 2012, 114, 414–418 CrossRef CAS PubMed.
| This journal is © The Royal Society of Chemistry 2019 |