 Open Access Article
Preparation and electrochemical performance of nitrogen-enriched activated carbon derived from silkworm pupae waste
Vichuda
Sattayarut
 a,
Chalathorn
Chanthad
 b,
Pongtanawat
Khemthong
 b,
Sanchai
Kuboon
 b,
Thanthamrong
Wanchaem
a,
Mayuree
Phonyiem
 a,
Michiko
Obata
c,
Masatsugu
Fujishige
c,
Kenji
Takeuchi
*c,
Winadda
Wongwiriyapan
 *a,
Paisan
Khanchaitit
b and
Morinobu
Endo
c
aCollege of Nanotechnology, King Mongkut's Institute of Technology Ladkrabang, Chalongkrung Rd., Ladkrabang, Bangkok 10520, Thailand. E-mail: winadda.wo@kmitl.ac.th
bNational Nanotechnology Center (NANOTEC), National Science and Technology Development Agency (NSTDA), Pathum Thani 12120, Thailand
cInstitute of Carbon Science and Technology, Shinshu University, 4-17-1 Wakasato, Nagano, 380-8553, Japan. E-mail: takeuchi@endomoribu.shinshu-u.ac.jp
First published on 28th March 2019
Abstract
In this study, nitrogen-enriched activated carbon from silkworm pupae waste (P-AC) was successfully prepared and its electrochemical performances in aqueous and organic electrolytes were investigated. Silkworm pupae waste is beneficial because it is a nitrogen-enriched, inexpensive, and locally available material. The preparation process includes hydrothermal treatment of the silkworm pupae waste at 200 °C, and chemical activation using zinc chloride at activation temperatures of 700, 800 and 900 °C (P700, P800, and P900, respectively). The nitrogen content in the P-ACs was approximately 3.8–6.4 at%, decreasing with activation temperature, while the surface area was approximately 1062–1267 m2 g−1, increasing with activation temperature. Compared to a commercial AC, the P-ACs show higher nitrogen content but lower surface area. Furthermore, the P800 exhibited superior specific capacitance (154.6 and 91.6 F g−1 in aqueous and organic electrolytes) compared to a commercial AC despite possessing smaller surface area. The high nitrogen content enhanced the pseudocapacitance and improved the electrical conductivity of the P-ACs. These properties were confirmed by relatively low series and charge transfer resistances, a capacity retention higher than 88% at a current density of 0.5 A g−1 and excellent cycling stability demonstrated by maintaining 97.6% of its capacitance after 3000 cycles. These results demonstrate that silkworm pupae waste is a viable source of nitrogen-enriched AC for application in supercapacitors.
1. Introduction
Energy storage devices play a crucial role in enabling the transition from fossil fuels to renewable energy sources. Supercapacitors, also known as an electrochemical capacitors (ECs), bridge the gap between batteries and conventional capacitors and have been actively investigated because of their great advantages including high power density, high rates of charge/discharge, and long cycle life.1–3 According to their charge storage mechanism, supercapacitors are classified as (i) electrical double-layer capacitors (EDLCs), storing energy using ion adsorption, (ii) pseudocapacitors, using fast surface redox reactions, and (iii) hybrid supercapacitors incorporating a combination of double layers and pseudocapacitance.4 Supercapacitors consist of three important parts: an electrode, a separator and an electrolyte. High surface area activated carbon (AC) materials are of great technological importance for electrode materials due to their diverse functionalities, large surface area and good chemical and electrochemical stability.5 Fundamentally, the performance of supercapacitors mainly depends on the capability of carbon materials to interact with ions and to transport electrons. Despite these advantages, AC, especially AC synthesized from coal or biomass (e.g. coconut shell) suffers from several drawbacks, particularly a decrease in electrical conductivity with increasing surface area owing to its pore tortuosity and poor pore connectivity. Recently, substantial effort has been expended to improve the performance of energy storage devices based on carbon electrodes through heteroatom functionalities, such as nitrogen, sulfur or oxygen.6–12 Possible explanations for the capacitance increase are the faradaic reaction of the heteroatom-containing functional groups, the improvement of wettability of the pore walls and the increase in conductivity of the porous materials. The incorporation of nitrogen was achieved either by treating carbon materials with ammonia or nitrogen-based gas or chemicals.9,13 However, this method is complex and toxic. Thus, a facile method which can be promoted to industrial production is required.Biomass refers to a class of low-cost carbon precursor with diverse microstructures. These materials have been widely investigated in recent years. The microstructure and the elemental composition of the resulting AC largely depend on the raw material. Thus, by selecting appropriate carbon raw materials, the ACs with a controlled microstructure and doped with the required heteroatoms could be obtained. For example, nitrogen-doped ACs have been successfully synthesized from nitrogen-containing plants and animals such as green leaves, soy beans, yogurt, endothelium corneum gigeriae galli and silk cocoons.14–18 On the other hand, sericulture in Thailand involving silkworm raising, mulberry production and silk industry has continued to grow steadily due to a rising demand for Thai silk on the international markets. Cocoons enclosing the pupa have been used to produce silk fibers, thus there is a large excess of silkworm pupae waste from silk fabric industry. A large budget is required for waste disposal. However, silkworm pupae are made up of high concentrations of protein that contain all the essential amino acids.19 Adding value to silkworm pupae by using it as a raw material for nitrogen-enriched AC is a significant challenge.
In this study, nitrogen-enriched AC from silkworm pupae waste (P-AC) was successfully prepared and its electrochemical performances in aqueous and organic electrolytes were investigated. P-AC was synthesized by hydrothermal treatment at 200 °C followed by zinc chloride (ZnCl2) activation. The surface area tended to increase, while the nitrogen content decreased as the activation temperature increased. The P-ACs activated at 800 °C (P800) showed the highest specific capacitance, surpassing commercial AC (YP50) even though it possessed lower surface area. The capacitance improvement of the P800 is dominantly attributed to the existence of the nitrogen-containing functional groups rather than the high surface area, resulting in a higher conductivity of electrode material and an enhancement of the charge transfer between electrode material and electrolyte.
2. Materials and methods
2.1 Preparation of silkworm pupae waste-derived activated carbon
Silkworm pupae waste was collected from the silk industry in Thailand and was blended after drying. The pupae were further ground into powder by ball milling. The ground pupae were mixed with 1 M acetic acid aqueous solution at a weight ratio of 1![[thin space (1/6-em)]](https://www.rsc.org/images/entities/char_2009.gif) :
:![[thin space (1/6-em)]](https://www.rsc.org/images/entities/char_2009.gif) 3 and were stirred at room temperature. The mixture was sealed into a Teflon-lined stainless steel autoclave (250 mL) for hydrothermal treatment at 200 °C. During the hydrothermal process, the organic substances were decomposed by the dehydration reaction to form condensed carbonaceous solid product.20 The pupae after hydrothermal treatment (hereinafter referred to as P-HTC) were washed by ethanol and dried at 120 °C overnight. Next, 2 g of the P-HTC was mixed with 6 g of ZnCl2 in 15 mL of ethanol and then stirred thoroughly. Subsequently, the mixture was dried at 110 °C to evaporate the solvent. To obtain the porous structure, the mixture was then activated at different temperatures of 700, 800 and 900 °C at a ramping rate of 5 °C min−1 for 2 h under nitrogen (99.999%) atmosphere at a flow rate of 300 mL min−1. After activation, the sample was washed with 1 M HCl by stirring at 100 °C and subsequently washed with DI water until it reached a pH value of 7. Finally, the sample was dried at 110 °C overnight. The silkworm pupae-derived ACs at activated temperatures of 700, 800 and 900 °C were hereafter referred to as P700, P800 and P900, respectively.
3 and were stirred at room temperature. The mixture was sealed into a Teflon-lined stainless steel autoclave (250 mL) for hydrothermal treatment at 200 °C. During the hydrothermal process, the organic substances were decomposed by the dehydration reaction to form condensed carbonaceous solid product.20 The pupae after hydrothermal treatment (hereinafter referred to as P-HTC) were washed by ethanol and dried at 120 °C overnight. Next, 2 g of the P-HTC was mixed with 6 g of ZnCl2 in 15 mL of ethanol and then stirred thoroughly. Subsequently, the mixture was dried at 110 °C to evaporate the solvent. To obtain the porous structure, the mixture was then activated at different temperatures of 700, 800 and 900 °C at a ramping rate of 5 °C min−1 for 2 h under nitrogen (99.999%) atmosphere at a flow rate of 300 mL min−1. After activation, the sample was washed with 1 M HCl by stirring at 100 °C and subsequently washed with DI water until it reached a pH value of 7. Finally, the sample was dried at 110 °C overnight. The silkworm pupae-derived ACs at activated temperatures of 700, 800 and 900 °C were hereafter referred to as P700, P800 and P900, respectively.
2.2 Characterization of silkworm pupae waste-derived activated carbon
The morphology and internal structure of the pupae after hydrothermal treatment and chemical activation was characterized by field-emission scanning electron microscopy (FE-SEM) (HITACHI SU5000) at 10 kV and transmission electron microscope (TEM) (JEOL JEM-2010) at 200 kV. The crystal plane analysis of the P-ACs were analyzed by X-ray diffractometry (XRD) (Rigaku SmartLab Studio II). X-ray photoelectron spectroscopy (XPS) (PHI Quantera II) was used to investigate the elemental compositions, atomic concentration and chemical states of the P-ACs. The nitrogen-adsorption isotherms analysis of the P-ACs was performed using a gas adsorption instrument (Micromeritics ASAP 2020). The P-ACs were degassed at 350 °C for 12 h prior to nitrogen adsorption measurements. The Brunauer–Emmett–Teller (BET) surface area (SBET) was calculated from N2 adsorption isotherms in the relative pressure range from 0.002 to 0.995, while the pore size distribution was calculated by using the nonlocal density functional theory (NLDFT) method. The total pore volume (Vtotal) was estimated from the adsorbed amount at the relative pressure (P/P0) of 0.995, and then micropore volume (Vmicro) was calculated using the DFT method, while the micropore surface area (Smicro) was calculated using the t-plot method.2.3 Electrode preparation and characterization of electrochemical performance
P-AC was used as an electrode material in supercapacitors and its electrochemical properties were evaluated. The electrode paste was prepared by a procedure similar to those described elsewhere.18 Briefly, the P-AC, carbon black (CB) and polytetrafluoroethylene (PTFE) were mixed together at the weight ratio of 90![[thin space (1/6-em)]](https://www.rsc.org/images/entities/char_2009.gif) :
:![[thin space (1/6-em)]](https://www.rsc.org/images/entities/char_2009.gif) 5
5![[thin space (1/6-em)]](https://www.rsc.org/images/entities/char_2009.gif) :
:![[thin space (1/6-em)]](https://www.rsc.org/images/entities/char_2009.gif) 5 in a mortar. Then, the mixture was pressed under a pressure of 10 kN using a 10 mm diameter mold to form an electrode pellet. The electrochemical properties of the electrode material and cell were characterized by three- and two-electrode system, respectively. In the case of the three-electrode system, the P-AC was used as a working electrode on Ni foam as a current collector. The Pt and Ag/AgCl were used as counter and reference electrodes, respectively, and 1 M Na2SO4 aqueous solution was used as an electrolyte. For the two-electrode cell, two pellets of P-AC were assembled into a coin cell structure, separated by a 30 µm-thick membrane using 1 M tetraethylammonium tetrafluoroborate (TEABF4) as an electrolyte. The electrochemical properties were characterized by cyclic voltammetry (CV), galvanostatic charge/discharge (CD), and electrochemical impedance spectroscopy (EIS) techniques. For comparison, the commercial AC (YP50) was also used to prepare a supercapacitor electrode with the same procedure as the P-ACs and its electrochemical properties were investigated. For the Na2SO4 aqueous electrolyte, CV tests were operated in the potential range of −0.2–0.8 V at a scan rate of 5 mV s−1 and CD tests were carried out in the potential range of 0.0–1.0 V at a current density of 0.2 A g−1. EIS was measured in the frequency range between 1 Hz to 1 MHz at an amplitude of 5 mV. In the case of TEABF4 organic electrolyte, CV and CD tests were operated in the potential rang of 0.0 to 2.5 V with a voltage scan rate of 5 mV s−1 for the CV test and with an applied current density of 0.05 A g−1 for the CD test. The specific capacitance of the electrode materials in the three-electrode system (CS) were evaluated from CD curves using the following equations:
5 in a mortar. Then, the mixture was pressed under a pressure of 10 kN using a 10 mm diameter mold to form an electrode pellet. The electrochemical properties of the electrode material and cell were characterized by three- and two-electrode system, respectively. In the case of the three-electrode system, the P-AC was used as a working electrode on Ni foam as a current collector. The Pt and Ag/AgCl were used as counter and reference electrodes, respectively, and 1 M Na2SO4 aqueous solution was used as an electrolyte. For the two-electrode cell, two pellets of P-AC were assembled into a coin cell structure, separated by a 30 µm-thick membrane using 1 M tetraethylammonium tetrafluoroborate (TEABF4) as an electrolyte. The electrochemical properties were characterized by cyclic voltammetry (CV), galvanostatic charge/discharge (CD), and electrochemical impedance spectroscopy (EIS) techniques. For comparison, the commercial AC (YP50) was also used to prepare a supercapacitor electrode with the same procedure as the P-ACs and its electrochemical properties were investigated. For the Na2SO4 aqueous electrolyte, CV tests were operated in the potential range of −0.2–0.8 V at a scan rate of 5 mV s−1 and CD tests were carried out in the potential range of 0.0–1.0 V at a current density of 0.2 A g−1. EIS was measured in the frequency range between 1 Hz to 1 MHz at an amplitude of 5 mV. In the case of TEABF4 organic electrolyte, CV and CD tests were operated in the potential rang of 0.0 to 2.5 V with a voltage scan rate of 5 mV s−1 for the CV test and with an applied current density of 0.05 A g−1 for the CD test. The specific capacitance of the electrode materials in the three-electrode system (CS) were evaluated from CD curves using the following equations: | (1) |
 | (2) |
 | (3) |
3. Results and discussion
3.1 Morphology and structure characterization
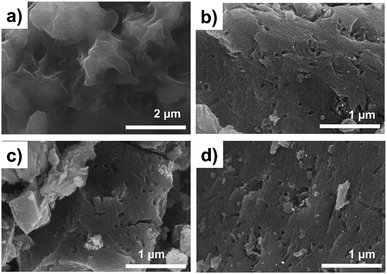
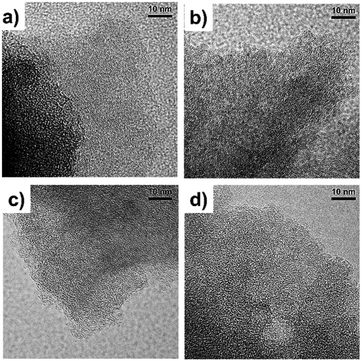
Fig. 1 contains a schematic illustration of the AC synthesis and corresponding photographs of products during each process. P-HTC was yellowish and the P-ACs became black in color after chemical activation. Fig. 2a–d show SEM images of the P-HTC, P700, P800 and P900, respectively. It is clearly seen that the morphologies of the P-HTC and the P-ACs are completely different. The surface of particulated P-HTC was relatively smooth and nonporous, while those of the P-ACs were rough with sponge-like pores formed entirely on the surface. These pores resulted from the chemical reaction of ZnCl2 during heat treatment,21 leaving empty spaces in the carbon structure. Considering SEM images of the P-ACs, the macroscopic morphology of each sample is similar. It is hard to observe micropores and mesopores of each sample from the SEM images. Hence, Fig. 3a–d show TEM images which reveal the bright fringes in the pictures, implying the micropore structure of ACs. | ||
| Fig. 1 Schematic illustration of AC synthesis and corresponding photographs of products of each process. | ||
The porous structure, surface area and volume were investigated by the nitrogen adsorption–desorption isotherms Fig. 4a shows nitrogen adsorption–desorption isotherms of the P-ACs and YP50, which are significantly different. The nitrogen adsorption–desorption isotherms of YP50 are extremely sharp at the low-pressure range, then parallel to the relative pressure axis at the high-pressure range. The adsorption and desorption branches followed nearly the same path with a relatively narrow hysteresis loop. Thus, the YP50 can be classified as possessing Type I isotherms (refer to the IUPAC22) with microporous solid pore characteristics. On the other hand, each P-AC sample displays a low level of adsorption volume at the low-pressure range and shows a hysteresis loop at the high-pressure range due to the capillary condensation on the mesopores. These can be classified as the typical Type IV isotherms. When the activation temperature increases, the slope of the adsorption–desorption isotherms gradually increases, and the hysteresis loop that appeared in the region of relative pressure between 0.4–1.0 of P/P0 also became larger. These results indicate the presence of cylindrical-shaped pores and well-developed mesoporosity.23
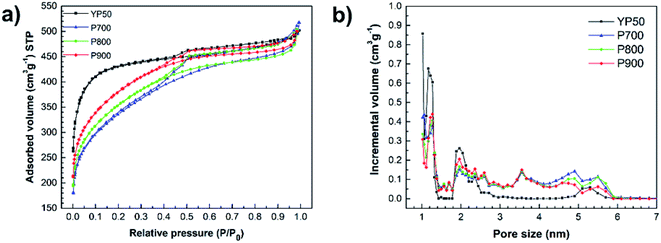 | ||
| Fig. 4 (a) Nitrogen adsorption and desorption isotherms at 77 K, and (b) pore size distribution of the P700, P800, P900 and YP50. | ||
The pore size distribution of each sample obtained by the DFT method is shown in Fig. 4b, and the surface area, pore volume, and pore size of each sample are summarized in Table 1. The pore size distribution of the YP50 is mostly in the range of 1.0–2.0 nm, containing mainly micropores while the P-ACs show a pore size distribution between 1.0–6.0 nm, consisting both of micropores and mesopores, in agreement with the data in Table 1. The YP50 has the highest values of SBET (1336 m2 g−1), the ratio of micropore surface area and SBET (Smicro/SBET) (0.94) and the ratio of micropore volume to the total volume (Vmicro/Vtotal) (0.82), as shown in Table 1. For the P-ACs, the values of SBET, Smicro/SBET and Vmicro/Vtotal of each sample is in the following order: P700 (1062 m2 g−1, 0.77, 0.55) < P800 (1187 m2 g−1, 0.87, 0.71) < P900 (1267 m2 g−1, 0.90, 0.78). These results indicate that the higher temperature influences the surface area and micropores of the P-ACs. The average pore size of each samples is in the following order: YP50 < P900 < P800 < P700.
| Samples | S BET a (m2 g−1) | S micro b (m2 g−1) | S meso b (m2 g−1) | S micro/SBET | S meso/SBET | Pore diameterc (nm) | V total d (cm3 g−1) | V micro d (cm3 g−1) | V meso d (cm3 g−1) | V micro/Vtotal | V meso/Vtotal |
|---|---|---|---|---|---|---|---|---|---|---|---|
| a BET specific surface area. b Micropore surface area from t-plot method. c Pore diameter from DA method. d Micropore–mesopore volume from DFT method. | |||||||||||
| YP50 | 1336 | 1263 | 73 | 0.94 | 0.05 | 1.46 | 0.72 | 0.59 | 0.13 | 0.82 | 0.17 |
| P700 | 1062 | 824 | 238 | 0.77 | 0.22 | 1.54 | 0.77 | 0.43 | 0.34 | 0.55 | 0.44 |
| P800 | 1188 | 1033 | 155 | 0.87 | 0.13 | 1.48 | 0.73 | 0.52 | 0.21 | 0.71 | 0.28 |
| P900 | 1267 | 1142 | 125 | 0.90 | 0.10 | 1.48 | 0.73 | 0.57 | 0.16 | 0.78 | 0.21 |
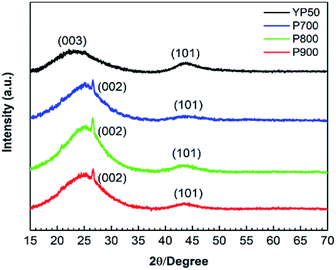
The crystalline structures of the P-ACs and YP50 were analyzed by XRD technique in the 2θ range of 10° to 70°. The XRD patterns of each sample are shown in Fig. 5. The broad peaks at approximately 24.7 and 44.6° of the YP50 are caused by amorphous carbon, while the sharp peak at approximately 26.4° of the P-ACs corresponding to the (002) plane of the graphitic carbon.24 The difference in crystalline structure of YP50, a typical steam-activated carbon from coconut shell, and the P-ACs is likely due to the difference in the activation process between steam activation and chemical activation, and the specific characteristics differences between the coconut shell and silkworm pupae raw materials.
Recently, the nitrogen-enriched AC has been considered as a promising material for supercapacitor applications due to additional pseudo-capacitance as well as conductivity improvement. The empirical composition and chemical states of the elements existing within the P-ACs were quantitatively investigated by XPS. Table 2 shows quantitative analysis of the elemental composition. From the XPS-wide scan spectra, the P-ACs are basically composed of carbon, nitrogen and oxygen elements without any other obvious impurities, while there are only carbon and oxygen found in the YP50. The nitrogen contents of P700, P800 and P900 are 6.40, 5.20 and 3.80 at%, respectively. These results show that the nitrogen-enriched AC was successfully obtained using silkworm pupae waste as a raw material. The N/C ratios of P700, P800 and P900 were 0.07, 0.06 and 0.04, respectively. The P700 showed the highest N/C ratio, however when the temperature increased to 900 °C, the N/C ratio dramatically decreased.
| Samples | Element content (at%) | O/C ratio | N/C ratio | Relative N 1s peak area (at%) | |||||||
|---|---|---|---|---|---|---|---|---|---|---|---|
| C | O | N | N-6 | N-5 | N-Q | N-X | (N-6) + (N-5) | (N-Q)/[(N-6) + (N-5)] | |||
| a Pyridine N (N-6), pyrrolic N (N-5), quaternary N (N-Q) and oxidized pyridine N (N-X). | |||||||||||
| YP50 | 95.56 | 4.44 | — | 0.04 | — | — | — | — | — | — | — |
| P700 | 86.50 | 7.10 | 6.40 | 0.08 | 0.07 | 1.03 | 2.00 | 2.43 | 0.95 | 3.02 | 0.80 |
| P800 | 88.40 | 6.40 | 5.20 | 0.07 | 0.06 | 1.01 | 1.44 | 2.22 | 0.53 | 2.45 | 0.90 |
| P900 | 88.80 | 7.40 | 3.80 | 0.08 | 0.04 | 0.42 | 1.14 | 1.94 | 0.30 | 1.56 | 1.24 |
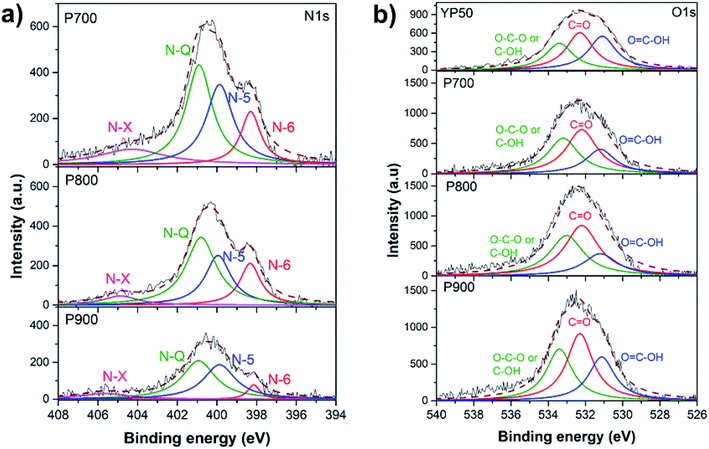
The N 1s spectra of the P-ACs were further fit to analyze the nitrogen-bonding configuration. Fig. 6a shows the N 1s spectra obtained from P700, P800 and P900. The high-resolution N 1s spectrum can be deconvoluted into four kinds of nitrogen groups, indicating that nitrogen atoms are in four different chemical states in the carbon network. The peaks at 398.3, 399.8, 401.1 and 403.6 eV can be ascribed to the pyridinic nitrogen (N-6), pyrrolic nitrogen (N-5), quaternary nitrogen (N-Q), and oxidized nitrogen (N-X), respectively.25,26 Based on the peak area, the content ratios of each nitrogen-bonding configuration were calculated and shown in Table 2. Normally, N-X is formed by the oxidization of N-6 groups during the heat treatment process.26,27 The contents of N-5 and N-6 decreased after chemical activation at elevated temperature with the following order: P700 > P800 > P900. Normally, nitrogen content decreases upon increasing activation temperature.28 However, the ratio of (N-Q)/[(N-5) + (N-6)] increases from P700 to P900 as shown in Table 2. This contributed to the rearrangement of N-Q or graphitic-N from the defective structures of N-5 and N-6 upon thermal treatment.26,27 Next, the O 1s spectra were deconvoluted as shown in Fig. 6b. Oxygen-containing configurations of all samples are classified into three groups, including O![[double bond, length as m-dash]](https://www.rsc.org/images/entities/char_e001.gif) C–OH in carboxyl groups (531.2), C
C–OH in carboxyl groups (531.2), C![[double bond, length as m-dash]](https://www.rsc.org/images/entities/char_e001.gif) O in carbonyl groups (532.2 eV) and C–OH in phenol groups and/or C–O–C in ether groups (533.2 eV).9,29,30 The content of C
O in carbonyl groups (532.2 eV) and C–OH in phenol groups and/or C–O–C in ether groups (533.2 eV).9,29,30 The content of C![[double bond, length as m-dash]](https://www.rsc.org/images/entities/char_e001.gif) O tends to increase at high temperature. Table 2 shows the O contents and O/C ratios of all samples. The YP50 shows the lowest O/C ratio, while there are no obvious differences in that of the P-ACs. The oxygen contents of the P-ACs are nearly 2 times higher than that of the YP50. Normally, binding energy of O 1s is relatively higher than that of N 1s. At higher activation temperature, nitrogen-functional groups decreased with a ratio higher than that of oxygen-functional groups, resulting in a higher oxygen content of P900 compared to that of P800.
O tends to increase at high temperature. Table 2 shows the O contents and O/C ratios of all samples. The YP50 shows the lowest O/C ratio, while there are no obvious differences in that of the P-ACs. The oxygen contents of the P-ACs are nearly 2 times higher than that of the YP50. Normally, binding energy of O 1s is relatively higher than that of N 1s. At higher activation temperature, nitrogen-functional groups decreased with a ratio higher than that of oxygen-functional groups, resulting in a higher oxygen content of P900 compared to that of P800.
3.2 Electrochemical performance in aqueous electrolyte
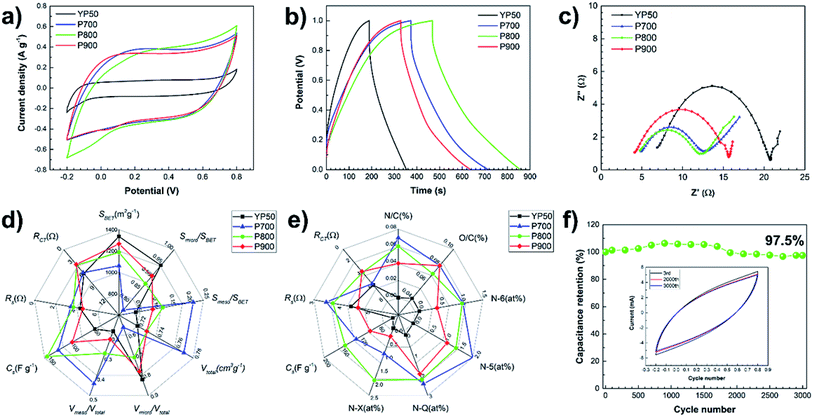
Fig. 7 shows the electrochemical properties of the P-ACs and YP50 in 1 M Na2SO4 aqueous electrolyte. Fig. 7a shows the CV curves of all samples at a scan rates of 5 mV s−1 in the potential range of −0.2–0.8 V. The CV curves of the YP50 exhibited quasi-rectangular shape, indicating the electrical double layer capacitor behavior,31 while those of the P-ACs displayed a slight distortion and hump located at approximately 0 V generated from redox reactions of the nitrogen functionalities.32,33 The area of the CV curves for the P-ACs are larger than that of the YP50 implying a high capacitance even though the P-ACs possess smaller surface area. Fig. 7b shows the galvanostatic CD curves in the potential range of 0.0–1.0 V at a current density of 0.2 A g−1. All CD curves are a quasi-triangular shape with nearly linear response, indicating good electrochemical reversibility and supercapacitive behavior.34 The P-ACs show longer charge–discharge than YP50, implying a high specific capacitance of the P-ACs. The value of the gravimetric and volumetric capacitances of each electrode calculated from the CD curves were in the following order: P800 (154.6 F g−1, 86.17 F cm−3) > P700 (130.9 F g−1, 71.15 F cm−3) > P900 (100.6 F g−1, 51.88 F cm−3) > YP50 (51.9 F g−1, 25.95 F cm−3). The P800 shows the highest values while the YP50 shows the lowest values in all gravimetric and volumetric capacitances.Fig. 7c displays the Nyquist plots of each electrode in the frequency range between 1 Hz to 1 MHz with an amplitude of 5 mV. The EIS spectra consist of a semicircle in the high-frequency and a linear line in the low-frequency regions. All electrodes show similar semicircle curves, but different offsets on the x-axis and different diameters, revealing the different electrochemical characteristics of the electrode. The offset on the x-axis (Z′ (Ω)) of the high-frequency semicircle is the series resistance (RS) of the electrode consisting of the electrode material resistance, the electrolyte resistance and the contact resistance between the electrode material and the current collector. The values of RS of the P700, P800, P900 and YP50 are estimated to be 4.8, 4.7, 4.1, and 6.8 Ω, respectively. The diameter of the semicircle represents the kinetic resistance to the charge transfer, called the charge transfer resistance (RCT). The values of RCT of the P700, P800, P900 and YP50 are estimated to be 7.7, 7.3, 11.5, and 13.9 Ω, respectively.
Commonly, the key parameters for high performance supercapacitor are surface area, porosity and the presence of heteroatoms on the surface of the carbon materials.23,35,36 Although possessing the highest surface area, the narrowest pore size distribution and the smallest pore diameter, the YP50 does not exhibit the highest electrochemical performance. On the other hand, the nitrogen-enriched P-ACs show higher specific capacitance than the YP50, implying that the nitrogen content plays a dominant role in enhancing the electrochemical performance. However, the P700 with the highest nitrogen content shows a lower specific capacitance than that of the P800. This means that it is still necessary to adjust the optimum ratio between the nitrogen content and surface area. The difference in RS and RCT values of each electrode may be related to surface area and elemental composition. Normally, the ACs with relatively high surface area possessing micropore structure tend to have high resistance due to the discontinuity of the conductivity path in the porous structure. Moreover, recent research has proven that the N-Q contributing nitrogen inside the aromatic ring (graphitic N) with sp2 hybridization and fully saturated bonding can enhance the electrical conductivity of carbon materials.37 Thus, the P-ACs with a lower surface area while having mesopores and nitrogen-containing configurations show a lower RS than the YP50.
Fig. 7d and e display the radar plots to compare the electrochemical performance of each electrode to their porosity properties and nitrogen-containing configurations, respectively. It is difficult to assess completely the direct factor that contributes to the high electrochemical performance. Nevertheless, a correlation of the electrochemical performance, porosity properties and chemical composition have been found from the Radar plot. The Radar plot also shows that the nitrogen-containing groups and the optimum ratio of meso- and micro-porous structures are the dominant factor towards high specific capacitance with low RS and RCT. The role of nitrogen-containing groups can be described similarly to the AC derived from green leaves as follows:18 (i) negatively charged N-6 and N-5 can improve the accommodation of hydrogen atom and proton affiliation, thereby causing the faradic reaction that contributes to pseudocapacitance.5,18 (ii) Positively charged N-Q and N-X may help in electron transfer through the porous carbon, resulting in enhanced capacitance and reduced RS.8,9 (iii) The presence of oxygenated functional groups may improve the wettability of the carbon surface and increase the pseudocapacitance by taking part in a faradaic reaction.38 This is evidenced by the reduction of RCT and the increase in specific capacitance for the P-ACs. In addition, as shown in Fig. 7f, the high electrochemical performance of P800 exhibits capacitance retention of 97.5% after 3000 cycles by using CV measurements at the scan rate of 20 mV s−1 under a voltage window of −0.2–0.8 V, indicating the good electrochemical cycling stability. The inset of Fig. 7f shows the CV curves of P800 after the 3rd, 2000th and 3000th cycles, showing no obvious changes in CV curves.
3.3 Electrochemical performance in organic electrolyte
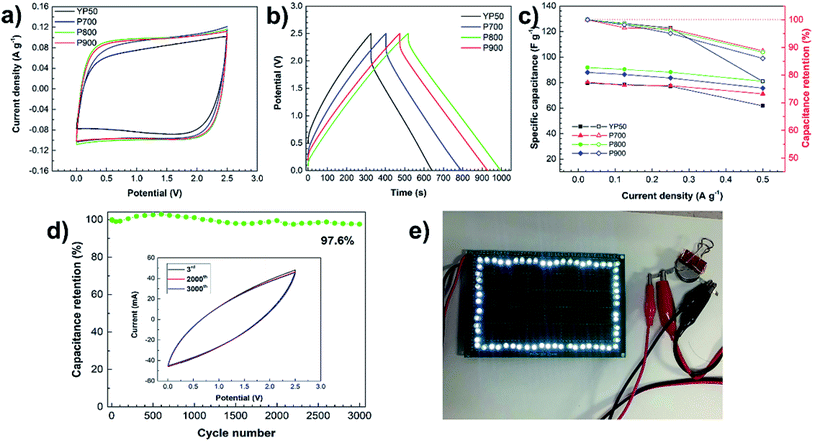
Normally, the final operating window voltage of supercapacitors is dependent on the electrolyte stability. This study has focused on aqueous electrolyte, but it poses a significant voltage limitation of approximately 1 V determined by the electrochemical breakdown of water.39 Thus, an organic electrolyte with the cell operating voltage up to 2.7 V39,40 is attractive for high-energy applications. The electrochemical performances of the P-ACs and YP50 were investigated in an organic electrolyte based on 1 M TEABF4 dissolved in propylene carbonate using a two-electrode cell. Fig. 8a displays the CV curves of all samples with quasi-rectangular shapes and similar size at a scan rate of 5 mV s−1 in the potential range of 0–2.5 V, confirming an ideal capacitive behavior.31 The CD curves in Fig. 8b exhibit nearly symmetric triangular shapes with an applied current density of 0.2 A g−1. The values of the specific capacitance of each electrode calculated from the CD curves were in the following order: P800 (91.6 F g−1) > P900 (87.6 F g−1) > P700 (80.0 F g−1) > YP50 (79.2 F g−1). The calculated energy and power density of P700, P800, P900, and YP50 are approximately 69.6, 79.6, 76.0 and 68.8 W h kg−1, and 20.0, 23.2, 22.4 and 20.4 kW kg−1, respectively. The values of the electrochemical properties of each sample are not markedly different as those in the aqueous electrolyte, but the P800 shows the highest values while the YP50 shows the lowest values. The large difference in specific capacitances between aqueous and organic electrolytes is attributed to the differences in ionic conductivity, ion size and effect of nitrogen-containing functional groups of each electrolyte. The aqueous electrolyte has advantages in terms of high ionic conductivity (up to ∼1 S cm2 mol−1) and low viscosity, leading to fast ion mobility.41,42 The smaller ion size of aqueous electrolyte compared to that of organic electrolyte makes it effectively transfer through the micro- and mesopores.43,45 Moreover, the nitrogen-containing functional groups can effectively enhance faradic reaction and improve wettability of the carbon surface in the case of aqueous electrolyte.Normally, in the case of organic electrolytes, the solvated ions are larger than the bare ions. The sizes of the solvated and desolvated tetraethylammonium (TEA+) are 1.35 and 0.67 nm and those of the solvated and desolvated tetrafluoroborate (BF4−) are 1.40 and 0.48 nm.44 Currently, there is a general agreement that desolvated or partial desolvated ions can potentially have access into the pores.45 Thus, it is difficult to compare the electrochemical performance in terms of the effect of surface are and pore distribution.42,45 However, the moderated surface of P800 with an average pore diameter of 1.48 nm shows the highest value, implying that the nitrogenated functional groups and an existence of mesoporous structure also contributed to the supercapacitor enhancement in organic electrolyte systems. The retention of the specific capacitance at various current densities is shown in Fig. 8c. The P-ACs tend to gradually decrease, while the YP50 is dramatically decreased after applying the high current density of 0.5 A g−1. At the current density of 0.5 A g−1, the specific capacitance values of each electrode were in the following order: P800 (80.2 F g−1) > P900 (75.6 F g−1) > P700 (71.2 F g−1) > YP50 (61.6 F g−1), and the capacitance retentions were in the following order: P700 (88.7%) > P800 (88.2%) > P900 (88.0%) > YP50 (77.7%). The P-ACs showed good capacitance retention higher than 88%, while the YP50 is only 77%. The probable reasons may be ascribed to the existence of the N-Q that enhances the electrical conductivity of the carbon material.37 In addition, as shown in Fig. 8d, the high electrochemical performance of P800 exhibits capacitance retention of 97.6% after 3000 cycles by using CV measurements at the scan rate of 20 mV s−1 under a voltage window of 0.0–2.5 V, indicating the good electrochemical cycling stability. The inset of Fig. 8d shows the CV curves of P800 after the 3rd, 2000th and 3000th cycles, showing no obvious changes in CV curves. These results show that ACs derived from pupae wastes are stable both in aqueous and organic electrolytes. Moreover, as shown in Fig. 8e, a two-electrode coin cell type supercapacitor can successfully illuminate the 64 super bright white LEDs (3.2–3.5 V) by connecting two coil cells in series.
4. Conclusions
In summary, the silkworm pupae waste-derived nitrogen-enriched AC (P-AC) was successfully synthesized by hydrothermal treatment and ZnCl2 activation at 700, 800 and 900 °C. Compared to a commercial AC (YP50), the P-ACs show higher nitrogen content but lower surface area. The nitrogen content of the P-ACs is approximately 3.8–6.4 at%, decreasing with activation temperature, while the surface area is approximately 1062–1267 m2 g−1, increasing with activation temperature. Surpassing the YP50, the P800 exhibited the highest electrochemical performance with the highest specific capacitance of 154.6 and 91.6 F g−1, approximately 3 times and 1.16 times higher than that of the YP50 in aqueous and organic electrolytes, respectively. These results imply that the high nitrogen content enhances pseudocapacitance and improves electrical conductivity of the P-ACs. These are evidenced by the relatively low series and charge transfer resistances, the capacity retention higher than 88% at the current density of 0.5 A g−1 and the excellent cycling stability, showing a maintenance of 97.6% of its capacitance after 3000 cycles. These results demonstrate that silkworm pupae waste is a potential raw material for the preparation of the nitrogen-enriched AC, which is an alternative electrode material for application in supercapacitor and contributes to the added value of silkworm pupae waste.Contributions
P. K. and M. E. designed and directed the project. V. S., C. C., P. K. and S. K. synthesized the sample. V. S., M. O., M. F. characterized material properties (SEM, BET, XRD, XPS). V. S. T. W., M. P, M. F. measured electrochemical properties. K. T. and W. W. aided interpreting the results. V. S., K. T. and W. W. worked on the manuscript. All authors discussed the results and commented on the manuscript.Conflicts of interest
There are no conflicts to declare.Acknowledgements
This work was partially supported by the development of activated carbon production technology from biomasses for supercapacitor project (P1750165) from the National Nanotechnology Center (NANOTEC), the National Science and Technology Development Agency, Thailand. V. S. acknowledges the financial support from the Exchange Scholarships with the Institution of Foreign Higher Education, King Mongkut's Institute of Technology Ladkrabang (2018). We also thank Mr Bamba Yasuo of Shinshu University for his kind suggestions. We also thank Ms. Pundita Ukkakimapan of College of Nanotechnology, King Mongkut's Institute of Technology Ladkrabang, for her assistance in measurement of electrochemical performance. We thank Mr Visittapong Yordsri, National Metal and Materials Technology Center, for his assistance in TEM characterization. Also, this work was partially supported by the R&D matching funds on the field for knowledge integration and innovation from the Bio-oriented Technology Research Advancement Institution (NARO), Japan.References
- R. Kötz and M. Carlen, Electrochim. Acta, 2000, 45, 2483 CrossRef.
- A. Burke, Electrochim. Acta, 2007, 53, 1083 CrossRef CAS.
- J. R. Miller and P. Simon, Science, 2008, 321, 651 CrossRef CAS PubMed.
- E. Lim, C. Jo and J. Lee, Nanoscale, 2016, 8, 7827 RSC.
- A. M. Abioye and F. N. Ani, J. Renewable Sustainable Energy, 2015, 52, 1282 CrossRef CAS.
- C.-T. Hsieh and H. Teng, Carbon, 2002, 40, 667 CrossRef CAS.
- G. Lota, B. Grzyb, H. Machnikowska, J. Machnikowski and E. Frackowiak, Chem. Phys. Lett., 2005, 404, 53 CrossRef CAS.
- D. Hulicova-Jurcakova, M. Kodama, S. Shiraishi, H. Hatori, Z. H. Zhu and G. Q. Lu, Adv. Funct. Mater., 2009, 19, 1800 CrossRef CAS.
- D. Hulicova-Jurcakova, M. Seredych, G. Q. Lu and T. J. Bandosz, Adv. Funct. Mater., 2009, 19, 438 CrossRef CAS.
- B.-L. Xing, H. Guo, L.-J. Chen, Z.-F. Chen, C.-X. Zhang, G.-X. Huang, W. Xie and J.-L. Yu, Fuel Process. Technol., 2015, 138, 734 CrossRef CAS.
- B. Xing, R. Yuan, C. Zhang, G. Huang, H. Guo, Z. Chen, L. Chen, G. Yi, Y. Zhang and J. Yu, Fuel Process. Technol., 2017, 165, 112 CrossRef CAS.
- B. Xing, H. Zeng, G. Huang, C. Zhang, R. Yuan, Y. Cao, Z. Chen and J. Yu, J. Alloys Compd., 2019, 779, 202 CrossRef CAS.
- B. Li, F. Dai, Q. Xiao, L. Yang, J. Shen, C. Zhang and M. Cai, Energy Environ. Sci., 2016, 9, 102 RSC.
- X. Hong, K. S. Hui, Z. Zeng, K. N. Hui, L. Zhang, M. Mo and M. Li, Electrochim. Acta, 2014, 130, 464 CrossRef CAS.
- J. Hou, C. Cao, F. Idrees and X. Ma, ACS Nano, 2015, 9, 2556 CrossRef CAS PubMed.
- M. Wahid, G. Parte, D. Phase and S. Ogale, J. Mater. Chem. A, 2015, 3, 1208 RSC.
- S.-M. Alatalo, K. Qiu, K. Preuss, A. Marinovic, M. Sevilla, M. Sillanpää, X. Guo and M.-M. Titirici, Carbon, 2016, 96, 622 CrossRef CAS.
- P. Dulyaseree, M. Fujishige, I. Yoshida, Y. Toya, Y. Banba, Y.-s. Tanaka, T. Aoyama, M. Phonyiem, W. Wongwiriyapan, K. Takeuchi and M. Endo, RSC Adv., 2017, 7, 42064 RSC.
- D. Kumar, P. Dev and R. V. Kumar, Food Chem., 2015, 128, 41 Search PubMed.
- K. Tekin, S. Karagöz and S. Bektaş, J. Renewable Sustainable Energy, 2014, 40, 673 CrossRef CAS.
- X.-q. Wei, Q.-h. Li, H.-c. Li, H.-j. Li and S.-x. Chen, New Carbon Mater., 2015, 30, 579 CrossRef.
- M. Thommes, K. Kaneko, A. V. Neimark, J. P. Olivier, F. Rodriguez-Reinoso, J. Rouquerol and K. S. W. Sing, Pure Appl. Chem., 2015, 87, 9 Search PubMed.
- X. Y. Chen, C. Chen, Z. J. Zhang, D. H. Xie, X. Deng and J. W. Liu, J. Power Sources, 2013, 230, 50 CrossRef CAS.
- J. M. Skowroński and M. Osińska, J. Sol-Gel Sci. Technol., 2014, 71, 109 CrossRef.
- R. Wang, T. Zhou, H. Li, H. Wang, H. Feng, J. Goh and S. Ji, J. Power Sources, 2014, 261, 238 CrossRef CAS.
- H. Schmiers, J. Friebel, P. Streubel, R. Hesse and R. Köpsel, Carbon, 1999, 37, 1965 CrossRef CAS.
- X. F. Li, K. Y. Lian, L. Liu, Y. Wu, Q. Qiu, J. Jiang, M. Deng and Y. Luo, Sci. Rep., 2016, 6, 23495 CrossRef CAS PubMed.
- X. Ren, H. Li, J. Chen, L. Wei, A. Modak, H. Yang and Q. Yang, Carbon, 2017, 114, 473 CrossRef CAS.
- S. Biniak, G. Szymański, J. Siedlewski and A. Świątkowski, Carbon, 1997, 35, 1799 CrossRef CAS.
- Y. J. Oh, J. J. Yoo, Y. I. Kim, J. K. Yoon, H. N. Yoon, J.-H. Kim and S. B. Park, Electrochim. Acta, 2014, 116, 118 CrossRef CAS.
- J. Wang, L. Shen, B. Ding, P. Nie, H. Deng, H. Dou and X. Zhang, RSC Adv., 2014, 4, 7538 RSC.
- H. Zhu, X. Wang, F. Yang and X. Yang, Adv. Mater., 2011, 23, 2745 CrossRef CAS PubMed.
- X. Chen, J. Zhang, B. Zhang, S. Dong, X. Guo, X. Mu and B. Fei, Sci. Rep., 2017, 7, 7362 CrossRef PubMed.
- T. Wei, Q. Zhang, X. Wei, Y. Gao and H. Li, Sci. Rep., 2016, 6, 22646 CrossRef CAS PubMed.
- V. Augustyn, J. Come, M. A. Lowe, J. W. Kim, P. L. Taberna, S. H. Tolbert, H. D. Abruna, P. Simon and B. Dunn, Nat. Mater., 2013, 12, 518 CrossRef CAS PubMed.
- D. Liu, C. Fu, N. Zhang, H. Zhou and Y. Kuang, Electrochim. Acta, 2016, 213, 291 CrossRef CAS.
- M. Yang and Z. Zhou, Adv. Sci., 2017, 4, 1600408 CrossRef PubMed.
- F. Zeng, Z. Li, X. Li, J. Wang, Z. Kong, Y. Sun, Z. Liu and H. Feng, Appl. Surf. Sci., 2019, 467, 229 CrossRef.
- F. Reymond, D. Fermín, H. J. Lee and H. H. Girault, Electrochim. Acta, 2000, 45, 2647 CrossRef CAS.
- M. Frank Rose, C. Johnson, T. Owens and B. Stephens, J. Power Sources, 1994, 47, 303 CrossRef.
- T. Devarajan, S. Higashiya, C. Dangler, M. Rane-Fondacaro, J. Snyder and P. Haldar, Electrochem. Commun., 2009, 11, 680 CrossRef CAS.
- C. Zhong, Y. Deng, W. Hu, J. Qiao, L. Zhang and J. Zhang, Chem. Soc. Rev., 2015, 44, 7484 RSC.
- F. Béguin, V. Presser, A. Balducci and E. Frackowiak, Adv. Mater., 2014, 26, 2219 CrossRef PubMed.
- C.-M. Yang, Y.-J. Kim, M. Endo, H. Kanoh, M. Yudasaka, S. Iijima and K. Kaneko, J. Am. Chem. Soc., 2007, 129, 20 CrossRef CAS PubMed.
- J. Chmiola, G. Yushin, Y. Gogotsi, C. Portet, P. Simon and P. L. Taberna, Science, 2006, 313, 1760 CrossRef CAS PubMed.
| This journal is © The Royal Society of Chemistry 2019 |

