 Open Access Article
Effects of hydrogen peroxide co-precipitation and inert N2 atmosphere calcination on CeZrLaNd mixed oxides and the catalytic performance used on Pd supported three-way catalysts
Meisheng Cui *ab,
Yongke Houab,
Zhizhe Zhaia,
Qiang Zhongab,
Yongqi Zhangab and
Xiaowei Huang
 ab
ab
aNational Engineering Research Center for Rare Earth Materials, General Research Institute for Nonferrous Metals, No. 2, Xinjiekou Wai Street, Haidian District, Beijing 100088, PR China. E-mail: cuimsh@sina.com
bGrirem Advanced Materials Co., Ltd., No. 43, Beisanhuan Middle Road, Beijing 100088, PR China
First published on 12th March 2019
Abstract
The unique reversible oxygen storage and release capacity of cerium zirconium mixed oxides makes them ideal washcoat materials of automotive three-way catalysts (TWC). In this work, cerium zirconium mixed oxides of Ce0.15Zr0.79La0.02Nd0.04O2 were prepared via a co-precipitation method. The effects of hydrogen peroxide co-precipitation and inert N2 atmosphere calcination on the structure and properties of cerium zirconium mixed oxides were investigated systematically by Brunauer–Emmett–Teller surface area measurements, X-ray diffraction, scanning electron microscopy, transmission electron microscopy, hydrogen temperature-programmed reduction, oxygen storage capacity (OSC), Raman spectroscopy, and X-ray photoelectron spectroscopy. Additionally, the catalytic performance of palladium supported catalysts was studied. Results show that hydrogen peroxide co-precipitation promotes the dispersion of cerium zirconium particles and enhances crystal grain growth, resulting in good thermal stability of the obtained cerium zirconium mixed oxides. Inert N2 atmosphere calcination also enhances the dispersion of particles, results in smaller and finer crystal grains, enriches pore channels, and significantly improves the surface area, pore volume and OSC, with an OSC of 424.57 μmolO2 g−1, which is a 13.37% increment compared with the common sample. The benefits of hydrogen peroxide co-precipitation and inert N2 atmosphere calcination endow the Pd supported catalysts of cerium zirconium mixed oxides with good three-way catalytic performance.
1. Introduction
Cerium zirconium mixed oxides have unique reversible oxygen storage and release capacity and are therefore a topic of great interest to researchers.1–3 They are widely used in automotive three-way catalysts (TWC) as key washcoat materials.4 Large surface area, good thermal stability and high oxygen storage capacity (OSC) are the key properties of cerium zirconium materials for TWC applications.5 The basic principle is the redox couple of Ce3+/Ce4+ in the CeO2. It has been proven that Zr4+ cations intensively promote the mobility of oxygen ions and enhance the oxygen storage capacity.6,7Previous works have shown that thermal stability can be improved by introducing organic additives.8 OSC can be improved by using mesoporous cerium zirconium mixed oxides with hard template methods.9 Another technique involves the introduction of dopants, such as rare earths,10–12 transition metals,13,14 and alkaline earth metals,15 to stabilize structure, improve OSC, and improve heat resistance. Ce has two valences, but the ion radii of Ce3+ (0.114 nm) and Ce4+ (0.097 nm) differ drastically,16 and the co-precipitation pH values are also different. The ion radii of Ce4+ and Zr4+ (0.084 nm) are somewhat similar, and their co-precipitation pH values are also similar. The solubility product constant (Ksp) of Ce(OH)3 is 1.5 × 10⁻²⁰ and is very different from that of Zr(OH)4, which is 2.0 × 10−48. The solubility product constant (Ksp) of Ce(OH)4 is 4 × 10−51, which is very close to that of the Zr(OH)4.17 Therefore, the valance of Ce ion affects the cerium zirconium mixed oxides. Many studies are currently focused on high-energy mechanical milling,18 template assisted,19 hydrothermal treatment,20 microemulsion,21 and supercritical alcohols,22 for the process of preparing cerium zirconium mixed oxides. However, the calcination process, and even the inert atmosphere calcination have not been extensively studied.
In this study, Ce0.15Zr0.79La0.02Nd0.04O2 cerium zirconium mixed oxides were synthesized by a co-precipitation method. Hydrogen peroxide was introduced to change the Ce ion valence from Ce3+ to Ce4+. Inert N2 atmosphere calcination was carried out to provide an oxygen-deficient atmosphere to alter the precipitate precursors' hydrolysis process. The effects of hydrogen peroxide co-precipitation and inert N2 atmosphere calcination on the structure and properties of CeZrLaNd mixed oxides were investigated systematically by means of Brunauer–Emmett–Teller (BET) surface area measurements, X-ray diffraction (XRD), scanning electron microscopy (SEM), transmission electron microscopy (TEM), hydrogen temperature-programmed reduction (H2-TPR), oxygen storage capacity (OSC), Raman spectroscopy and X-ray photoelectron spectroscopy (XPS). Furthermore, the three-way catalytic performance of palladium supported catalysts was also studied. Hydrogen peroxide co-precipitation promotes particle dispersion, enhances crystal grain growth, and shows good thermal stability. Inert N2 atmosphere calcination results in finer and smaller crystal grains, enriches pore channels, and significantly improves surface area, pore volume and OSC. The benefits of hydrogen peroxide co-precipitation and inert N2 atmosphere calcination endow the Pd supported catalyst of cerium zirconium mixed oxides with good three-way catalytic performance.
2. Experimental
2.1 Materials preparation
Ce0.15Zr0.79La0.02Nd0.04O2 mixed oxides were prepared with a co-precipitation method. The CeCl3, ZrOCl2, LaCl3 and NdCl3 solutions were stirred well at a Ce![[thin space (1/6-em)]](https://www.rsc.org/images/entities/char_2009.gif) :
:![[thin space (1/6-em)]](https://www.rsc.org/images/entities/char_2009.gif) Zr
Zr![[thin space (1/6-em)]](https://www.rsc.org/images/entities/char_2009.gif) :
:![[thin space (1/6-em)]](https://www.rsc.org/images/entities/char_2009.gif) La
La![[thin space (1/6-em)]](https://www.rsc.org/images/entities/char_2009.gif) :
:![[thin space (1/6-em)]](https://www.rsc.org/images/entities/char_2009.gif) Nd molar ratio of 15
Nd molar ratio of 15![[thin space (1/6-em)]](https://www.rsc.org/images/entities/char_2009.gif) :
:![[thin space (1/6-em)]](https://www.rsc.org/images/entities/char_2009.gif) 79
79![[thin space (1/6-em)]](https://www.rsc.org/images/entities/char_2009.gif) :
:![[thin space (1/6-em)]](https://www.rsc.org/images/entities/char_2009.gif) 2
2![[thin space (1/6-em)]](https://www.rsc.org/images/entities/char_2009.gif) :
:![[thin space (1/6-em)]](https://www.rsc.org/images/entities/char_2009.gif) 4. The above metal mixture was precipitated by a 2.5 mol L−1 sodium hydroxide solution. Filtration was followed by deionized water washing, organic additive introduction, and filtration once again. The wet filter cake was then dried at 120 °C for 12 h, then calcined in a muffle furnace at 800 °C for 3 h to prepare a fresh sample, which was labelled as CZLN-f. In a contrasting experiment, during the co-precipitation, hydrogen peroxide (H2O2) was introduced, and its mole ratio to Ce3+ was 0.5. The other steps are the same as the process above. The related fresh sample was labelled as CZLN-H-f. In the third experiment, the dried filter cake (no H2O2 introduction) was firstly calcinated in an inert N2 atmosphere at 800 °C for 3 h, then calcinated in air at 450 °C for 2 h. The obtained fresh sample was labelled as CZLN-N-f. To obtain corresponding aged samples, all fresh samples were calcined at 1000 °C for 4 h to evaluate their thermal stability, and denoted as CZLN-a, CZLN-H-a and CZLN-N-a, respectively.
4. The above metal mixture was precipitated by a 2.5 mol L−1 sodium hydroxide solution. Filtration was followed by deionized water washing, organic additive introduction, and filtration once again. The wet filter cake was then dried at 120 °C for 12 h, then calcined in a muffle furnace at 800 °C for 3 h to prepare a fresh sample, which was labelled as CZLN-f. In a contrasting experiment, during the co-precipitation, hydrogen peroxide (H2O2) was introduced, and its mole ratio to Ce3+ was 0.5. The other steps are the same as the process above. The related fresh sample was labelled as CZLN-H-f. In the third experiment, the dried filter cake (no H2O2 introduction) was firstly calcinated in an inert N2 atmosphere at 800 °C for 3 h, then calcinated in air at 450 °C for 2 h. The obtained fresh sample was labelled as CZLN-N-f. To obtain corresponding aged samples, all fresh samples were calcined at 1000 °C for 4 h to evaluate their thermal stability, and denoted as CZLN-a, CZLN-H-a and CZLN-N-a, respectively.
2.2 Catalyst preparation
0.5 wt% Pd loading catalysts were prepared via an incipient wetness impregnation method. Briefly, the CZLN-f, CZLN-H-f and CZLN-N-f powders were impregnated with a Pd(NO3)2 solution, separately. Then, the wet powders were dried at 105 °C overnight, and calcinated at 500 °C for 2 h to obtain fresh catalysts, denoted as Pd/CZLN-f, Pd/CZLN-H-f and Pd/CZLN-N-f. The fresh catalysts were calcined at 1000 °C for 4 h to prepare the aged samples, and recorded as Pd/CZLN-a, Pd/CZLN-H-a and Pd/CZLN-N-a, respectively. The above catalysts were pressed into tablets, then crushed and sieved to 40–60 mesh pellets before catalytic evaluation.2.3 Powder characterization techniques
N2 adsorption/desorption was used to detect the surface area, pore volume, and pore diameter distribution of the samples at 77 K measured by Quadrasorb SI-KR/4MP (Quantachrome Instruments, USA). Before measurement, samples were degassed in a vacuum at 280 °C for 3 h. XRD spectra were recorded with the Netherlands PANalytical X'Pert PRO MPD using Cu Kα, with a step of 0.02°. The generator voltage was set to 40 kV and current set 40 mA. The morphology of the samples was observed using a Hitachi SEM (Japan). Micro-structures of the samples were further observed by TEM using a Tecnai G2 F20 S-TWIN TEM (FEI Company, USA, 200 kV accelerating voltage). OSC and H2-TPR of samples were measured with a Chembet PULSAR TPR/TPD instrument (USA). The samples were pretreated in 10% H2/Ar at 800 °C for 1 h, and then oxidized at 500 °C by periodically and automatically injecting 289 μL pure O2 gas at an interval of about 5 min to measure OSC. For the H2-TPR testing, the samples were first pretreated at 550 °C for 0.5 h with a gas flow of 5 vol% O2/Ar. Then, pure He gas was switched into the pipeline to sweep the samples for 30 min, and cooled to room temperature. The gas flow of 10% H2/Ar was then switched into the system. The samples were subsequently heated up to 900 °C at a rate of 5 °C min−1. Raman spectra were measured using a Lab Spectrum Raman spectrometer at a laser wavelength of 532 nm (Horiba, Japan). The detecting frequency range was 100–1500 cm−1. The chemical conditions of the surface were analyzed by ESCALAB 250Xi X-ray photoelectron spectroscopy (XPS) under 6.7 × 10⁻⁸ Pa (ThermoFisher Scientific, USA). The working voltage and current were 14 kV and 20 mA, respectively.2.4 Catalytic performance evaluation
The three-way catalytic performance was evaluated in a fixed-bed reactor with a simulated exhaust gas mixture of NO (900 ppm), HC (900 ppm), CO (1.5%), CO2 (12%), O2 (1.2%) and N2 (balance). A 0.6 mL of pellet Pd supported catalyst (40–60 mesh) and 0.3 mL of quartz sand (40–60 mesh) were mixed well and loaded into the fixed-bed quartz reaction tube. The two sides of the quartz tube were plugged with quartz fiber. The GHSV was 50![[thin space (1/6-em)]](https://www.rsc.org/images/entities/char_2009.gif) 000 h−1. The out gases were analyzed by a multi-gas infrared analysis instrument (MKS, USA). The three-way catalytic performance evaluations were carried out at the ideal air/fuel ratio. The temperature of catalyst was increased from room temperature to 450 °C at a rate of 5 °C min−1.
000 h−1. The out gases were analyzed by a multi-gas infrared analysis instrument (MKS, USA). The three-way catalytic performance evaluations were carried out at the ideal air/fuel ratio. The temperature of catalyst was increased from room temperature to 450 °C at a rate of 5 °C min−1.
3. Results and discussion
3.1 BET analysis
As shown in Table 1, compared with the fresh common sample, hydrogen peroxide co-precipitation lowers the fresh surface area and pore volume; however, the inert N2 atmosphere calcination sample presents the largest fresh surface area of 103.67 m2 g−1, with a 35.52% increase. The CZLN-N-f also shows a high pore volume of 0.6250 mL g−1, with an increment of 26.31%. It is revealed that the inert N2 atmosphere enhances the surface area and pore volume. After thermal treatment at 1000 °C for 4 h, all cerium zirconium mixed oxides still have large surface area and pore volume, of which the CZLN-a shows the largest surface area of 46.70 m2 g−1, and CZLN-H-a presents the biggest pore volume of 0.4256 mL g−1. Moreover, the surface area reduction of CZLN-H-a compared with the fresh sample is the lowest at 32.5%, 38.9% for a common sample, and 57.1% for the N2 atmosphere calcination sample. The aged surface area and pore volume of CZLN-N-a are lower than that of CZLN-a. From the above statement, it can be deduced that the hydrogen peroxide co-precipitation improves the high temperature thermal stability of the cerium zirconium mixed oxides. The inert N2 atmosphere greatly improves the fresh surface area and pore volume, however it lowers the thermal stability. During inert N2 calcination, the organic additives changes to solid carbons by carbonization because of the absence of oxygen. The precursor gets to cerium zirconium mixed oxides on the surface or the surroundings of the solid carbons. All these solid carbons are removed by the next low temperature air calcination, leaving behind large pores within the mixed oxides, resulting in a sample with high surface area and large pore volume. However, after 4 h heating treatment at 1000 °C, large parts of pores are collapsed or disappeared, leading to a smaller surface area and pore volume. The thermal stability of hydrogen peroxide co-precipitation sample can be explained by the fact that hydrogen peroxide changed the Ce3+ to Ce4+, and the Ce4+ and Zr4+ co-precipitated at the same time, thereby improving the solubility of the cerium zirconium mixed oxides, leading to a stable structure and good thermal stability.| Sample | Specific surface area (m2 g−1) | Total pore volume (mL g−1) | Average pore size (nm) | BJH pore size (nm) | ΔSBET (%) |
|---|---|---|---|---|---|
| a ΔSBET is calculated by (surface area of fresh sample − surface area of aged sample)/surface area of fresh sample × 100%. | |||||
| CZLN-f | 76.50 | 0.4948 | 25.87 | 30.40 | |
| CZLN-H-f | 64.00 | 0.4340 | 25.25 | 17.15 | |
| CZLN-N-f | 103.67 | 0.6250 | 24.12 | 30.69 | |
| CZLN-a | 46.70 | 0.3173 | 27.18 | 30.48 | 38.9 |
| CZLN-H-a | 43.19 | 0.4256 | 39.41 | 30.71 | 32.5 |
| CZLN-N-a | 44.52 | 0.3089 | 27.75 | 30.05 | 57.1 |
In Fig. 1, the N2 adsorption and desorption curves of all samples show type IV with a type H1 hysteresis hoop, which indicates that mesopores exist in CZLN mixed oxides.23 For fresh samples, the area of the hysteresis loop of CZLN-N-f is the largest. For the aged samples, the area of CZLN-H-a is the largest. It is in accordance with the BET results of pore volume listed in Table 1. It is also further revealed that inert N2 atmosphere calcination has good pore enriched and enlarged effects, leading to large pore volume and high surface area. The hydrogen peroxide co-precipitation is helpful to improve the thermal stability of cerium zirconium mixed oxides. From the inset graph, it can be seen that the pore distribution of the samples have different pore size distribution curves. For CZLN-f and CZLN-N-f samples, the highest points of pore distribution curves are centered at about 30 nm, while for CZLN-H-f, the highest point of pore distribution curve is centered at about 17 nm. After 1000 °C thermal aging treatment, for all the aged samples, the highest points of pore distribution curves are centered at 30 nm. The results are similar to the BJH pore size listed in Table 1.
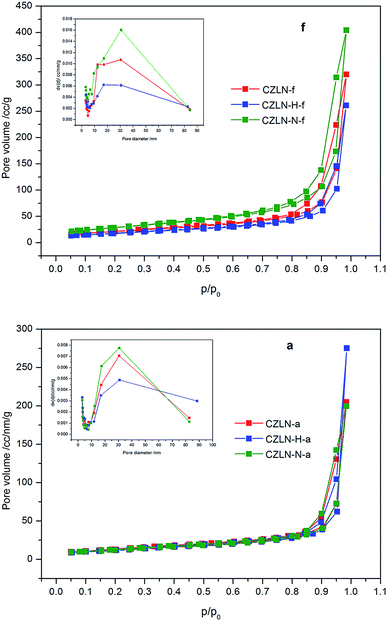 | ||
| Fig. 1 The N2 adsorption and desorption curves of samples (“f” denotes fresh and “a” denotes aged samples). | ||
3.2 XRD analysis
It can be seen from Fig. 2f that all fresh samples show a complete crystal structure with high solid solubility, present a single phase. The phase structure is a tetragonal phase of Ce0.12Zr0.88O2 with a P42/nmc space group (reference code: 01-089-9067). No La and Nd oxides peaks are found in the X-ray diffraction pattern, indicating that the doped La and Nd are highly dispersed in the cerium zirconium lattice, and at the same time cerium oxide and zirconium oxide are combined to form a homogeneous solid solution.24 In addition, CZLN-N-f exhibits the widest diffraction peaks, indicating that the smallest crystal size is 5.7 nm (listed in Table 2). The CZLN-H-f however, has the biggest crystal size of 8.8 nm, which reveals that the hydrogen peroxide co-precipitation improves the crystal growth of cerium zirconium mixed oxides.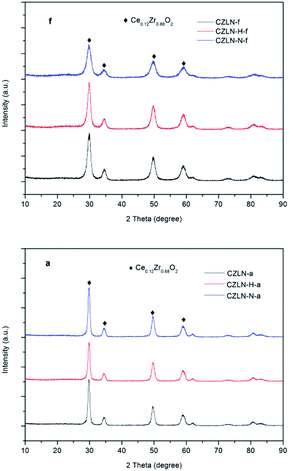 | ||
| Fig. 2 XRD diffraction spectra of samples.“f” denotes fresh and “a” denotes aged samples, respectively. | ||
| Sample | (101) plane | Lattice parameter (Å) | Grain size (nm) | ΔGS (%) | |
|---|---|---|---|---|---|
| 2θ (°) | D (Å) | {101} | |||
| a ΔGS (%): percentage grain growth compared with the fresh state, ΔGS (%) = {GS(aged) − GS(fresh)/GS(fresh)} × 100%. | |||||
| CZLN-f | 29.802 | 2.9955 | 5.1878 | 7.8 | |
| CZLN-H-f | 29.789 | 2.9967 | 5.1907 | 8.8 | |
| CZLN-N-f | 29.769 | 2.9987 | 5.1937 | 5.7 | |
| CZLN-a | 29.763 | 2.9993 | 5.1948 | 14.6 | 87.18 |
| CZLN-H-a | 29.778 | 2.9978 | 5.1924 | 14.8 | 68.18 |
| CZLN-N-a | 29.789 | 2.9967 | 5.1905 | 14.6 | 156.14 |
After thermal aging treatment at 1000 °C for 4 h, the XRD peaks of all samples sharpens and narrows, showing that the size of the crystals increases continuously during the process. The fresh peaks are 6–9 nm, and the aged ones are 15 nm. The increment percentage in the size of the CZLN-H-a grain is the lowest, at 68.18%, compared with CZLN-a (87.18%) and CZLN-N-a (156.14%). This further proves that the hydrogen peroxide co-precipitation causes the formation of the large-sized crystals, thereby increasing its thermal stability of crystal structure. Furthermore, Fig. 2a shows that the crystal phase of the aged samples is the same as that of the fresh ones, with no other phases present. It also shows the tetragonal phase structure of Ce0.12Zr0.88O2.
3.3 H2-TPR and oxygen storage capacity
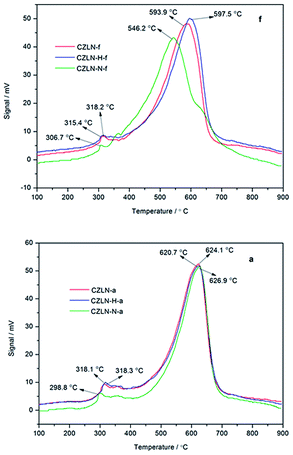
Fig. 3f shows that the H2-TPR reduction curves of fresh cerium zirconium materials are similar and include two reduction peaks. The peak at low temperature corresponds to the reduction of surface and adsorptive oxygen of CeO2, while the peak at high temperature represents the reduction of lattice oxygen of CeO2.25,26 For the fresh samples, CZLN-N-f has the best reduction performance, with the smallest surface oxygen reduction temperature of 306.7 °C and the smallest lattice oxygen reduction temperature of 546.2 °C, mainly due to its pore volume being the largest and its surface area being the most significant. CZLN-H-f has a lower surface oxygen reduction temperature compared with CZLN-f, but the lattice oxygen reduction temperature is a little higher and thus the hydrogen peroxide co-precipitation improves the surface oxygen reduction.As seen in Fig. 3a, after thermal aging at 1000 °C for 4 h, the aged samples show the same type of TPR curves as the fresh ones, with two reduction peaks distributed in low and high temperature regions, corresponding to the reduction of surface, adsorptive oxygen of CeO2 and the reduction of lattice oxygen of CeO2, respectively. The CZLN-N-a has the lowest surface oxygen reduction temperature of 298.8 °C, but its lattice oxygen reduction temperature is the highest. This shows that inert N2 atmosphere calcination enhances the surface oxygen reduction of the aged sample but has no good effect on its lattice oxygen reduction because of the small surface area and particles sintering of the aged inert N2 atmosphere sample. The reduction curves of CZLN-H-a and CZLN-a have some similarities, revealing that hydrogen peroxide co-precipitation has no obvious effect on the oxygen reduction performance in the aged samples.
OSC data are listed in Table 3. The prepared materials all have large oxygen storage capacity of more than 330 μmolO2 g−1 in fresh samples and over 320 μmolO2 g−1 in aged samples. CZLN-N-f has the highest oxygen storage capacity of 424.57 μmolO2 g−1, which is a 13.37% increment compared with the common CZLN-f. This indicates that inert N2 atmosphere calcination causes a significant and high improvement in the OSC of fresh samples because of their high surface area and large pore volume and good oxygen mobility. However, CZLN-H-f has the lowest OSC, 337.29 μmolO2 g−1, which is a 9.94% reduction compared with the CZLN-f. After being aged for 4 h at 1000 °C, CZLN-N-a still has the highest the OSC value, 342.57 μmolO2 g−1, which is an increase of 5.76% compared with CZLN-a. In addition, CZLN-H-a has the lowest reduction in the OSC (4.04%) compared with the related fresh samples, which further revealing that hydrogen peroxide co-precipitation improves the thermal stability, permitting the maintenance of a stable structure.
| Samples | OSC (μmolO2 g–1) | ΔOSC (%) | |
|---|---|---|---|
a ΔOSC (%): increment or reduction of OSC compared with the common sample. ΔOSC (%) = {OSC − OSC(common)/OSC(common)} × 100%,  : OSC reduction of aged sample compared with the fresh state, : OSC reduction of aged sample compared with the fresh state,  = {OSC(fresh) − OSC(aged)/OSC(fresh)} × 100%. = {OSC(fresh) − OSC(aged)/OSC(fresh)} × 100%. |
|||
| CZLN-f | 374.50 | — | |
| CZLN-H-f | 337.29 | −9.94% | |
| CZLN-N-f | 424.57 | 13.37% | |
| CZLN-a | 323.91 | — | 13.51 |
| CZLN-H-a | 323.66 | −0.08% | 4.04 |
| CZLN-N-a | 342.57 | 5.76% | 19.31 |
3.4 SEM and TEM analyses
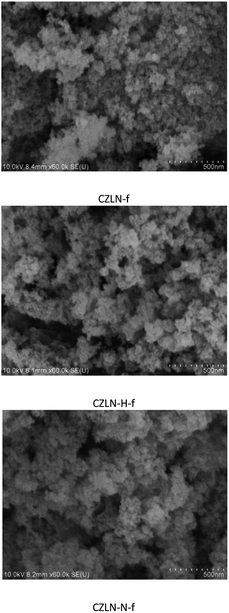
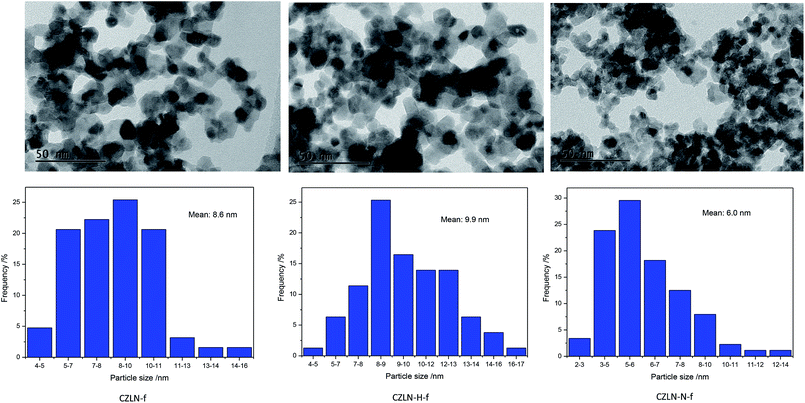
The morphologies of the samples were observed from the SEM images displayed in Fig. 4, which show that the cerium zirconium mixed oxides obtained all have fine sphere-like particles. The CZLN-f sample is more aggregated and the porosity is somewhat smaller. CZLN-H-f and CZLN-N-f both have good particle dispersion, abundant pore channels, and uniform spherical particles. The hydrogen peroxide and inert N2 atmosphere calcination appears to promote the dispersion of cerium zirconium solid solution particles, causing the formation of rich pore channels. Furthermore, the inert N2 calcination sample has the smallest particles, which may further improve its surface area.Fig. 5 shows that cerium zirconium samples all have good dispersion and pore structure. CZLN-N-f has the smallest grain size, the most uniform crystals, and the largest pore size. From particle distribution in Fig. 5, the mean particle size of CZLN-N-f is the smallest at 6.0 nm, and that of CZLN-H-f is the largest at 9.9 nm. These are well in accordance with the XRD results. This clearly reveals that inert N2 atmosphere calcination has good effect in reducing grain size, and enlarging pores, endowing the sample with a large surface area and pore volume.
3.5 Raman spectra
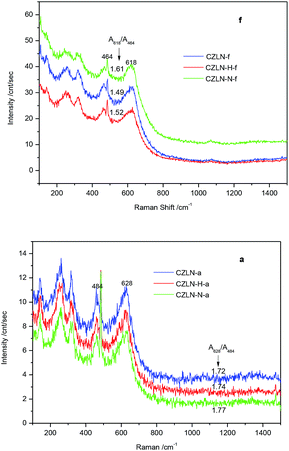
In Fig. 6f, the fresh samples show obvious adsorption peaks at 464 cm−1. These can be attributed to the vibration of F2g, which corresponds to the cubic phase structure. The peak centered at 618 cm−1 corresponds to the non-degenerate LO mode vibration caused by the relaxation of symmetry rules, which is related to lattice defects and oxygen vacancies in the structure of cerium oxide.27 The relative intensities of these vibration peaks are related to oxygen vacancy concentrations in the lattice of the cerium zirconium materials. This oxygen vacancy concentration is defined as the ratio of the vibration peak area at 618 cm−1 and 464 cm−1 (A618/A464). The larger the ratio, the higher the concentration of oxygen vacancies. The A618/A464 value of CZLN-N-f is the highest, at 1.61, and that of CZLN-H-f is somewhat higher than that of CZLN-f. This means that inert N2 atmosphere calcination greatly improves the oxygen vacancies and leads to a high redox performance. Furthermore, hydrogen peroxide co-precipitation has good effect on enhancing the oxygen vacancies of the cerium zirconium mixed oxides. There are also some vibration peaks at 200–400 cm−1; these are attributed mainly to the tetragonal structure of zirconia and the substitution of the cerium oxide lattice to form oxygen vacancies.28In the same way, in Fig. 6a, the aged samples present obvious adsorption peaks at 484 cm−1 and these can be ascribed to the vibration of the F2g mode corresponding to the cubic phase structure. The peak centered at 628 cm−1 corresponds to the non-degenerate LO vibration mode caused by the symmetric relaxation related to lattice defects and oxygen vacancies in the structure of cerium oxide. The oxygen vacancy concentration of the aged samples is defined as the ratio of the vibration peak area at 628 cm−1 and 484 cm−1 (A628/A484). The A628/A484 value of CZLN-N-a, 1.77, is the largest and that of CZLN-f, 1.72, is the smallest. Therefore, both inert N2 atmosphere calcination and hydrogen peroxide co-precipitation improve the oxygen vacancies of the aged samples.
3.6 XPS spectra
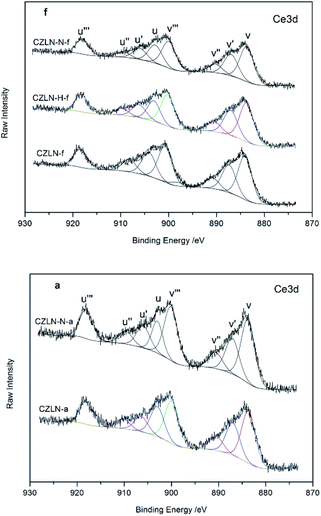
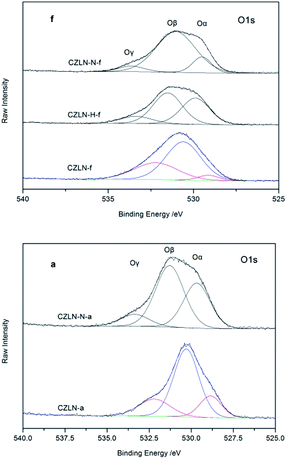
The XPS spectra of samples are shown in Fig. 7 and 8, and can be used to explore the distribution of the elements on the surface of samples. The Ce/Zr molar ratio in the raw materials was designed as 0.19. However, as Table 4 shows, the Ce/Zr ratio of the fresh samples are all less than this value. The increase in Zr concentration on the surface suggests that cerium ions tend to migrate to the bulk phase, of which the Ce/Zr of CZLN-N-f decreases the most. This reveals that inert N2 atmosphere calcination promotes cerium migration into the inner bulk. For the aged samples, the Ce/Zr is higher than that of the related fresh samples, revealing that the cerium ions tend to migrate back to the surfaces of the samples during the thermal treatment.| Samples | Ce/Zr | Ce3+/(Ce3+ + Ce4+) | Oβ/(Oα + Oβ + Oγ) |
|---|---|---|---|
| a The theoretical designed molar ratio of Ce/Zr in raw materials is 0.19. “f”: fresh sample; “a”: aged sample. | |||
| CZLN-f | 0.1175 | 29.39 | 0.6107 |
| CZLN-H-f | 0.1242 | 23.76 | 0.4817 |
| CZLN-N-f | 0.1118 | 23.21 | 0.7828 |
| CZLN-a | 0.1298 | 21.76 | 0.6062 |
| CZLN-N-a | 0.1243 | 22.19 | 0.5322 |
The oxidation states of Ce were analyzed by peak fitting the curves of the Ce 3d spectra. As shown in Fig. 7, these curves are composed of eight peaks corresponding to four pairs of spin–orbit doublets. The peaks labelled “u” and “v” represent the spin-orbits of Ce 3d3/2 and Ce 3d5/2, respectively. The peaks marked v′ and u′ represent the initial electron state 3d104f1, which corresponds to Ce3+. The proportion of Ce3+ species (v′, u′) in terms of the total cerium species can be obtained from the ratio of the sum of the area of Ce3+ species to the sum of the area of the total cerium species.29,30 Table 4 shows that CZLN-f has the highest surface Ce3+ ratio. After the thermal treatment, the value of Ce3+/(Ce3+ + Ce4+) is somewhat lower than that of the related fresh sample, which is attributed to the reduction in the surface of Ce3+ caused by the oxidation of Ce3+ to Ce4+.
O 1s XPS spectra are always used to distinguish the state of surface oxygen species. The O 1s spectra of all samples are fitted into three peaks. Three oxygen species can be identified, as shown in Fig. 8. Peak α can be attributed to lattice oxygen O22−, peak β to surface adsorbed oxygen O2−, O−, OH− or oxygen vacancies, and peak γ likely to adsorbed molecular water.31–33 Surface oxygen species have a relatively high reactivity owing to their high mobility. As shown in Table 4, CZLN-N-f has the biggest value of Oβ/(Oα + Oβ + Oγ), one that is much higher than that of CZLN-f and CZLN-H-f. This indicates that inert N2 atmosphere calcination greatly improves the surface oxygen species and the redox performance due to the great surface area and small particle size of CZLN-N-f. After thermal treatment, the Oβ/(Oα + Oβ + Oγ) value of CZLN-N-a is reduced to less than that of CZLN-f because of the large reduction in surface area and pore volume and large increase in grain size of the aged sample.
3.7 Catalytic performance
The three-way catalytic performance of the fresh and aged palladium supported catalysts were evaluated at the idea air/fuel ratio. T50 represents the light-off temperatures of the catalyst, defined as the corresponding catalyst temperature when the conversion reaches 50% for CO, C3H8, and NO, respectively. T90 represents the total conversion temperature of the catalyst, defined as the corresponding catalyst temperature when the conversion up to 90% for CO, C3H8, and NO, respectively. As Fig. 9 and Table 5 show, Pd/CZLN-N-f has the best CO catalytic conversion, with the lowest light-off temperature T50-CO of 218 °C (a reduction by 13 °C compared with the common fresh sample Pd/CZLN-f) and the lowest full conversion temperature T90-CO of 231 °C (a reduction by 8 °C compared with the common fresh sample Pd/CZLN-f). This reveals that inert N2 atmosphere calcination promotes CO conversion greatly because of its large surface area, high OSC, and good redox properties. However, CZLN-H-f has the best catalytic performance for C3H8, with the lowest light-off temperature T50-C3H8 of 302 °C (a reduction by 13 °C compared with the common fresh sample Pd/CZLN-f) and the lowest full conversion temperature T90-C3H8 of 342 °C (a reduction by 20 °C compared with the common fresh sample Pd/CZLN-f). CZLN-H-f also has the best catalytic performance for NO conversion, with the lowest T50-NO and T90-NO, being reduced by more than 33 °C and by 14 °C, respectively, compared with the common fresh sample Pd/CZLN-f. This reveals that hydrogen peroxide co-precipitation enhances the catalytic conversion of C3H8 and NO of the fresh samples. It is shown that there are some oscillations in the conversion curves at 200–300 °C for NO conversion; these are perhaps mainly caused by the weaker NO reduction capacity of Pd compared with that of Rh.34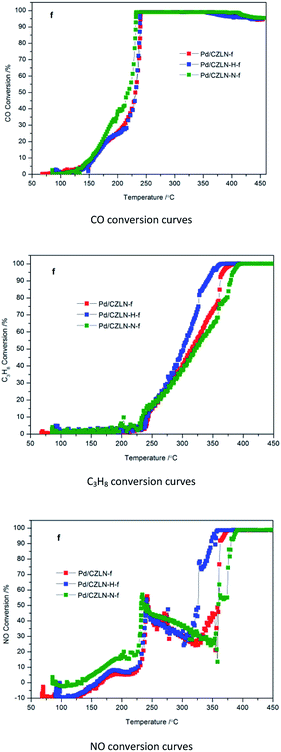 | ||
| Fig. 9 Three-way catalytic performance of fresh Pd supported catalysts. “f” is denoted as fresh samples. | ||
| Samples | T50 (°C) | T90 (°C) | ||||
|---|---|---|---|---|---|---|
| CO | C3H8 | NO | CO | C3H8 | NO | |
| a T50 stands for light-off temperature, defined as the temperature at conversion of 50%. T90 stands for total conversion temperature, defined as the temperature at conversion of 90%. | ||||||
| Pd/CZLN-f | 231 | 315 | 240, 360 | 239 | 362 | 362 |
| Pd/CZLN-H-f | 232 | 302 | 239, 327 | 239 | 342 | 348 |
| Pd/CZLN-N-f | 218 | 321 | 232, 359 | 231 | 378 | 381 |
Fig. 10 and Table 6 show that for palladium supported catalysts thermally aged at 1000 °C, Pd/CZLN-N-a has the best three-way catalytic conversion, with the lowest light-off temperature T50-CO of 243 °C, T50-C3H8 of 389 °C, T50-NO of 389 °C; which are reductions by 14 °C, 17 °C, and 53 °C, respectively, compared with the common aged Pd/CZLN-a. Additionally, Pd/CZLN-N-a has the lowest full conversion temperature T90-CO of 247 °C, T90-C3H8 of 391 °C, and T90-NO of 391 °C, respectively; these are reductions by 12 °C for CO and by 63 °C for C3H8, compared with the common aged Pd/CZLN-a. This reveals that inert N2 atmosphere calcination promotes the three-way catalytic performance of the thermally aged catalysts, mainly due to its great oxygen storage capacity, redox performance and abundant oxygen vacancies even after being thermally aged at 1000 °C.
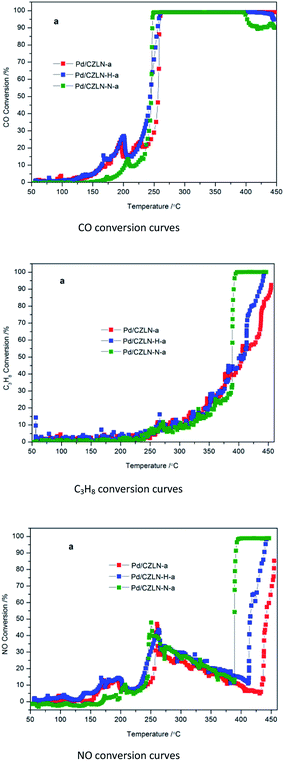 | ||
| Fig. 10 Three-way catalytic performance of aged Pd-supported catalysts. “a” is denoted as aged samples. | ||
| Samples | T50 (°C) | T90 (°C) | ||||
|---|---|---|---|---|---|---|
| CO | C3H8 | NO | CO | C3H8 | NO | |
| Pd/CZLN-a | 257 | 406 | 442 | 259 | 454 | — |
| Pd/CZLN-H-a | 244 | 402 | 415 | 256 | 436 | 438 |
| Pd/CZLN-N-a | 243 | 389 | 389 | 247 | 391 | 391 |
4. Conclusions
In this study, Ce0.15Zr0.79La0.02Nd0.04O2 cerium zirconium mixed oxides with high surface areas and pore volumes were prepared using a co-precipitation method. Hydrogen peroxide co-precipitation and inert N2 atmosphere calcination have great influence on the structure and properties of cerium zirconium materials. The former promotes the dispersion of cerium zirconium particles and enhances growth of the crystal grain, causing the obtained cerium zirconium mixed oxides to have a good thermal stability. The surface area of a sample aged at 1000 °C for 4 h is 43.19 m2 g−1, and it has the lowest reduction in surface area (32.5%) compared with the fresh sample. Inert N2 atmosphere calcination also enhances the dispersion of particles, moreover making the crystal grains fine and small, and enriching pore channels, leading to significantly large surface areas and pore volumes. In addition, it greatly improves the redox performance and oxygen storage capacity of the material, with OSC of 424.57 μmolO2 g−1 (a 13.37% increase compared with the common CZLN-f) caused by abundant oxygen vacancies, much surface and bulk oxygen species. For fresh Pd supported catalysts, Pd/CZLN-H-f has the best catalytic performance for C3H8 and NO conversion, reducing T50-C3H8 by 13 °C and T50-NO by 33 °C compared with the common fresh sample Pd/CZLN-f. Pd/CZLN-N-f has the best CO catalytic conversion, reducing T50-CO by 13 °C and T90-CO by 8 °C compared with the common fresh sample Pd/CZLN-f. For the Pd-supported catalysts thermally aged at 1000 °C, inert N2 atmosphere calcination clearly and significantly enhances three-way catalytic performance. Pd/CZLN-N-a is the best catalyst, with a T50-CO reduction by 14 °C, a T50-C3H8 reduction by 17 °C, and a T50-NO reduction by 53 °C, compared with the common aged sample CZLN-a. This is mainly due to its great oxygen storage capacity and abundant oxygen vacancies, even after thermally aged at 1000 °C.Conflicts of interest
There are no conflicts of interest to declare.Acknowledgements
This work is financially supported by the China National Key Research and Development Program (No. 2017YFC0211002).References
- Y. Zhou, L. Lan, M. Gong and Y. Chen, J. Mater. Sci., 2016, 51(9), 4283–4295 CrossRef CAS.
- M. Ozawa, M. Kimura and A. Isogai, J. Alloys Compd., 1993, 193, 73–75 CrossRef CAS.
- M. Ozawa, T. Okouchi and M. Haneda, Catal. Today, 2015, 242, 329–337 CrossRef CAS.
- M. Sugiura, M. Ozawa, A. Suda, T. Suzuki and T. Kanazawa, Bull. Chem. Soc. Jpn., 2005, 78(5), 752–767 CrossRef CAS.
- E. A. Trusova, A. A. Khrushcheva and K. V. Vokhmintcev, J. Eur. Ceram. Soc., 2012, 32, 1977–1981 CrossRef CAS.
- T. Masui, T. Ozaki, K. Machida and G. Adachi, J. Alloys Compd., 2000, 303–304, 49–55 CrossRef CAS.
- D. Devaiah, L. H. Reddy, S. E. Park and B. M. Reddy, Catal. Rev., 2018, 60(2), 177–277 CrossRef CAS.
- Y. Zhou, L. Lan, M. Gong and Y. Chen, J. Mater. Sci., 2016, 51(9), 4283–4295 CrossRef CAS.
- S. Abdollahzadeh-Ghom, C. Zamani, T. Andreu, M. Epifani and J. R. Morante, Appl. Catal., B, 2011, 108–109, 32–38 CrossRef CAS.
- J. Fan, X. Wu, X. Wu, Q. Liang, R. Ran and D. Weng, Appl. Catal., B, 2008, 81(1–2), 38–48 CrossRef CAS.
- P. Dulgheru and J. A. Sullivan, Rare earth (La, Nd, Pr) doped ceria zirconia solid solutions for soot combustion, Top. Catal., 2013, 56(1–8), 504–510 CrossRef CAS.
- E. Aneggi, C. Leitenburg, G. Dolcetti and A. Trovarelli, Catal. Today, 2006, 114, 40–47 CrossRef CAS.
- J. C. Vargas, S. Ivanova, S. Thomas, A. C. Roger and V. Pitchon, Catalysts, 2012, 2, 121–138 CrossRef CAS.
- G. F. Li, Q. Wang, B. Zhao and R. Zhou, Appl. Catal., B, 2011, 105, 151–162 CrossRef CAS.
- I. Y. Kaplin, E. S. Lokteva, E. V. Golubina, K. I. Maslakov, S. A. Chernyak and V. V. Lunin, Kinet. Catal., 2017, 58(5), 598–605 CrossRef.
- J. Lian, L. M. Wang, R. G. Haire, K. B. Helean and R. C. Ewing, Nucl. Instrum. Methods Phys. Res., Sect. B, 2004, 218, 236–243 CrossRef CAS.
- Y. Guo, G. Lu, Z. Zhang, S. Zhang, Y. Qi and Y. Liu, Catal. Today, 2007, 126, 296–302 CrossRef CAS.
- A. Trovarelli, F. Zamar, J. Llorca, C. Leitenburg, G. Dolcetti and J. T. Kissz, J. Catal., 1997, 169, 490–502 CrossRef CAS.
- T. Tsoncheva, R. Ivanova, J. Henych, M. Dimitrov, M. Kormunda, D. Kovacheva, N. Scotti, V. D. Santo and V. Stengl, Appl. Catal., A, 2015, 502, 418–432 CrossRef CAS.
- R. N. Ivanova, M. D. Dimitrov, D. G. Kovacheva and T. S. Tsoncheva, Bulg. Chem. Commun., 2017, 49(A), 84–90 Search PubMed.
- A. Hadi, K. N. Ismail and M. N. A. Shah, Procedia Soc. Behav. Sci., 2015, 195, 2051–2060 CrossRef.
- E. K. C. Pradeep, T. Habu, H. Tooriyama, M. Ohtani and K. Kobiro, J. Supercrit. Fluids, 2015, 97, 217–223 CrossRef CAS.
- M. López Granados, A. Gurbani, R. Mariscal and J. L. G. Fierro, J. Catal., 2008, 256(2), 172–182 CrossRef.
- B. M. Reddy, L. Katta and G. Thrimurthulu, Chem. Mater., 2010, 22(2), 467–475 CrossRef CAS.
- G. H. Noelia, B. L. Agustín and G. G. Avelina, J. Mater. Sci., 2012, 47(7), 3204–3213 CrossRef.
- D. Devaiah, T. Tsuzuki, T. Boningari, P. G. smirniotis and B. M. Reddy, RSC Adv., 2015, 5, 30275–30285 RSC.
- X. Lin, L. Li, G. Li and W. Su, Mater. Chem. Phys., 2001, 69(1–3), 236–240 CrossRef CAS.
- P. Fornasiero, A. Speghini, R. D. Monte, M. Bettinelli, J. Kašpar, A. Bigotto, V. Sergo and M. Graziani, Chem. Mater., 2004, 16(10), 1938–1944 CrossRef CAS.
- A. E. Nelson and K. H. Schulz, Appl. Surf. Sci., 2003, 210(3–4), 206–221 CrossRef CAS.
- C. Bozo, N. Guilhaume and J. M. Herrmann, J. Catal., 2001, 203(2), 393–406 CrossRef CAS.
- H. He, H. Dai and C. T. Au, Catal. Today, 2004, 90(3–4), 245–254 CrossRef CAS.
- K. Jirátová, J. Mikulová, J. Klempa, T. Grygar, Z. Bastl and F. Kovanda, Appl. Catal., A, 2009, 361(1–2), 106–116 CrossRef.
- T. Vinodkumar, D. Mukherjee, C. Subrahmanyam and B. M. Reddy, New J. Chem., 2018, 42(7), 5276–5283 RSC.
- I. Heo, D. Y. Yoon, B. K. Cho, I. S. Nam, J. W. Choung and S. Yoo, Appl. Catal., B, 2012, 121–122, 75–87 CrossRef CAS.
| This journal is © The Royal Society of Chemistry 2019 |

