
 Open Access Article
 This Open Access Article is licensed under a Creative Commons Attribution-Non Commercial 3.0 Unported Licence
Biocompatible carbon-doped MoSe2 nanoparticles as a highly efficient targeted agent for human renal cell carcinoma
Li Gaoa,
Yi-zeng Fanb,
Tao-hong Zhanga,
Hui-qiu Xua,
Xian-ling Zenga,
Tao Houb,
Wei-chao Danb,
Jin Zeng*b and
Rui-fang An *a
*a
aDepartment of Gynaecology and Obstetrics, The First Affiliated Hospital of Xi'an Jiaotong University, Health Science Center, Xi'an Jiaotong University, Xi'an, Shaanxi 710061, P. R. China. E-mail: anrfxjtu@163.com
bDepartment of Urology, The First Affiliated Hospital of Xi'an Jiaotong University, Health Science Center, Xi'an Jiaotong University, Xi'an, Shaanxi 710061, P. R. China. E-mail: zengjin1984@gmail.com
First published on 12th April 2019
Abstract
MoSe2 is a typical transition-metal dichalcogenide material, and many researches have been focused on using its property of near infrared strong absorption for laser mediated photothermal cancer treatment. However, the anti-canter effect of MoSe2 and its possible mechanism in renal cell carcinoma (RCC) is still unclear. RCC has high incidence of metastasis, which is known as one of the most lethal malignancies in the urological system. This study revealed that the carbon-doped MoSe2 particles can obviously inhibit proliferation for 786-O and ACHN cells. Meanwhile, the carbon-doped MoSe2 nanoparticles have little impact on the viability of KH-2 cells in vitro. The mechanism analysis revealed that the carbon-doped MoSe2 particles have hydrogen bond effect in aqueous solution, and the particle aggregation effect caused the KH-2 cells to have high viability. The carbon-doped MoSe2 nanoparticles with minimal toxicity may be a potential therapeutic candidate against RCC.
1 Introduction
Cancer is a serious threat to human health, and late discovery makes it difficult to cure. So far, early diagnosis is still a major bottleneck to discovering early cancer, and advanced cancer still lacks effective treatment.1,2 Cancer is easy to cure in the early stage, which is an effective way to improve the cure rate and reduce the mortality of cancer. With the development of modern medicine, researchers have a deeper understanding of the worldwide problem of cancer, and surgery, radiotherapy, chemotherapy and other clinical treatment methods exist. However, all the previously described treatments have certain risks, including killing normal cells, accelerating the metabolism of tumor cells and destroying the immune system. Therefore, it is necessary to find a more effective medicine to improve the cure rate of cancer.As the third most common urologic malignancy, renal cell carcinoma (RCC) accounts for approximately 3% of all cancers, and 90% of the kidney cancer patients are adults.3 After treating with advanced diagnostic methods and systemic treatment such as chemotherapy and radiotherapy, patients will have a remarkable improvement in 5 year survival and recurrence-free survival. Despite that, 30% of the kidney cancer patients continue to progress into the metastatic disease, as a result the median overall survival of metastatic RCC of only 12 months.4 Furthermore, metastatic RCC is insensitive to chemotherapy, and drugs for immunotherapy and targeted therapy have a low effect.5 Although targeted drug therapy for RCC has been improved, the response rates of targeted drugs in metastatic RCC remain poor, and the resistance to chemotherapy is a primary obstacle in RCC treatment.6,7 Thus, it is urgent to explore novel therapeutic agents against RCC.
Now, two-dimensional (2D) layered transition metal dichalcogenides (TMDCs) have drawn great attention as agents for photothermal therapy due to their novel electronic and optical properties.8–10 The exfoliated TMDCs (MoS2, WS2 and WSe2) have lower cytotoxicity than classic 2D materials such as graphene and its analogues.11 The selenium and molybdenum elements are the necessary trace elements to human body, and the toxicity of MoSe2 is relatively lower than other two-dimensional transition metal dichalcogenide materials.12 MoSe2 is a typical two-dimensional transition metal dichalcogenides material and has always been used in the field of optoelectronics. Furthermore, because of its strong absorption in the near infrared region, MoSe2 nano materials have been used as photothermal agents for cancer treatment: Zhong et al. prepared biocompatible MoSe2 nanoparticles for efficient targeted photothermal therapy of human lung cancer;13 Chen et al. prepared green nanosheets as a highly efficient phototheranostic agent for photoacoustic imaging guided photothermal cancer therapy;14 Pan et al. used Gd3+ doped MoSe2 nanosheets as a theranostic agent for bimodal imaging and highly efficient photothermal cancer therapy.12
As an inorganic material, normal MoSe2 has poor suspension property in water condition, and it has poor biocompatibility in tumor therapy. Ultrasonic was used to further process and modify MoSe2, and the prepared MoSe2 materials have good biocompatibility.15–17 Therefore, it is urgent to find more facile processing strategies for MoSe2 nano materials formation with excellent biocompatibility and multifunctionality. In this study, ethanol was adopted in the MoSe2 preparation, and the ultrasonic was used to disperse the MoSe2 particles in mixture solution (isopropyl alcohol/distilled water). As a result, the prepared MoSe2 particles contained carbon elements (49.82 wt%) with good biocompatibility. The carbon-doped MoSe2 nanoparticles have very low toxicity to KH-2 cells, but they can obviously reduce the viability of 786-O and ACHN cells. Despite its potential of anti-proliferation effect, but the carbon-doped MoSe2 nanoparticles reduced the viability of RCC had not been elucidated clearly. Hence, it is very meaningful to explore the antitumor effect of carbon-doped MoSe2 nanoparticles on RCC cell lines and to investigate its possible mechanisms.
2 Materials and methods
2.1 Materials
Selenium (Se) powder was from Beilian Fine Chemicals Development Co., Ltd (Shanghai, China). Sodium molybdate dihydrate (Na2MoO4·2H2O) was bought from Chemical Reagent Plant Four (Tianjing, China). Hydrazine hydrate 80% (N2H4·H2O) was purchased from Fuyu Fine Chemical Co., Ltd (Tianjing, China). All the materials used in the research were analytic reagent grade (AR).2.2 Cell culture
Human kidney HK-2 cells and human RCC cell lines 786-O and ACHN were obtained from ATCC, and maintained in RPMI-1640 medium (Gibco, USA), containing 10% fetal bovine serum (FBS, Gibco, USA) and 100 U mL−1 penicillin and 0.1 mg mL−1 streptomycin (Gibco, USA). The cells were cultured at 37 °C with 5% CO2 in a humidified atmosphere. The HK-2 cells were immortalized by transduction with human papilloma virus 16 (HPV-16) E6/E7 genes. The cell experiments were carried out in the department of urology, the first affiliated hospital of Xi'an Jiaotong University.2.3 Preparation
The preparation of MoSe2 nanoparticles: 0.765 g of Na2MoO4·2H2O and 0.5 g of Se powder were dissolved in 40 mL distilled water. Then 20 mL of ethanol and 10 mL of N2H4·H2O were added into the mixture. After stirring for 30 min, the mixture was transferred to a 100 mL Teflon-lined stainless autoclave, which was sealed tightly and maintained at 200 °C for 12 h. Then the reactant was cooled to room temperature naturally. The suspension was centrifuged and washed with distilled water and ethanol for several times. Finally, the product dried at 60 °C to obtain black MoSe2 powder.Dispersion method: 50 mL of isopropyl alcohol and 50 mL of distilled water were added in a beaker, and then the MoSe2 powder was added into the isopropyl alcohol/distilled water mixture solution. Then the MoSe2 nanoparticles were obtained with ultrasonic dispersion method, and the ultrasonic time was 4 h.
2.4 Characterization
Fourier transform infrared (FT-IR) was carried out between 400 and 4000 cm−1 using a Bruker spectrophotometer (VERTEX70, Bruker, Germany). The carbon-doped MoSe2 particles were investigated by X-ray photoelectron spectroscopy (XPS) analysis (Thermo Fisher ESCALAB Xi+, USA). X-ray diffraction (XRD) characterization was used to investigate the crystal phase structure patterns (D8 advance, Bruker, Germany). Scanning electron microscopy (SEM) was used to observe the MoSe2 (SU3500, Techcomp, China). Energy dispersive spectrometer (EDS) was used to do the EDS elemental maps of the MoSe2 on silicon wafer (OXFORD instruments, UK). Transmission electron microscope (TEM) (H-7650, HITACHI, Japan) was used to observe the MoSe2. The particle size and distribution were determined by laser particle size distribution analyzer (ZSE, Malvern, UK). Thermo gravimetric analysis (TG) and differential scanning calorimetry (DSC) analyses were under an oxygen atmosphere from 30 to 1000 °C (STA449F5, NETZSCH, Germany).2.5 BSA conjugation
Bovine serum albumin (BSA) can be used to bond with MoSe2. The BSA should be dissolved in phosphate-buffered saline [PBS: 150 mM NaCl, 1.9 mM NaH2PO4, 8.1 mM Na2HPO4, pH of 7.4] at a volume fraction of 1%. Then 1 mL of volume fraction of 1% BSA was added to 10 mL of MoSe2 solution (6 μg mL−1) with gentle rocking for 12 h at room temperature. Subsequently, the response was ended by centrifugation at 10![[thin space (1/6-em)]](https://www.rsc.org/images/entities/char_2009.gif) 000 rpm for 5 min to remove redundant BSA. Afterwards, the sediment was re-suspended by deionized water.
000 rpm for 5 min to remove redundant BSA. Afterwards, the sediment was re-suspended by deionized water.
2.6 Fluorescence microscopy
Fluorescein isothiocyanate (FITC) was used to mark the BSA-coated MoSe2 with green fluorescence. Briefly, FITC DMSO solution was added to BSA-coated MoSe2 and the mixture was stirred for 4 h in darkness. Then the FITC-marked MoSe2 was separated by centrifugation at 10000 rpm for 5 min and washed three times with ice-cold PBS to remove the additional FITC. The 786-O, ACHN and HK-2 cells were seeded on slides and cultured for 24 h. Subsequently, the medium was removed and then the FITC-coated BSA-labeled MoSe2 was added and the cells were incubated for another 4 h. After removing the medium, the cells were washed by cold PBS twice and cultured with 40, 6-diamidino-2-phenylindole (DAPI) dyed for 5 min at a concentration of 0.1 mg mL−1. The cells were measured by fluorescence microscope.
2.7 Flow cytometry assay
The renal carcinoma 786-O cells were treated by MoSe2 at a concentration of 4 μg mL−1 and 6 μg mL−1 for 24 h. After being washed by PBS, the cells were gathered and dyed with FITC-conjugated Annexin V and propidium iodide (PI) by following the manufacturer's protocol. Afterwards, the apoptotic cells were analyzed according to flow cytometry (BD FACS can flow cytometer, BD Biosciences).2.8 MTT method
The 786-O, ACHN and HK-2 (5 × 10³ cells per well) were seeded onto 96-well plates and disposed with MoSe2 (in the concentration of 0, 1 μg mL−1, 2 μg mL−1, 4 μg mL−1, 6 μg mL−1, 8 μg mL−1, 10 μg mL−1) for 24 h. After treatment, 20 μL MTT (3-(4,5-dimethyl-2-thiazolyl)-2,5-diphenyl-2H-tetrazolium bromide) was added to each well with 180 μL medium and incubated at 37 °C for 4 h. Then, dimethyl sulfoxide (DMSO) was added to dissolve the formazan crystals. The optical density of each well was examined at a wavelength of 490 nm according to a 96-well microplate reader (Bio-Rad, Hercules, CA, USA).3 Results and discussion
3.1 SEM, TEM, number distribution and EDS analyses
Fig. 1 shows the morphology and physicochemical properties of the carbon-doped MoSe2 nanoparticles. Fig. 1a shows the large scale morphologies of the synthesized MoSe2 nanoparticles with SEM, and the high magnification SEM of carbon-doped MoSe2 in Fig. 1b shows flower type. The TEM image of the Fig. 1c shows the large area of MoSe2 nanoparticles. From the TEM images in Fig. 1d, it can be seen that the MoSe2 is layer structure and shows flower morphology with a size of about 200 nm. According to the high magnification TEM of carbon-doped MoSe2 in Fig. 1e, the lattice space of MoSe2 is obviously. In addition, an interlayer distance of nearly 0.64 nm was examined, which matched the thickness of the single layer of Se–Mo–Se unit and the corresponding (002) plane.18 It proved that the carbon-doped MoSe2 had high crystallinity and extremely thin 2D flake structure with lattice space. Fig. 1f shows the number distribution of the MoSe2 nanoparticles, and some of these particles are under 100 nm.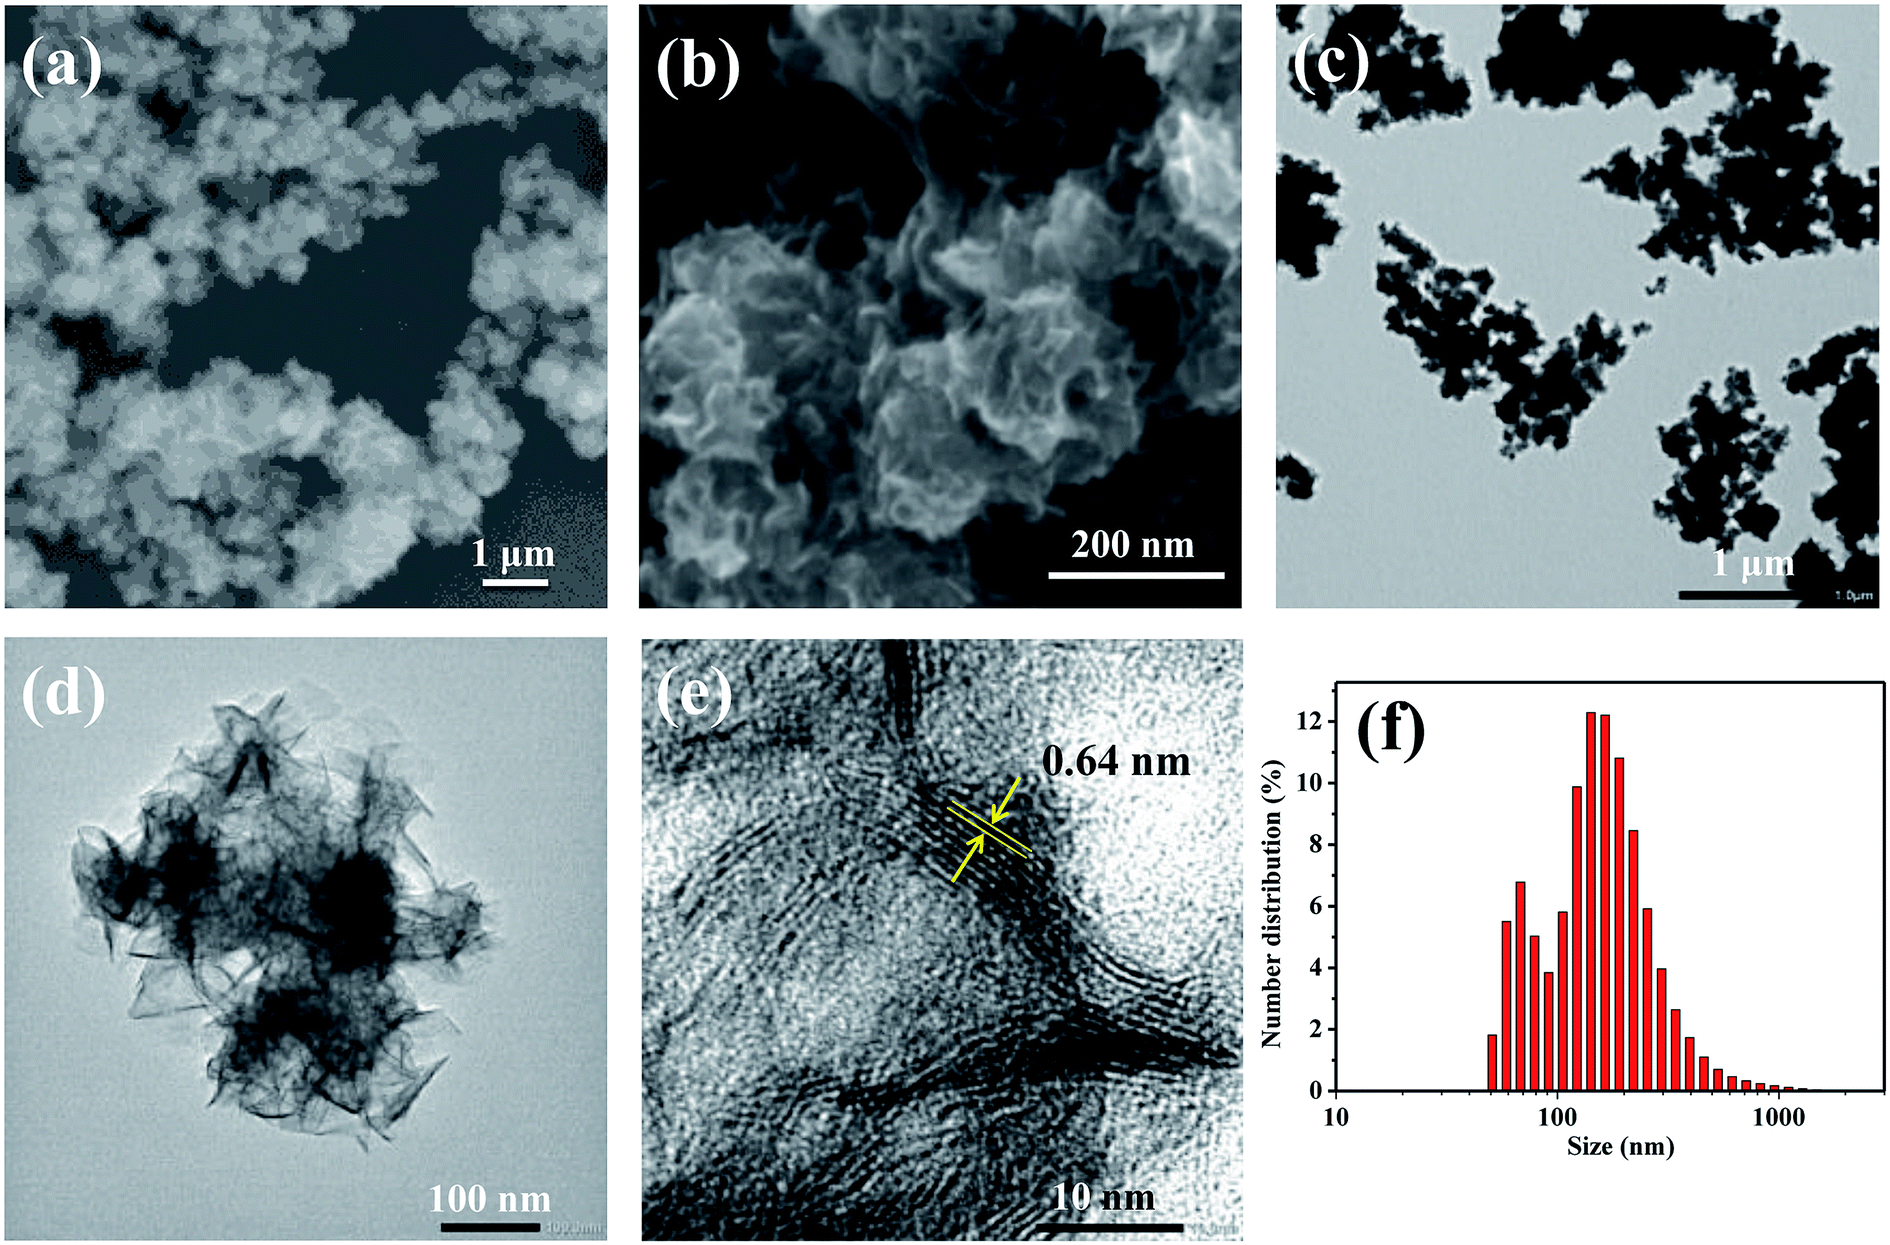 | ||
| Fig. 1 (a and b) SEM images, (c–e) TEM images and (f) number distribution of carbon-doped MoSe2. | ||
Fig. 2 shows the SEM image and EDS elemental maps of the MoSe2 on silicon wafer. The EDS spectra detected Se, C, Mo, O and N elements, and the EDS elemental maps as Fig. 2b–e shown. Furthermore, the Fig. 2f shows the MoSe2 contained C (49.82 wt%), Se (36.60 wt%), Mo (9.86 wt%), O (3.37 wt%) and N (0.36 wt%), and C element is the most abundant element in MoSe2. The ethanol in the preparation processes with C element which caused the prepared MoSe2 to contain C element. Moreover, the EDS analysis result shows that the weight ratios of Se and Mo are 36.60% and 9.86%. According to calculation, the atomic percent ratio of Se to Mo was 4.51:1, which further showed that the obtained product may consist of Se and MoSe2.
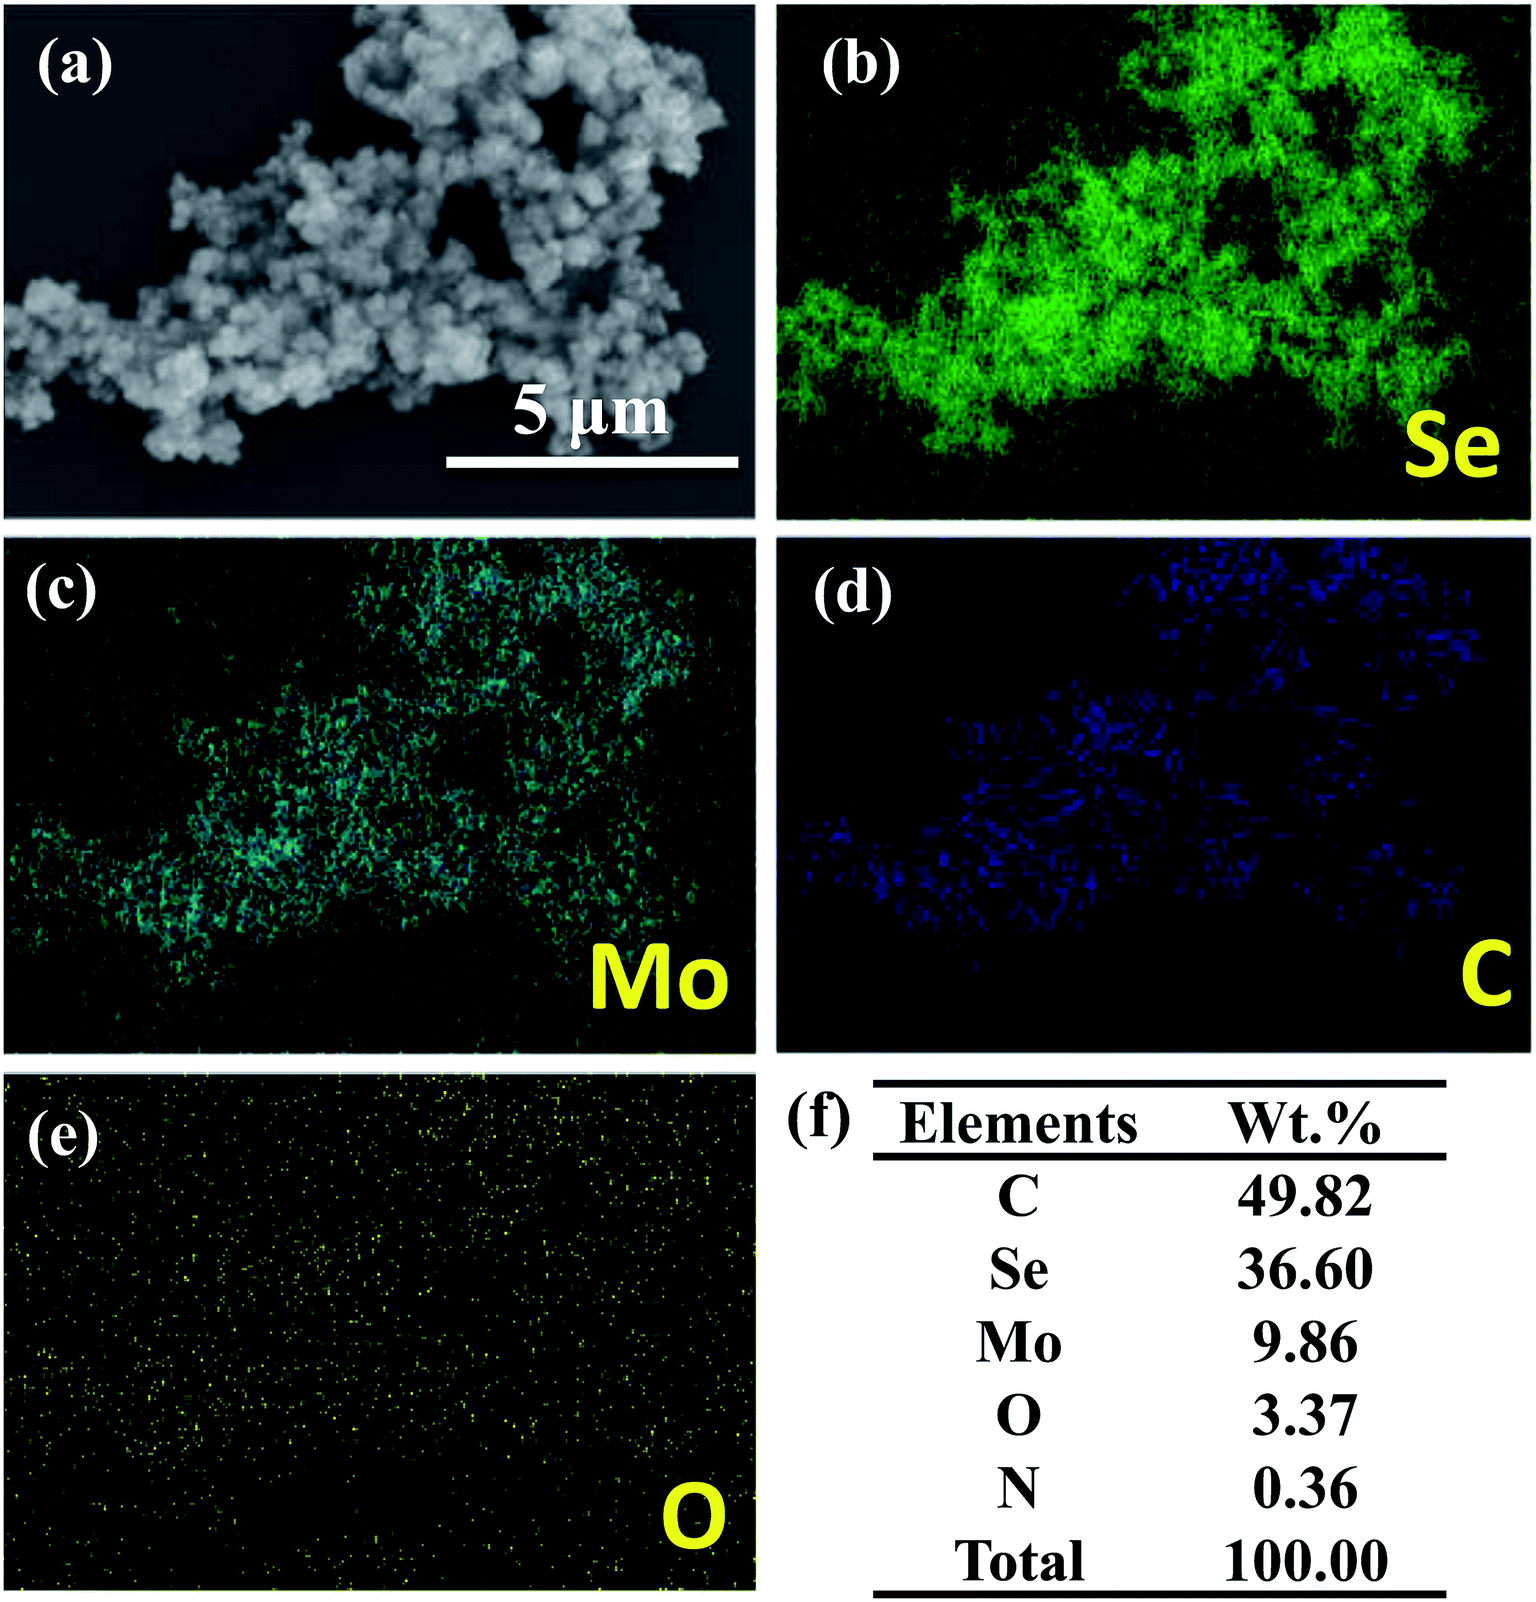 | ||
| Fig. 2 (a) SEM image, (b–e) EDS elemental maps and (f) element wt% of carbon-doped MoSe2. | ||
3.2 FT-IR, XRD, XPS and thermal analyses
The FT-IR spectrum of MoSe2 is shown in Fig. 3a. The adsorption band from 1998 cm−1 to 2662 cm−1 is attributed to the stretching vibration of NH2+ and NH3+. The adsorption peak at 1611 cm−1 can be attributed to the variable angular vibration of NH2 and NH2+. And the adsorption band at 676 cm−1 can be attributed to the C–OH out-plane bending from alcohols.19 These carbon functional groups further proved that the MoSe2 particles contained C element after adding ethanol in preparation processes. As indicated in Fig. 3b, the characteristic diffraction peaks of the MoSe2 nanoparticles on the XRD spectrum were agree with the standard pattern of the MoSe2 crystal (JCPDS card no. 20-0757).12 The XRD pattern of the MoSe2 sample shows broad diffraction peaks, which reflects the nano size of products.20 The above data revealed that the ethanol ultimately caused these MoSe2 nanoparticles to contain C element, and the MoSe2 nanoparticles contained C element also have classic MoSe2 crystal.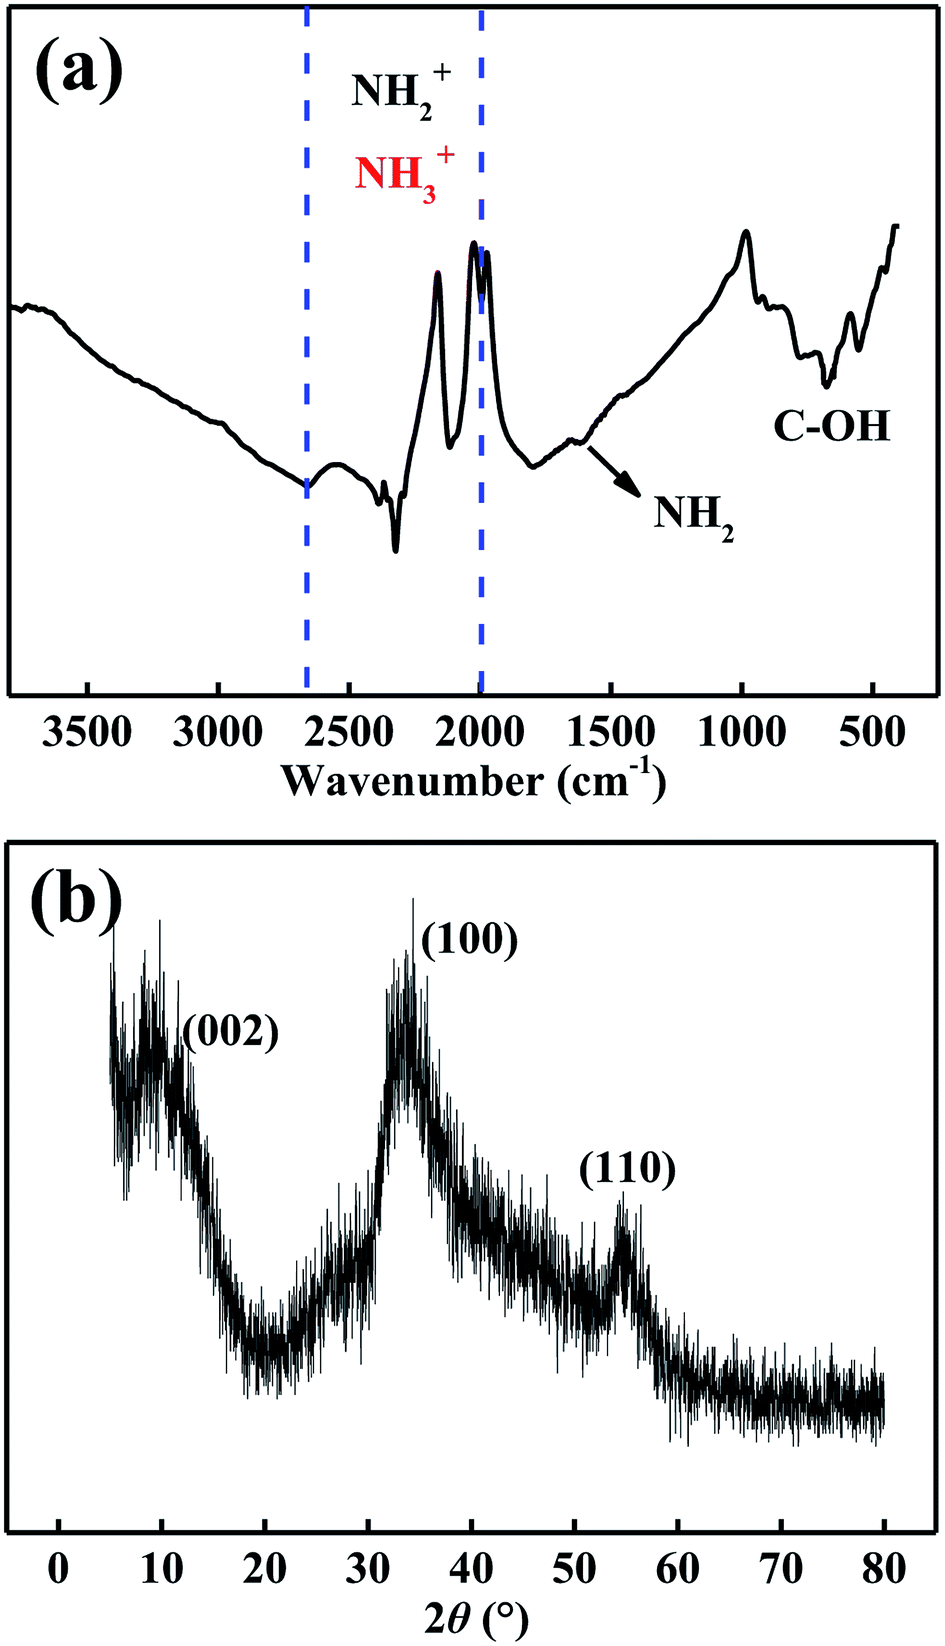 | ||
| Fig. 3 (a) FT-IR spectrum and (b) XRD pattern of carbon-doped MoSe2 nanoparticles. | ||
XPS characterization was used to analysis the composition of elements and their chemical state. In Fig. 4, the atoms of C, Se, Mo, O and N were detected. In Fig. 4b, the fitting peaks mainly present in four groups: Se Auger, C 1s, C–OR and COOR 288.5 eV. The standard peak of C 1s is at 285.0 eV, and the fitting peak at 283.2 eV corresponding to C 1s because of the peak shifted 1.8 eV. In Fig. 4c, the Se 3d fitting peaks at 53.8 eV and 52.9 eV can be attributed to the Se 3d3/2 and Se 3d5/2,20 the two characteristic peaks of Se 3d5/2 and Se 3d3/2 reveal the existence state of Se2−.21 And the standard peaks of Se 3d3/2 and Se 3d5/2 are at 55.7 and 54.9 eV, respectively, and the peaks shifted about 1.8 eV. In Fig. 4d, the fitting peaks of Mo 3d3/2 and Mo 3d5/2 are at 230.5 and 227.3 eV,22 and the standard peaks are at 231.1 and 228.0 eV. The obtained XPS results were inconsistent with the standard values because of the peaks may shift. In Fig. 4e, the fitting peak at 532.6 eV shows the existence of C–OH because of the ethanol was added in the preparation process. Meanwhile, the peak at 529.5 eV can be attributed to the formation of MoO3 on the surface of MoSe2.23 And the small peaks of N 1s shows the MoSe2 nanoparticles contain some residual N element (Fig. 4f).
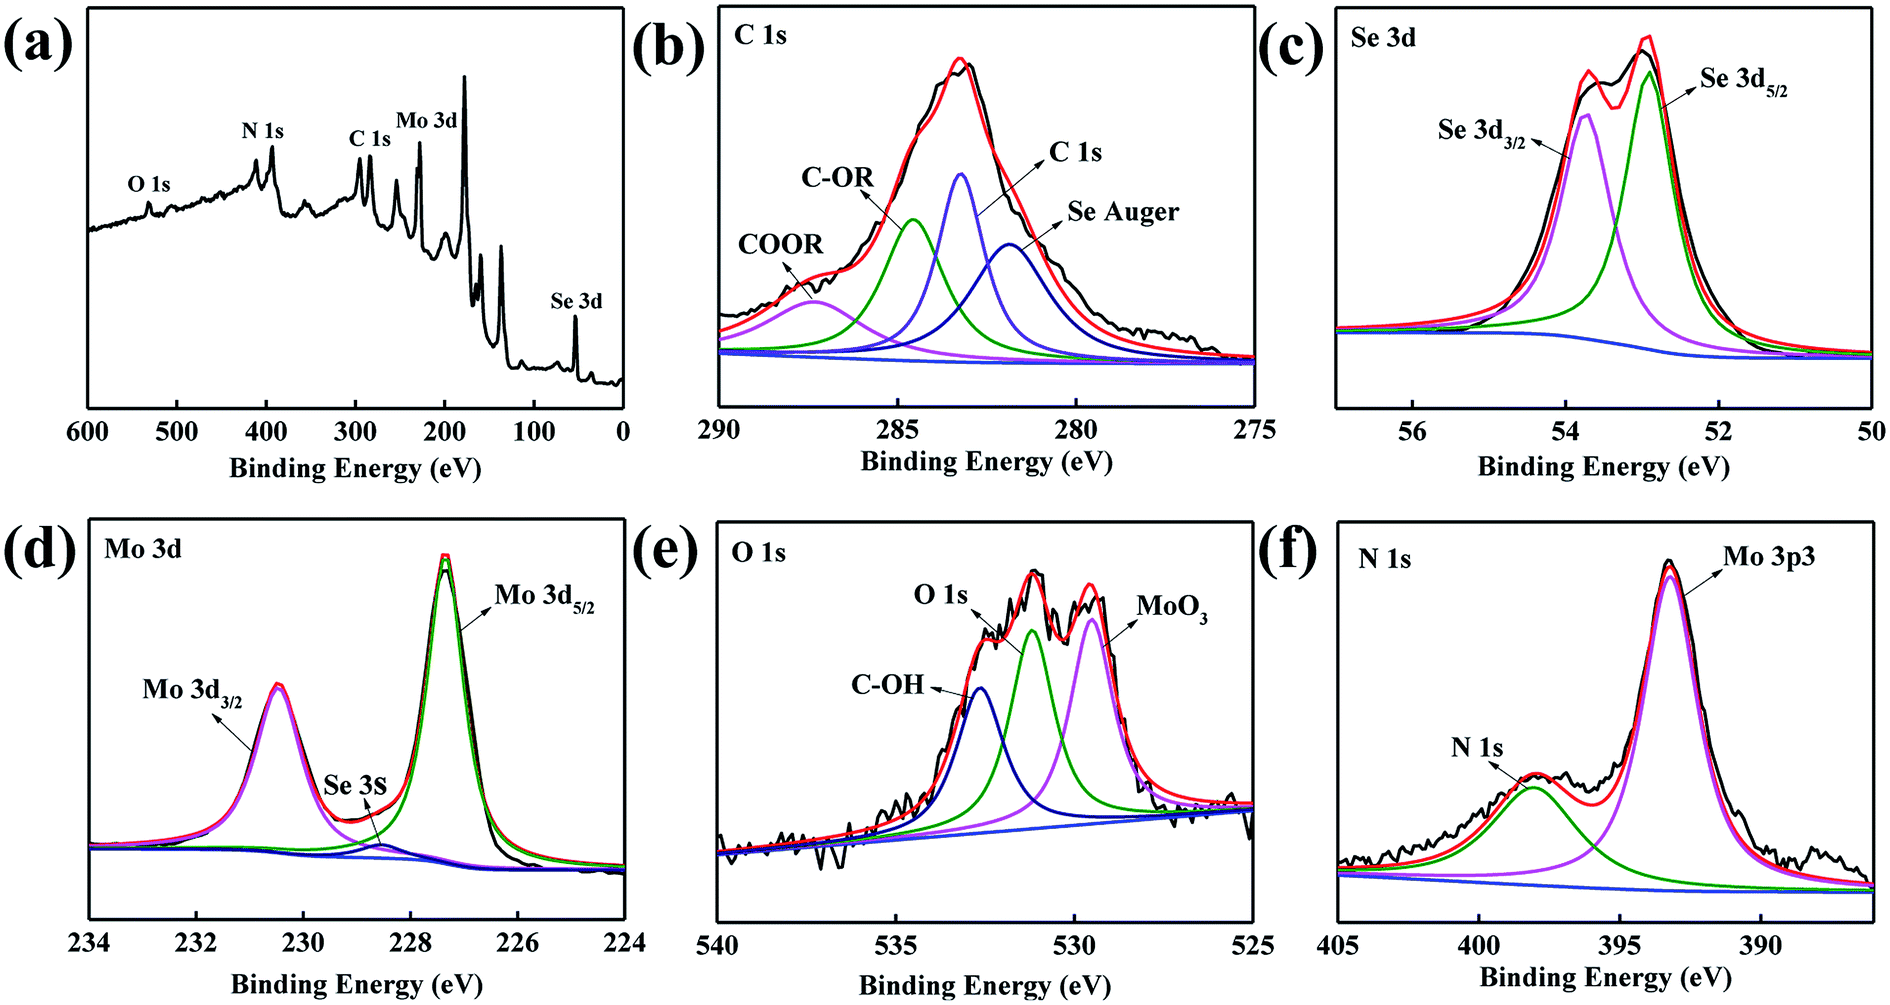 | ||
| Fig. 4 (a) XPS spectrum of MoSe2, (b) high resolution XPS of C 1s, (c) high resolution XPS of Se 3d, (d) high resolution XPS of Mo 3d. (e) high resolution XPS of O 1s and (f) high resolution XPS of N 1s. | ||
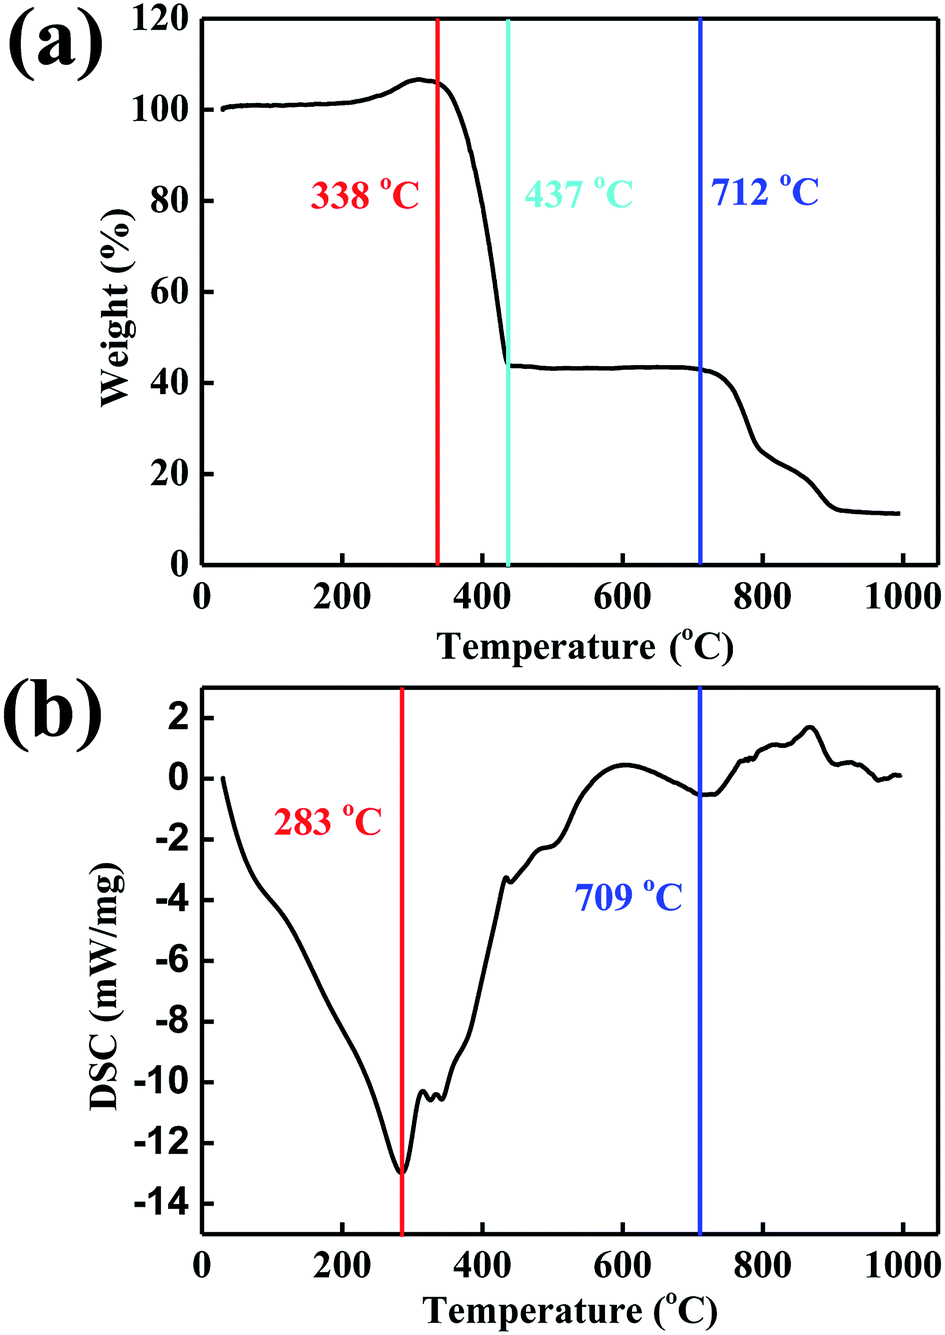
Thermogravimetric analyzer was used to study the thermal stability of the carbon-doped MoSe2 nanoparticles. As shown in Fig. 5a, the weight loss about these films present different curves. The MoSe2 nanoparticles will react with air, and the MoSe2 nanoparticles have the weight increase before the temperature of 311 °C, and the weight of the sample increase was at about 6.65%. And the carbon-doped MoSe2 nanoparticles have sharply weight loss in the temperature range of 338–437 °C, which can be attributed to the decomposition of the MoSe2 nanoparticles. Then the MoSe2 nanoparticles have little weight loss in the temperature range of 437–712 °C, and they have relatively steady weight loss in the temperature range of 712–908 °C. In addition, the weight of MoSe2 nanoparticles become stable and shows a loss of 88.5% after 908 °C. DSC result indicated the total heat of melt, the endothermic peaks of MoSe2 nanoparticles were at 283 °C and 709 °C (Fig. 5b). The data revealed that the two thermo-oxidative decomposition temperatures were at 283 °C and 709 °C. Compared with the 338 °C in TG (Fig. 5a), the weight increase revealed that the carbon-doped MoSe2 nanoparticles were also reacted with air after 283 °C.
 | ||
| Fig. 5 (a) TG and (b) DSC curves of carbon-doped MoSe2. | ||
3.3 Cell evaluations
The cell viabilities of 786-O and ACHN cells were measured after being incubated with various concentrations of the carbon-doped MoSe2 for 24 h. Fig. 6 shows that the carbon-doped MoSe2 have good inhibited proliferation for renal cancer cells. Herein, it was found that the cell viabilities of 786-O were estimated to be less than 50% when the concentrations are up to 6 μg mL−1 (Fig. 6a), and the cell viabilities of ACHN were estimated at about 50% when the concentrations are up to 4 μg mL−1 (Fig. 6b).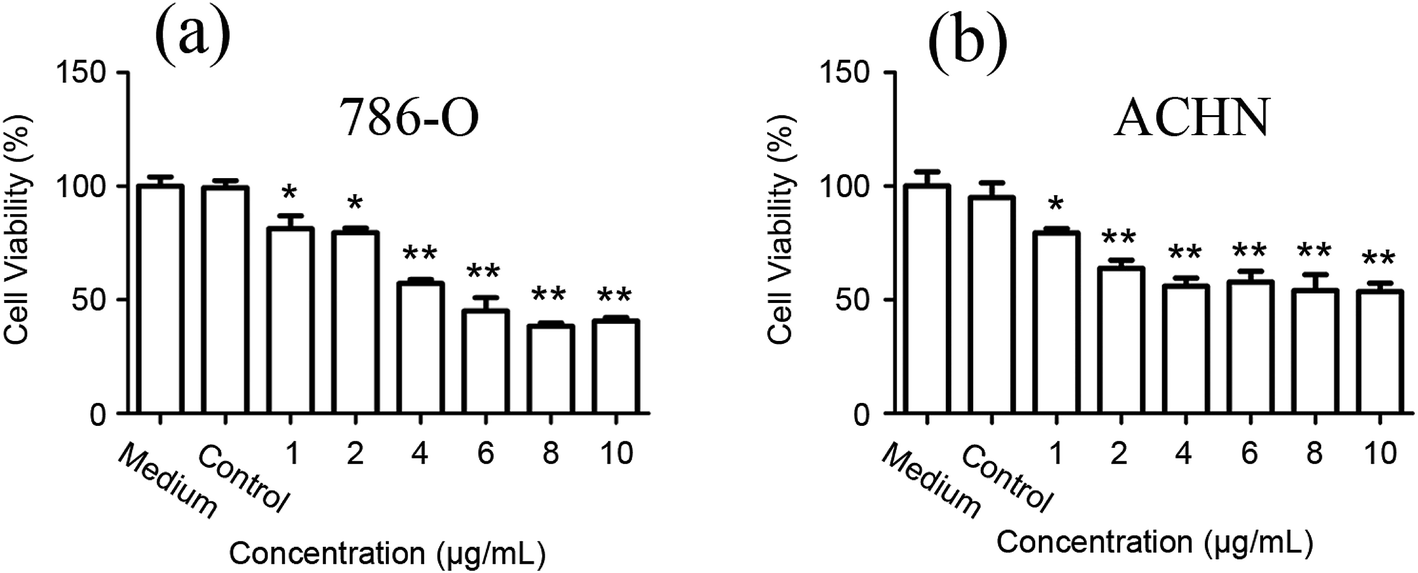 | ||
| Fig. 6 MoSe2 inhibited proliferation of renal cancer cells (a) 786-O and (b) ACHN were treated with different concentration of MoSe2 or DMSO (control) for 24 h, and MTT assay was applied to test cell viability. Results are shown as the mean ± SD. *p < 0.05, **p < 0.01. | ||
Furthermore, the TUNEL assay was used to detect DNA fragmentation following the treatment of RCC cells with carbon-doped MoSe2. In Fig. 7, the FITC is activated after treating with carbon-doped MoSe2, including DNA damage, and is an essential regulator of apoptosis. Therefore, the effect of MoSe2 treatment on FITC expression was analyzed. FITC expression was markedly upregulated in 786-O, ACHN and HK-2 cells after treating with carbon-doped MoSe2 alone for 12 h. This experiment was used to quantify the difference in uptake in normal and tumor cells. As a result, there are less HK-2 cells than tumor cells in fluorescence images, which indicated that the uptake ability of HK-2 cells for carbon-doped MoSe2 particles was weaker than tumor cells.
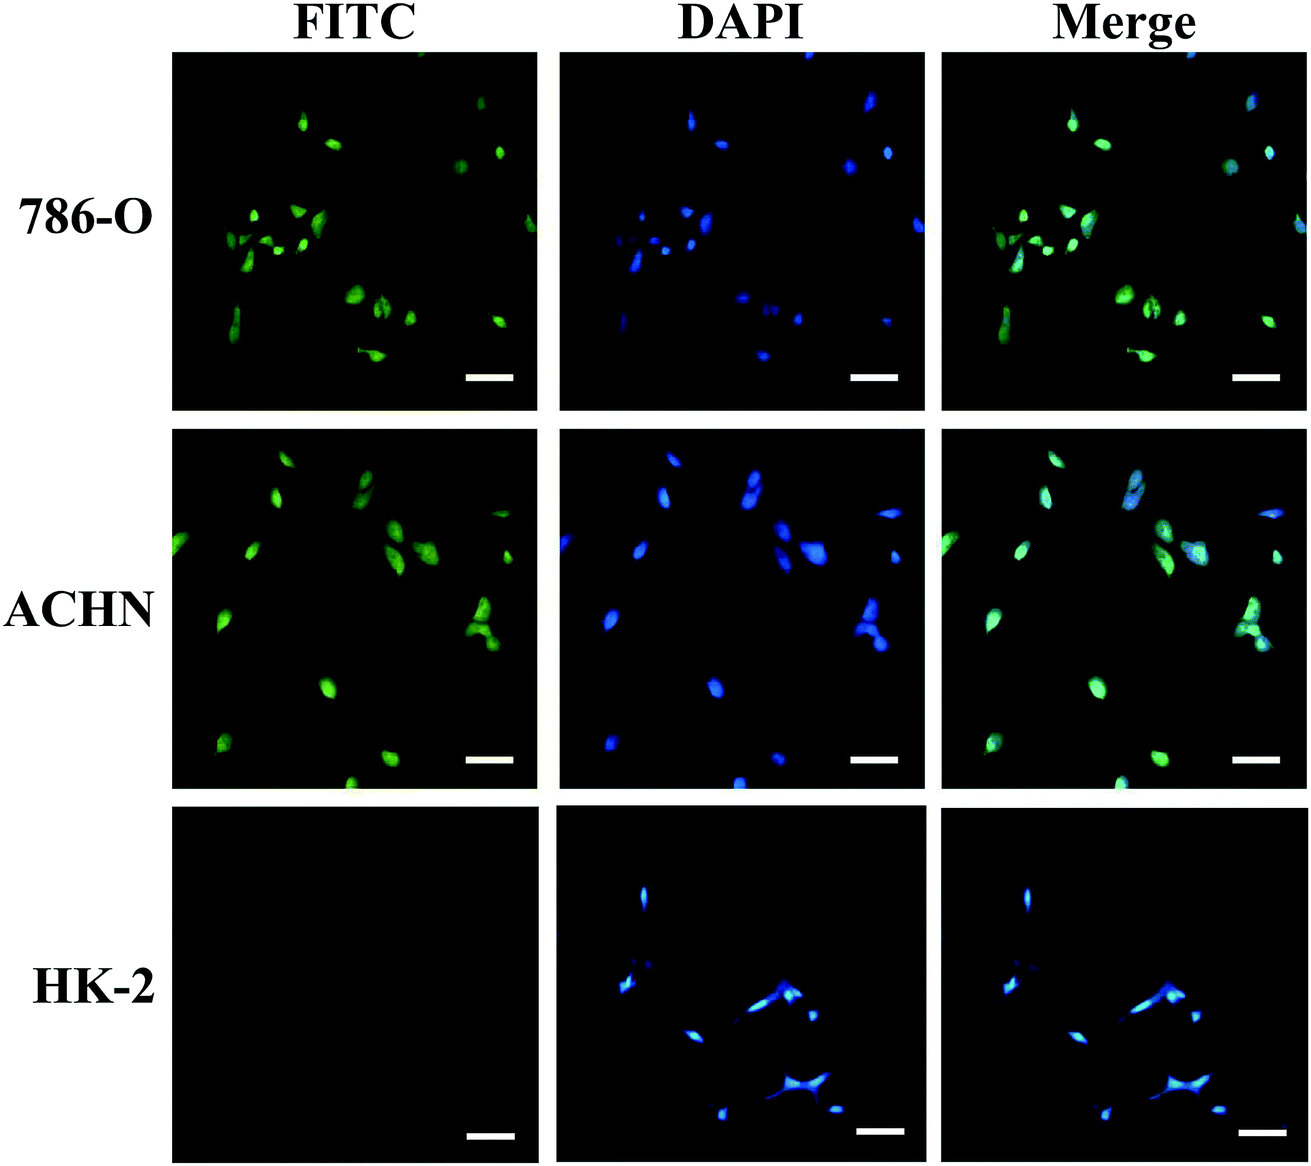 | ||
| Fig. 7 Fluorescence images of 786-O, ACHN and HK-2 cells incubated with the BSA-coated MoSe2 for 12 h. All the MoSe2 were labeled with FITC. The cell nuclei are stained with DAPI (blue) and the scale bar is 50 μm. | ||
To investigate whether the treatment with carbon-doped MoSe2 could induce cell death in RCC cells, the 786-O renal cancer cells were treated with the agents. Apoptosis was detected using flow cytometry. As demonstrated in Fig. 8a, the 786-O cells are treated with alone carbon-doped MoSe2, the results exhibit increased apoptosis in RCC cells. In Fig. 8b, the percentage of apoptotic 786-O cells following carbon-doped MoSe2 treatment were 18.2% (4 μg mL−1) and 20.5% (6 μg mL−1), which had significantly increased compared with medium and control treatment.
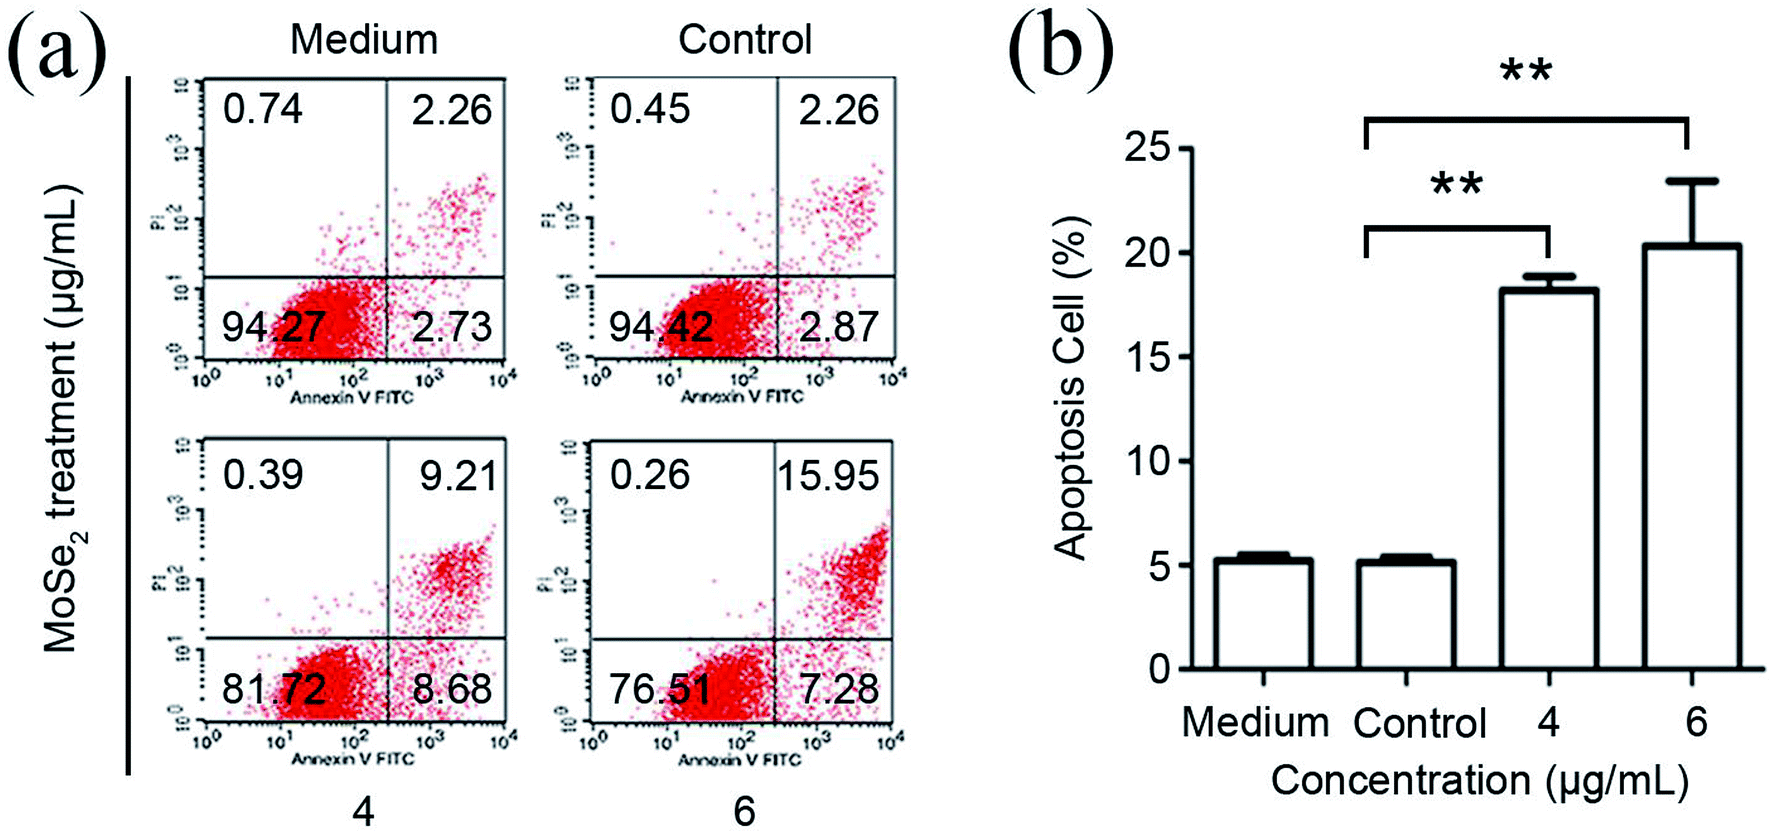 | ||
| Fig. 8 MoSe2 promoted apoptosis of 786-O cells. (a) Flow cytometry analysis and (b) statistical analysis to detect the apoptotic effect of MoSe2 on 786-O cells. After treatment with MoSe2 for 24 h, 786-O cells were harvested and stained with annexin-V/propidium iodide (PI), and followed by FACS analysis as mentioned above. Results are shown as the mean ± SD. **p < 0.01. | ||
3.4 Bio-TEM analyses
Bio-TEM image in Fig. 9a shows the MoSe2 particles in the 786-O cell, and the 786-O cell can uptake the big particles (above 1 μm). Moreover, Fig. 9b shows the high-magnification image and it further confirms that these MoSe2 particles are easy to reunite. All these results indicate that the tumor cells have high cellular uptake efficiency for MoSe2, possibly due to the albumin receptor-mediated endocytosis pathway in the cells.13,14,24–26 And the reason of apoptosis may be related to the autophagic lysosome, because this material can combine with the lysosome. As a result, the carbon-doped MoSe2 particles could enter the 786-O cells and inhibited the proliferation.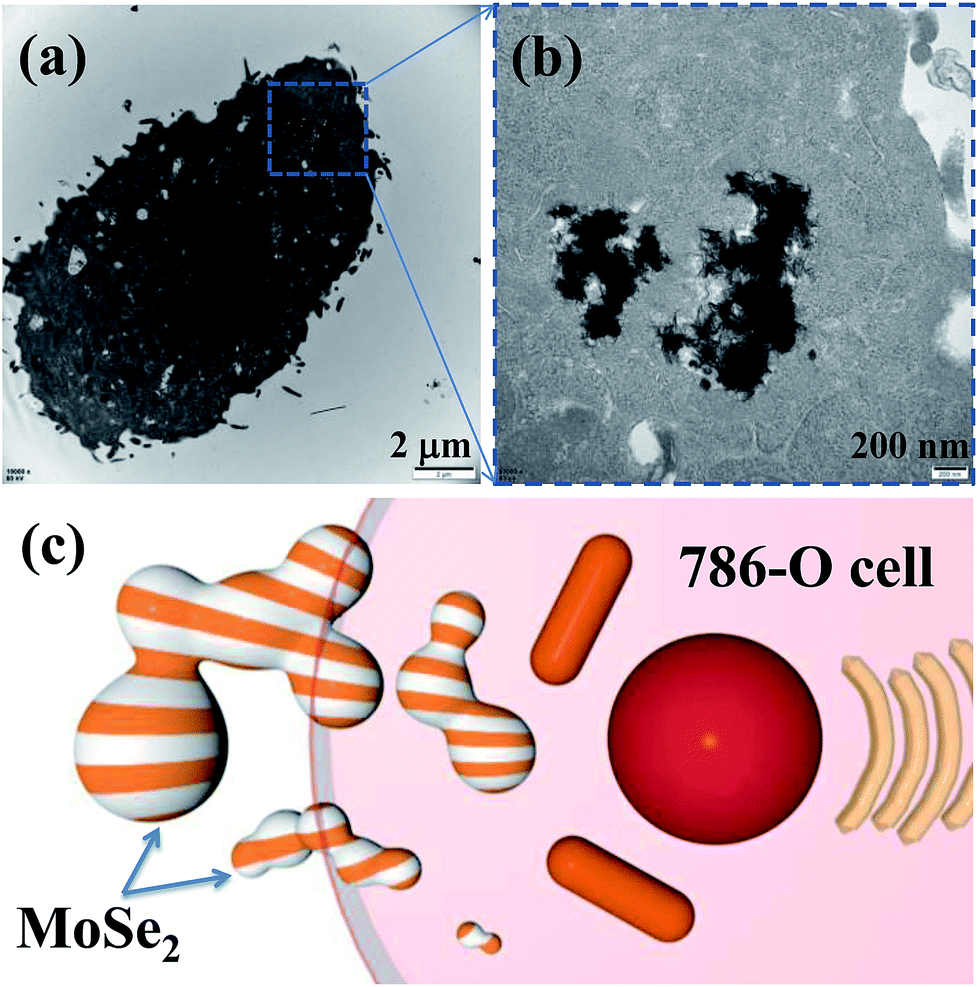 | ||
| Fig. 9 (a and b) Bio-TEM images of the MoSe2 treated 786-O cell, and (c) schematic illustration of MoSe2 particles in 786-O cell. | ||
3.5 Relevant mechanisms
Considering that the ideal agent should have good biocompatibility for biomedical field applications, the cytotoxicity of the carbon-doped MoSe2 was evaluated. Herein, the cell viabilities of HK-2 cells were measured after being incubated with various concentrations of the MoSe2 for 24 h. It was found that no obvious toxicity was observed for these cells. The cell viabilities decrease with the concentration increasing, and all the results estimate to be greater than 90% (Fig. 10a). Because the normal cells have weaker cellular uptake efficiency than tumor cells, and the uptake ability may cause small particles to enter the cells, but the big MoSe2 particles can't enter the HK-2 cells as Fig. 10b shown. So, less MoSe2 particles can't inhibit the proliferation for HK-2 cells.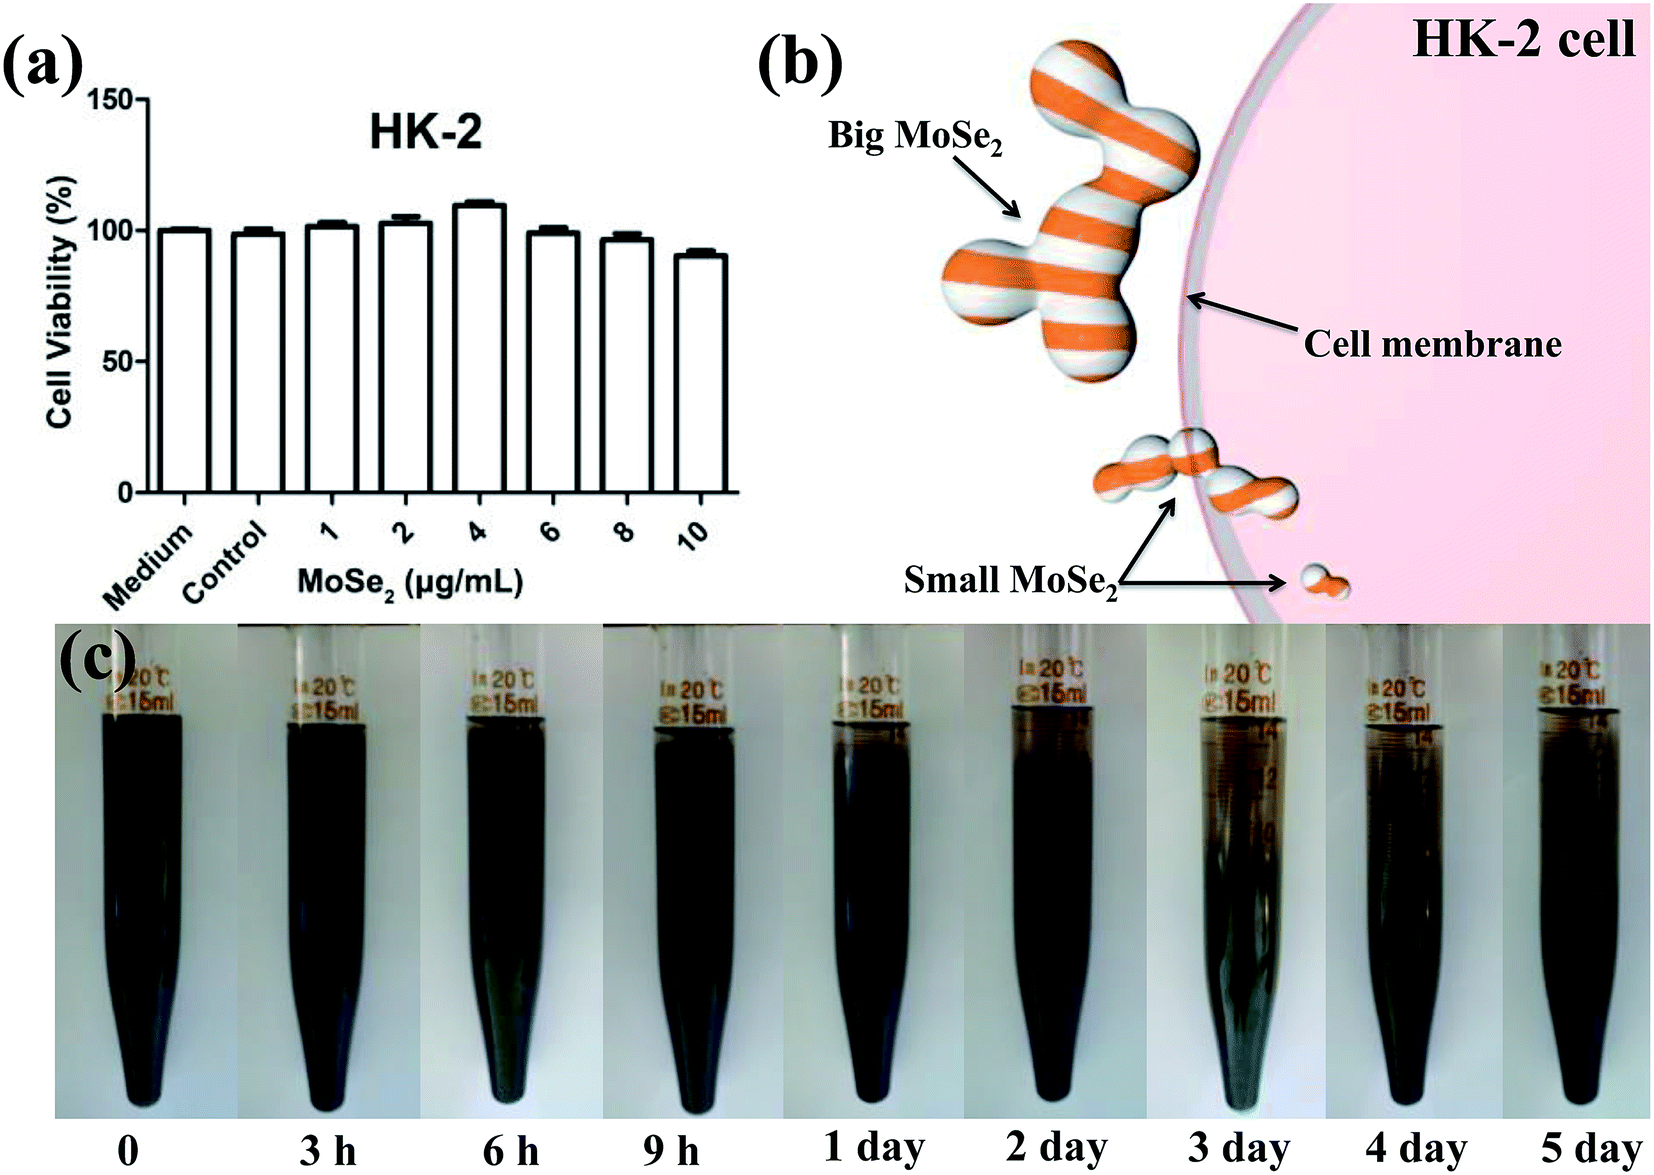 | ||
| Fig. 10 (a) Viabilities of HK-2 cells incubated with the MoSe2 at different concentrations for 24 h, (b) schematic illustration of MoSe2 particles in 786-O cell, and (c) suspension performances of the MoSe2 particles in distilled water. | ||
Furthermore, normal MoSe2 particles have poor suspension property and they are easy to precipitate because of particles aggregation in water. But the Fig. 10c shows that the carbon-doped MoSe2 particles have good suspension performances. The FT-IR and XPS show that the carbon-doped MoSe2 particles have C–OH, COOR, C–OR and NH2, and these particles will have hydrogen bond effect in aqueous solution.27–29 As a result, these carbon-doped MoSe2 nanoparticles will bonded with each other via hydrogen bond effect to form big particles. So, these carbon-doped MoSe2 particles appeared precipitation phenomenon during 6 h because of the formation of big MoSe2 particles. And in the next days, the precipitation speed was slow, and then the speed became relatively steady after 3 days. It is because the MoSe2 nanoparticles formed big particles, and these big particles will further crosslink with each other via hydrogen bonds to form a bonded network structure. At this point, the hydrogen bond effect is beneficial to suspend for the carbon-doped MoSe2 particles.
The tumor cells have higher uptake ability than HK-2 cells, the carbon-doped MoSe2 particles can be absorbed by tumor cells and then cause apoptosis. The reason of apoptosis may be related to the autophagic lysosome, because this material can combine with the lysosome. In conclusion, the MoSe2 nanoparticles reunited to form bigger particles, and the HK-2 cells could not uptake these big particles which caused the HK-2 cells to have high viabilities.
4 Conclusions
This study prepared carbon-doped MoSe2 nanoparticles, and the EDS, FT-IR, XPS, TG and DSC proved that the MoSe2 nanoparticles contained carbon compound. And the fluorescence microscopy, flow cytometry assay and MTT results revealed that the carbon-doped MoSe2 nanoparticles have significantly anti-cancer effect, and the 786-O and ACHN cells were markedly reduced after MoSe2 treating. Meanwhile, the carbon-doped MoSe2 nanoparticles with the high viability for KH-2 cells in vitro (above 90%), which indicated that these carbon-doped MoSe2 nanoparticles with minimal toxicity. The mechanism analyses revealed that the carbon-doped MoSe2 particles have good suspension property in aqueous solution, and then the aggregation effect caused the MoSe2 particles to become bigger. The tumor cells have higher uptake ability than HK-2 cells, which finally caused the KH-2 cells to have higher viability in carbon-doped MoSe2 concentration. These carbon-doped MoSe2 particles have obviously anti-cancer effect to 786-O and ACHN cells and with good biocompatibility to KH-2 cells, which suggested that these materials may be a potential therapeutic candidate against RCC.Author contributions
All authors discussed the results and commented on the manuscript. L. G. and Y. Z. F. contributed equally to this work and should be considered co-first authors.Conflicts of interest
There is no conflict between the authors, and there are no conflicts of interest.Acknowledgements
This work is supported by National Natural Science Foundation of China (No. 81672538).References
- C. Liang, Y. Chao, S. Sida, Y. Xuan, G. Hua, Y. Kai and L. Zhuang, ACS Nano, 2015, 9, 11090–11101 CrossRef PubMed.
- K. D. Miller, R. L. Siegel, C. C. Lin, A. B. Mariotto, J. L. Kramer, J. H. Rowland, K. D. Stein, R. Alteri and A. Jemal, Ca-Cancer J. Clin., 2016, 66, 271–289 CrossRef PubMed.
- P. Camparo, Diagn. Interv. Imaging, 2012, 93, 221–231 CrossRef PubMed.
- H. T. Cohen and F. J. Mcgovern, N. Engl. J. Med., 2005, 353, 2477 CrossRef CAS PubMed.
- S. Duensing and M. Hohenfellner, Lancet, 2016, 387, 1973–1974 CrossRef.
- I. J. Frew and H. Moch, Annu. Rev. Pathol., 2015, 10, 263–289 CrossRef CAS PubMed.
- H. Axelson and M. E. Johansson, Semin. Canc. Biol., 2013, 23, 56–61 CrossRef CAS PubMed.
- C. Manish, L. Zhongfan and Z. Hua, Chem. Soc. Rev., 2015, 44, 2584–2586 RSC.
- Y. Lichun, W. Sinong, M. Jianjiang, D. Junwen, G. Qingsheng, T. Yi and O. G. Schmidt, Adv. Mater., 2013, 25, 1180–1184 CrossRef PubMed.
- B. Mao, T. Bao, J. Yu, L. Zheng, J. Qin, W. Yin and M. Cao, Nano Res., 2017, 10, 2667–2682 CrossRef CAS.
- W. Z. Teo, E. L. Chng, Z. Sofer and M. Pumera, Chemistry, 2014, 20, 9627–9632 CrossRef CAS PubMed.
- J. Pan, X. Zhu, X. Chen, Y. Zhao and J. Liu, Biomater. Sci., 2018, 6, 372–387 RSC.
- C. Zhong, X. Zhao, L. Wang, Y. Li and Y. Zhao, RSC Adv., 2017, 7, 7382–7391 RSC.
- J. Chen, X. Li, X. Liu, H. Yan, Z. Xie, Z. Sheng, X. Gong, L. Wang, X. Liu, P. Zhang, H. Zheng, L. Song and C. Liu, Biomater. Sci., 2018, 6, 1503–1516 RSC.
- L. Yuwen, J. Zhou, Y. Zhang, Q. Zhang, J. Shan, Z. Luo, L. Weng, Z. Teng and L. Wang, Nanoscale, 2015, 8, 2720 RSC.
- Z. Lei, W. Zhu, S. Xu, J. Ding, J. Wan and P. Wu, ACS Appl. Mater. Interfaces, 2016, 8, 20900–20908 CrossRef CAS PubMed.
- C. Wang, J. Bai, Y. Liu, X. Jia and X. Jiang, ACS Biomater. Sci. Eng., 2016, 2, 2011–2017 CrossRef CAS.
- J. Huang, B. Jin, H. Liu, X. Li, Q. Zhang, S. Chu, R. Peng and S. Chu, J. Mater. Chem. A, 2018, 6, 11424–11434 RSC.
- S. wen, Fourier transform infrared spectrometry, Chemical Industry Press, 2010 Search PubMed.
- H. Tang, K. Dou, C.-C. Kaun, Q. Kuang and S. Yang, J. Mater. Chem. A, 2014, 2, 360–364 RSC.
- Z. Lei, S. Xu and P. Wu, Phys. Chem. Chem. Phys., 2015, 18, 70–74 RSC.
- H. Wang, D. Kong, P. Johanes, J. J. Cha, G. Zheng, K. Yan, N. Liu and Y. Cui, Nano Lett., 2013, 13, 3426–3433 CrossRef CAS PubMed.
- N. Xue and P. Diao, J. Phys. Chem. C, 2017, 121, 14413–14425 CrossRef CAS.
- S. Baghaie, M. T. Khorasani, A. Zarrabi and J. Moshtaghian, J. Biomater. Sci. Polym. Ed., 2017, 28, 2220–2241 CrossRef CAS PubMed.
- F. Zou, R. Li, J. Jiang, X. Mo, G. Gu, Z. Guo and Z. Chen, J. Biomater. Sci. Polym. Ed., 2017, 28, 2255–2270 CrossRef CAS PubMed.
- E. Dalton and M. N. Collins, J. Appl. Crystallogr., 2014, 47, 847–851 CrossRef CAS.
- H. Lu, L. Lv, J. Ma, W. Ban, S. Ren, G. Dong, J. Li and X. Dang, J. Mech. Behav. Biomed. Mater., 2018, 88, 261–269 CrossRef CAS PubMed.
- H. Lu, S. Ren, P. Zhang, J. Guo, J. Li and G. Dong, RSC Adv., 2017, 7, 21600–21606 RSC.
- H. Lu, S. Ren, J. Guo, Y. Li, J. Li and G. Dong, Mater. Sci. Eng., C, 2017, 78, 239–245 CrossRef CAS PubMed.
| This journal is © The Royal Society of Chemistry 2019 |