DOI:
10.1039/C9RA01018A
(Paper)
RSC Adv., 2019,
9, 10889-10896
Multifunctional BiF3:Ln3+ (Ln = Ho, Er, Tm)/Yb3+ nanoparticles: an investigation on the emission color tuning, thermosensitivity, and bioimaging†
Received
8th February 2019
, Accepted 18th March 2019
First published on 8th April 2019
Abstract
Pure cubic phase and uniform BiF3:Ln3+ (Ln = Ho, Er, Tm)/Yb3+ nanoparticles (NPs) were prepared by coprecipitation. The growth mechanism of BiF3:2%Er3+/20%Yb3+ NPs was proposed based on evolution analysis of the time-dependent morphology, in which BiF3:2%Er3+/20%Yb3+ was formed through the growth process of “nucleation to crystallization and Ostwald ripening”. The upconversion luminescence (UCL) properties and mechanism of BiF3:Ln3+ (Ln = Ho, Er, Tm)/Yb3+ under dual-wavelength excitation were also systematically investigated. The emission intensity of BiF3:2%Er3+/20%Yb3+ by dual-wavelength excitation (λ = 980 nm + 1550 nm) was 1.49 times more than that excited by 1550 nm or 980 nm individually. Furthermore, the properties of the bright white and multicolor UCL showed that yellow, purple, green, or pinkish light could be observed by controlling the doping concentration of Ln3+ (Ln = Yb, Er, Tm, and Ho), indicating that they had potential applications in backlight sources of color displays and security labeling. The temperature sensitivity of BiF3:2%Er3+/20%Yb3+ exhibited a downward tendency and its max value was about 0.0036 K−1 at 273 K. Cell toxicity tests showed that the UCNPs in phospholipid aqueous solution presented low cytotoxicity. Also, in vivo imaging and X-ray imaging revealed that the BiF3:2%Er3+/20%Yb3+ NPs had deep penetration and high contrast, which meant it could be used as a potential probe and contrast agent in in vivo optical bioimaging.
1. Introduction
Recently, UCNPs doped with lanthanides (Ln) have made considerable progress.1–7 Compared to organic dyes and conventional quantum dot materials, Ln3+-doped UCNPs are better in terms of chemical stability, toxicity, optical stability, luminous life, and emission peak, resulting in UCNPs having the advantages of weak auto-fluorescence, low radiation damage, and deep tissue penetration.8–16 Therefore, they have great potential in different fields.17 It is well known that UC emission can be accurately controlled through adjusting the concentrations of different activator ions (Er3+, Tm3+, Ho3+). Also, white and multicolor UCLNPs have attracted much attention due to their potential applications in backlight sources in color displays and security labeling.18,19
It is well known that matrix selecting is an important factor to get desired UCL, in which various host materials, such as sulfide, fluorides, oxygenated compounds, can be used for UC emissions.20–22 Among these, fluorides are considered as excellent hosts because of their relatively lower cut-off phonon frequency and lower non-radiative relaxation.23–27 Zhang et al. reported the excellent matrix NaBiF4 without a rare earth ion fabricated by a super facile synthetic method, in which the reaction only took 1 min at room temperature.28 Yu et al. used the same method to synthesize NaBiF4:Yb3+/Er3+ NPs and BiF3:Yb3+/Er3+ NPs and investigated their UCL properties and temperature sensitivity.29,30 However, investigations on multicolor UCL, UCL excited by dual-wavelength, and the bio-imaging of BiF3:Yb3+/Er3+ have not been performed yet, but are very important for their application.5,18,31 Herein, this motivated us to further study these excellent matrix BiF3:Yb3+/Ln3+ (Ln = Ho, Er, Tm) NPs in a deeper investigation.
In this work, the cubic phase of BiF3:Ln3+ (Ln = Ho, Er, Tm)/Yb3+ UCNPs was designed and synthesized by the same facile strategy. Their UCL properties were investigated by excitation at 1550 nm and 980 nm, simultaneously. The growth mechanism and the effect of time on their morphology was also explored. The function of different doped concentrations of Er3+, Ho3+, and Tm3+ ions for the multicolor and white emission were also investigated. In vivo and X-ray imaging of the BiF3:2%Er3+/20%Yb3+ NPs were studied.
2. Experimental
2.1 Preparation
All reagents were purchased from Aladdin Chemical Reagent Factory (China) in this research and used without further treatment. The synthesis of the cubic BiF3:Ln3+/Yb3+ UCNPs proceeded as reported in ref. 30 (see ESI†).
2.2 Characterization
Details on the instruments used are presented in the ESI.†
2.3 In vitro cytotoxicity evaluation, and in vivo and X-ray imaging
The relevant evaluation32 of cytotoxicity in vitro and in vivo and X-ray imaging were presented in ESI.†
3. Results and discussion
3.1 Characterization of the phase and morphology
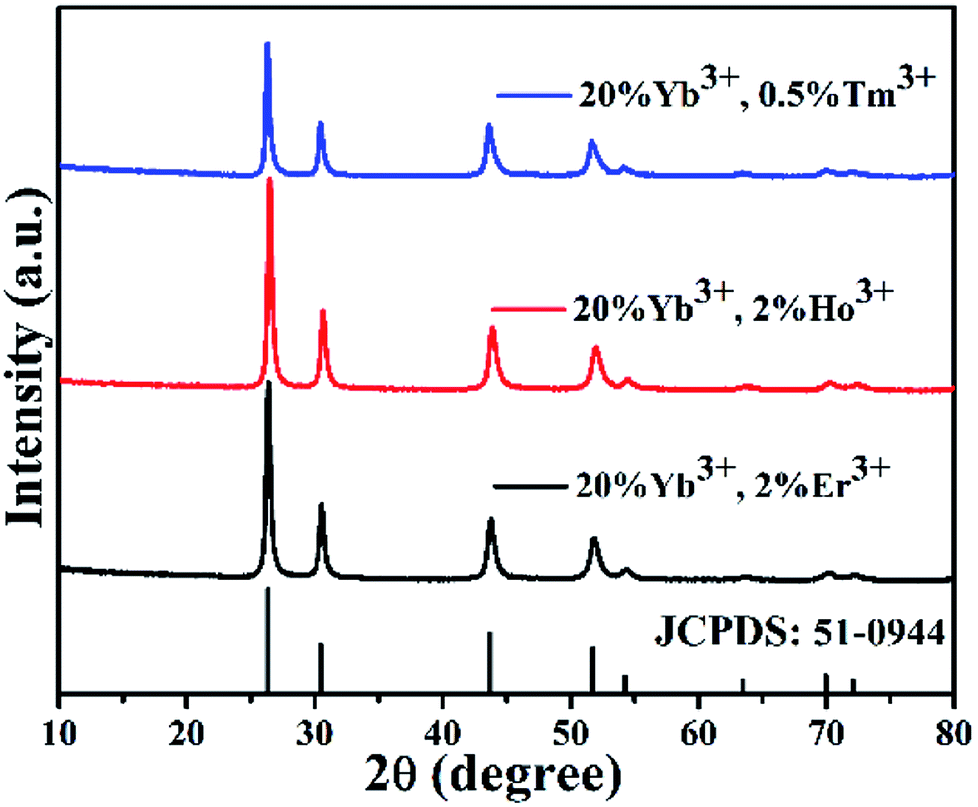
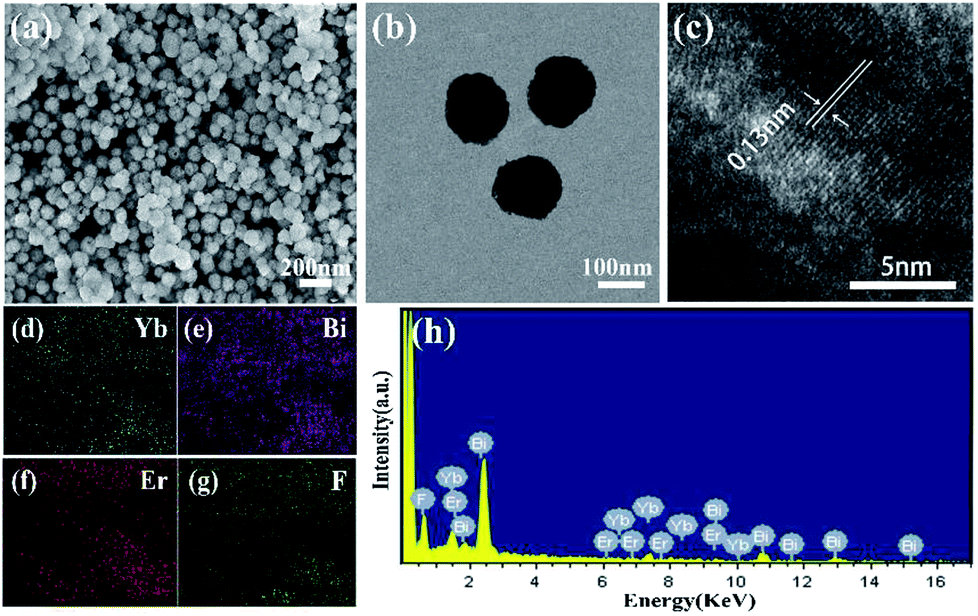
The crystal phases of BiF3:Ln3+/Yb3+ NPs were determined by XRD as shown in Fig. 1, in which they presented similar crystal cubic phases (JCPDS: 51-0944). The SEM image of BiF3:2%Er3+/20%Yb3+ NPs, as an example, exhibited regular NPs (Fig. 2a), which was confirmed by the TEM image (Fig. 2b). Fig. 2c shows that the d-spacing was 0.13 nm, which matched with the crystal plane (331) of the cubic phase BiF3 NPs. According to the results of element mapping (Fig. 2d–g), it was clear that the elements of Bi, Yb, Er, and F were uniform on the NPs. These elements were also confirmed by the EDX spectrum (Fig. 2h). BiF3:20%Yb3+,0.5%Tm3+/2% Ho3+ are presented in Fig. S1† and their SEM images are shown in Fig. S2,† which further illustrates the formation of BiF3:Ln3+(Ln = Ho, Er, Tm)/Yb3+ UCNPs.
 |
| | Fig. 1 XRD patterns of BiF3:Ln3+/Yb3+. | |
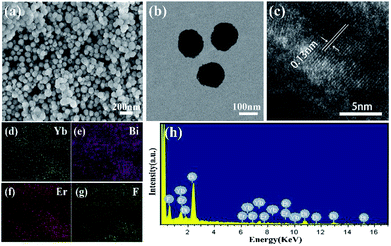 |
| | Fig. 2 Characterization of BiF3:2%Er3+/20%Yb3+ NPs: (a) SEM image, (b) TEM image, (c) HRTEM image, (d–g) elemental mappings of Yb, Bi, Er, and F, (h) energy-dispersive X-ray (EDX) spectrum. | |
The XPS of BiF3:2%Er3+/20%Yb3+ NPs was measured (Fig. S3a†). Two peaks centered at 159.9 eV and 165.1 eV were assigned to Bi 4f7/2 and Bi 4f5/2 (Fig. S3b†). The peaks located at 684.4, 165.3, and 186.1 eV were attributed to the BiF3:2%Er3+/20%Yb3+ NPs of Yb 4d, F 1s, and Er 4d, respectively (Fig. S3c–e†).
The stability of the BiF3:2%Er3+/20%Yb3+ NPs was investigated. The TG-DSC curve (see Fig. S4†) showed that the NPs had a mild loss of weight below 600 °C. The loss of water or crystalline water could be calculated at about 100 °C. When heated at 200 °C, the glycol on the surface of the sample gradually disappeared, and the surface defects of the sample gradually decreased. When the temperature reached up to 600 °C, the sample itself began to decompose and then the mass declined linearly.
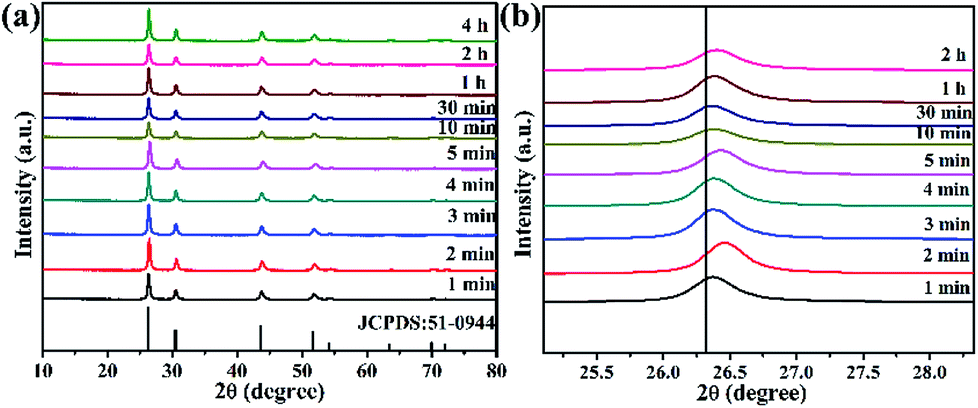
To verify whether the reaction time affected the phase and morphology, XRD patterns and SEM/TEM images of BiF3:2%Er3+/20%Yb3+ NPs prepared at different reaction times were investigated (Fig. 3 and 4). The results showed that the diffraction peaks matched with BiF3 (JCPDS: 51-0944), indicating that the prepared compounds were single phase and had better crystallinity (Fig. 3). It can be seen from Fig. 3b that the diffraction peaks at 26.34° of Yb3+, Er3+-doped BiF3 had a slight shift compared to BiF3 (JCPDS: 51-0944). The reason should be that the ionic radii of both Er3+ (1.004 Å) and Yb3+ (0.985 Å) are smaller than that of Bi3+ (1.17 Å). In the BiF3 host lattice, the ions (Yb3+, Er3+) could enter the BiF3 crystal site through substituting for the Bi3+ ions or in the interstitial sites or could coexist in these two ways. Different doping methods could make the XRD peaks of the samples prepared at different time shift by different degrees. This indicated that Yb3+ and Er3+ had been doped into the BiF3 matrix.33 The XRD of BiF3:20%Yb3+,0.5%Tm3+/2%Ho3+ showed similar results, as shown in Fig. S5.†
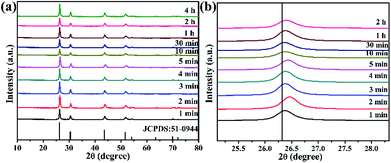 |
| | Fig. 3 (a) XRD patterns of BiF3:2%Er3+/20%Yb3+ NPs obtained at different reaction times, (b) shifts of the main diffraction peaks of BiF3:2%Er3+/20%Yb3+ NPs. | |
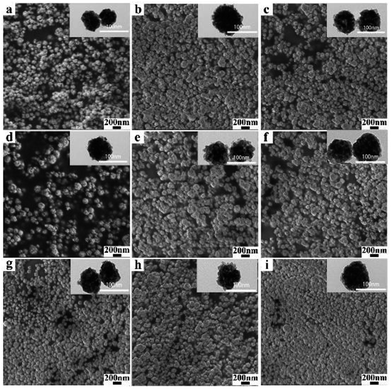 |
| | Fig. 4 SEM and TEM images of BiF3:2%Er3+/20%Yb3+ NPs obtained at different reaction times: (a) 2 min, (b) 3 min, (c) 4 min, (d) 5 min, (e) 10 min, (f) 30 min, (g) 1 h, (h) 2 h, and (i) 4 h. | |
The SEM and TEM images of BiF3:2%Er3+/20%Yb3+ obtained at different reaction times are presented in Fig. 4. It can be clearly observed that there are a large number of well-dispersed NPs with similar morphologies, indicating that the morphologies were almost unchanged even as the time was prolonged, which was confirmed by the TEM images (insets of Fig. 4). In addition, BiF3:20%Yb3+,2%Ho3+/0.5%Tm3+ in Fig. S6 and S7† showed similar results.
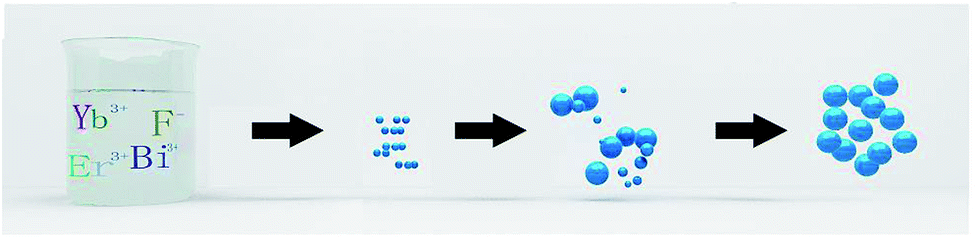
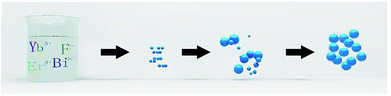
In order to better understand the formation process of BiF3:2%Er3+/20%Yb3+ within 1 min, the growth mechanism was carefully studied by XRD and TEM at different reaction times (5, 30, 50, and 60 s), as shown in Fig. S8† and 5. Some impurity peaks emerged compared with the standard peaks in 5 s (Fig. S8†) and some small particles appeared in the TEM (Fig. 5a), indicating that the crystal nucleus was completed quickly. As the reaction time was further increased, the impurity peaks gradually disappeared (Fig. S8†) and the basic BiF3 spheroids gradually further grew or aggregated (see Fig. 5b and c). These could be deemed as indicating the ripening process of BiF3 NPs, meaning that larger spherical NPs were gradually formed due to the thermodynamic minimization of the surface energies of smaller particles, which is commonly known as Ostwald ripening.34 BiF3:2%Er3+/20%Yb3+ with regular morphologies were formed and the whole system achieved equilibrium when the time was 1 min (Fig. 5d). Meanwhile, XRD patterns were well matched with the pure cubic phase of BiF3 (Fig. S8†). Based on the morphology evolution, the possible growth mechanism is proposed as follows (Scheme 1). First, the precursor was converted to BiF3:2%Er3+/20%Yb3+ nuclei in the nucleation stage. Subsequently, the nuclei grew to rudimental NPs and then underwent the Ostwald ripening process until well-crystallized BiF3 NPs were formed, therefore the process could be described as “Nucleation → Crystallization → Ostwald ripening” (Scheme 1).
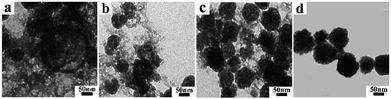 |
| | Fig. 5 TEM images of BiF3:2%Er3+/20%Yb3+ UCNPs obtained at different reaction times: (a) 5 s, (b) 30 s, (c) 50 s, and (d) 1 min. | |
 |
| | Scheme 1 Schematic of the growth mechanism of BiF3:2%Er3+/20%Yb3+. | |
The influence of the temperature on the phase and morphology of BiF3:2%Er3+/20%Yb3+ were also investigated by XRD, SEM, and TEM (Fig. S9† and 6). It could be seen that the XRD spectra of NPs obtained at different temperatures (−25, 0, 30, 50, and 70 °C) matched well with the standard cubic phase (Fig. S9†). No impurities peaks were found in these patterns, indicating these samples had higher purity. However, a few new diffraction peaks appeared at 100 °C, indicating that the pure cubic phase of BiF3:2%Er3+/20%Yb3+ NPs tended to be formed at a lower temperature. Meanwhile, SEM images of BiF3:2%Er3+/20%Yb3+ NPs synthesized at different temperatures, sizes, and morphologies also showed no obvious changes, except that they became irregular at 100 °C (Fig. S9† and 6f). The corresponding TEM images are shown in Fig. 6g–l, in which the results were in good agreement with the XRD results. From the above analysis, it could be concluded that the regular BiF3:2%Er3+/20%Yb3+ NPs could be formed at lower temperature under co-precipitation conditions.
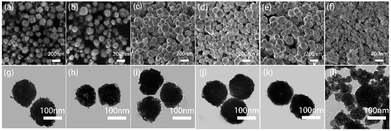 |
| | Fig. 6 SEM and TEM images of BiF3:20%Yb3+/2%Er3+ NPs obtained at different temperatures: (a and g) −25 °C, (b and h) 0 °C, (c and i) 30 °C, (d and j) 50 °C, (e and k) 70 °C, and (f and l) 100 °C. | |
3.2 UCL of BiF3:Ln3+(Ln = Ho, Er, Tm)/Yb3+
3.2.1 Effect of calcination temperature on the stability of UCL. Fig. S10† presents the UCL spectra of BiF3:2%Er3+/20%Yb3+ excited at 980 nm for different times. It can be seen that when prepared without calcination, its emission intensity gradually increased with prolonging the irradiation time (Fig. S10a†) and reached the maximal value in 7 min. Similarly, the variation trend of the UCL intensity of BiF3:2%Er3+/20%Yb3+ annealed at 50 °C was the same as that without calcination (Fig. S10b†). However, the UCL intensity did not change with increasing irradiation time when it was annealed at 100 °C, 200 °C, or 400 °C (Fig. S10c–e†). The reason for this might be that there was a large amount of hydroxyl groups (OH) on the sample's surface before calcination or certain temperature, which could increase the non-radiative relaxation rate and decrease the luminescence efficiency.35 The results could be further confirmed by FT-IR and XRD studies of BiF3:2%Er3+/20%Yb3+ before and after calcination. The XRD patterns and FT-IR spectra of BiF3:2%Er3+/20%Yb3+ NPs at different calcination temperatures were recorded, as shown in Fig. S11† and 7. The diffraction peaks were matched with a cubic phase of BiF3, except when annealed at 400 °C in Fig. S11.† The reason might be that the temperature reached its phase inversion temperature and then the crystalline phase began to change. The morphologies of samples calcined at different temperatures were also analyzed, as shown in Fig. S12.† From the figure, we can clearly see that the morphology of calcined samples became irregular when the calcination temperature was 400 °C. This result was consistent with the XRD results. According to the FT-IR spectra measured for the calcinated NPs (Fig. 7), the intensity of the characteristic peaks changed. The band at 552 cm−1 arose from the vibration mode of Bi–F, which showed almost no change, but then changed at 400 °C to form another phase. The band approximately at 3388 cm−1 and 1650 cm−1 ascribed to O–H and some organic molecular decreased with the rising calcination temperature. The enhancement of UCL intensity might be caused by the reduction in the number of OH groups35 and in the organic component. This was in agreement with the result of TG-DSC. BiF3:2%Er3+/20%Yb3+ treated at 200 °C was used for the following investigation on UCL.
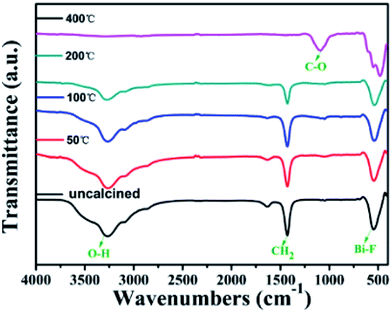 |
| | Fig. 7 FT-IR spectra of BiF3:2%Er3+/20%Yb3+ calcinated at different temperatures. | |
3.2.2 Investigation on UCL mechanism. The UC emission spectra of BiF3:Ln3+ (Ln = Tm, Er, Ho)/Yb3+ NPs irradiated at 980 nm were measured and the corresponding results are given in Fig. 8a. It could be seen that there were three different colors. To better understand the mechanism of every UCL, the variation of UCL intensities with pump power density was measured (Fig. 8b–d). It is well known that the relationship between the pump power density (P) and luminescence intensity (I) is I = Pn, by which information of the n photons in the UCL process can be provided.36 As presented in Fig. 8b, the slopes for the 526, 547, and 656 nm bands were 1.45, 1.57, and 1.49, respectively, showing a two-photon absorption process for the BiF3:2%Er3+/20%Yb3+ NPs. As presented in Fig. 8c, the slopes were 1.87 and 1.61 for Ho3+ ion, meaning a two-photon process for BiF3:2%Ho3+/20%Yb3+ NPs. The slopes for BiF3:0.5%Tm3+/20%Yb3+ NPs were 1.97, 2.50, and 2.60, corresponding to two-photon (red NIR) and three photon (red and blue) energy-transfer processes in Fig. 8d.
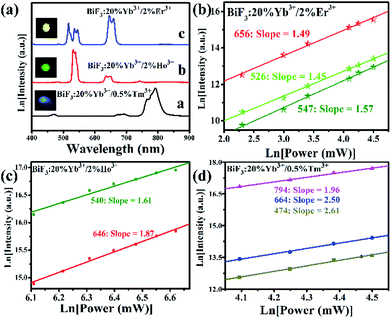 |
| | Fig. 8 (a) UC emission spectra and corresponding luminescence photographs, (b–d) pump power dependence of blue, green, red, and NIR UCL emission intensities in BiF3:Ln3+ NPs excited at 980 nm. | |
The possible UCL mechanism of Yb3+, Er3+, Ho3+, and Tm3+ ions are shown in Fig. S13.† For BiF3:2%Er3+/20%Yb3+ NPs, the Yb3+ ion absorbs a photon and is excited to 2F5/2, then drops back to the ground state and transfers the energy to a nearby Er3+ ion to populate the 4I11/2. The Yb3+ can then transfer the second photon to populate the 4F7/2 and relax to 2H11/2 or 4S3/2 levels non-radiatively. Through non-radiative relaxation, the 4I11/2 level can also relax to the 4I13/2 level and after that a transferred photon from Yb3+ ions can populate the 4F9/2. Red emission is transmitted through 4F9/2 → 4I15/2 of Er3+, as shown in Fig. S13a.† The red and blue emissions of BiF3:20%Yb3+/0.5%Tm3+ NPs could be confirmed as a three-photon process, as shown in Fig. S13b.† The 1G4 level could be populated by a three-step energy transfer of Yb3+ through 3H4 and 3F4. From the transitions of 1G4 → 3F4, 3H4 → 3H6 and 1G4 → 3H6, red, NIR, and blue emissions of Tm3+ could be obtained, respectively. As for BiF3:20%Yb3+/2%Ho3+ NPs, red emission through the bridge of the 5I7 level was pumped to the 5F5 level and the green emission was then a two-photon process (Fig. S13b†).18
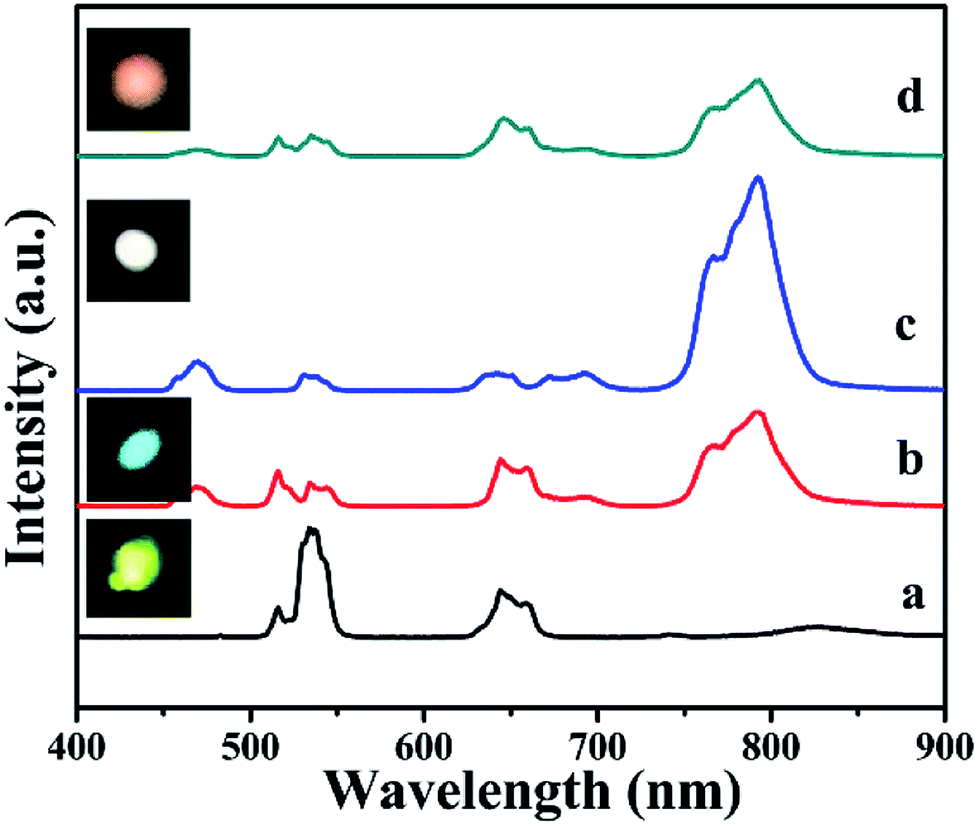
3.2.3 Multicolor tuning and bright white emission. In order to expand those UCNPs potential applications, the bright white and multicolor UCL has been studied. To get multicolor emission, such as bright white emission, the concentrations of Er3+, Ho3+, and Tm3+ ions could be properly adjusted, in which different samples were obtained (Table S1†). The bright yellow green, pinkish, bright white, and bluish white UCL emissive spectra and photographs are shown in Fig. 9, which agreed well with the results of the color coordinate in Fig. S14.† Those results indicated that BiF3 nanomaterials have potential applications as backlight sources in color displays and security labeling.
 |
| | Fig. 9 UCL emissive spectra and corresponding luminescence photographs of: (a) BiF3:20%Yb3+/1%Er3+/0.15%Ho3+, (b) BiF3:20%Yb3+/1%Er3+/0.5%Tm3+, (c) BiF3:20%Yb3+/0.5%Tm3+/0.15%Ho3+, (d) BiF3:20%Yb3+/1%Er3+/0.5%Tm3+/0.15%Ho3+ NPs excited at 980 nm. | |
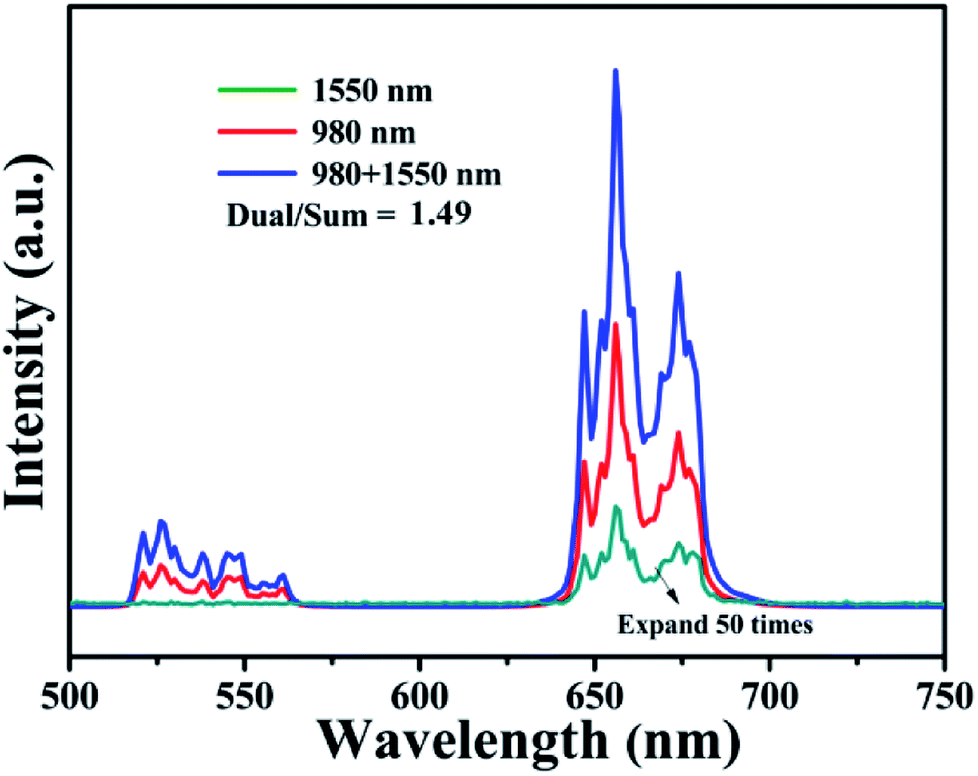
3.2.4 Performance of UCL under dual-wavelength excitation (1550 nm and 980 nm). It was necessary to investigate the UC process with dual-wavelength excitation, which is considered as potentially a convenient way to improve the efficiency of power conversion in next-generation solar cells.37–39 According to Fig. 10, the ratio of green/red emission intensities was similar. Under dual-excitation at 1550 nm and 980 nm, the intensity of UCL was greater than the sum of the intensities at 1550 nm and 980 nm, respectively. It was 1.49 times the sum of the separate single wavelength excitations, indicating there was a dual-wavelength synergistic effect in this system.40,41
 |
| | Fig. 10 UC emission spectra of BiF3:2%Er3+/20%Yb3+ under 980 nm, 1550 nm, or simultaneous dual-wavelength (1550 nm and 980 nm) excitation (P1550 = P980 = 100 mW). | |
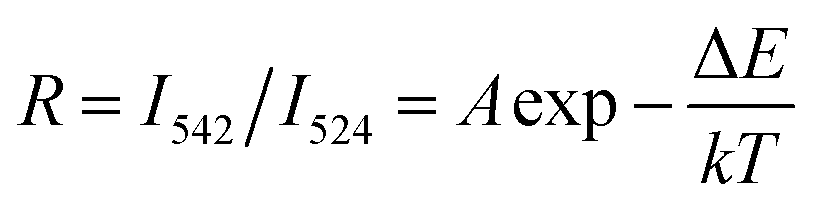
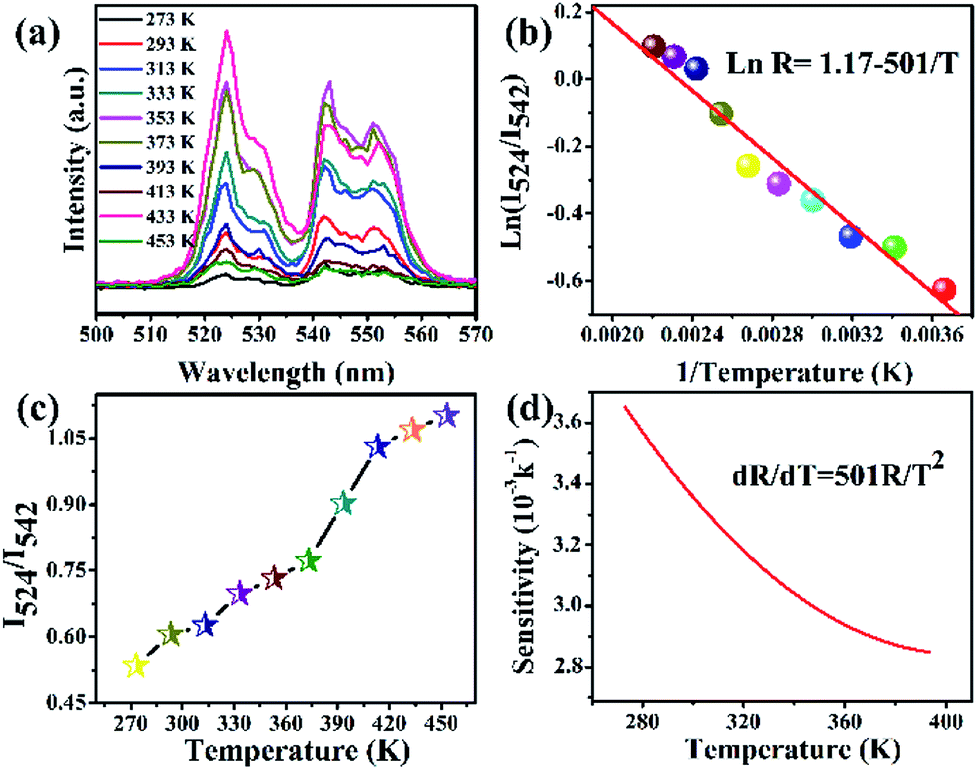
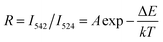
3.2.5 Thermometric property of BiF3:2%Er3+/20%Yb3+ NPs. It was well known that the change of the transitions of 2H11/2 → 4I15/2 (524 nm) and 4S3/2 → 4I15/2 (542 nm) at different temperatures owing to 2H11/2 and 4S3/2 levels were related to the thermal coupling of Er3+ ion. The ratio (R) of emission intensities at 524 nm and 542 nm followed the formula based on the Boltzmann distribution theory:42–44| |
 | (1) |
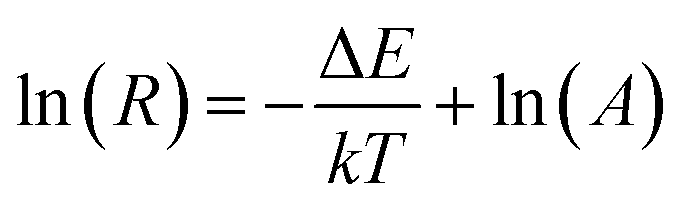
where A is the proportionality constant, ΔE is the energy gap between 2H11/2 and 4S3/2 levels, T is the absolute temperature, and k is the Boltzmann's constant. Eqn (1) could also be expressed as:| |
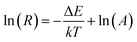 | (2) |
Fig. 11a presents the UC emission spectra of BiF3:2%Er3+/20%Yb3+ excited at 980 nm with various temperatures. For green (524 nm and 542 nm) emissions, the UC emission intensities changed with increasing temperature. Fig. 11b presents a plot of 1/T versus ln(R), in which the slope (−ΔE/k) is equal to −501 and the intercept is 1.17. It could be also seen from Fig. 11c that R increased with the increasing temperature and presented a certain rule. In addition, the sensor sensitivity is another very important factor. The sensor sensitivity (S) can be calculated by using the following formula:45–48
| |
 | (3) |
 |
| | Fig. 11 (a) Green UC emission spectra of BiF3:2%Er3+/20%Yb3+ UCNPs in the temperature range of 273–453 K, (b) plot of ln(R) versus 1/T. (c) R values of green emissions intensities at different temperatures, (d) relative sensitivity. | |
It was noteworthy that the sensitivity exhibited a downward tendency with the increasing temperature from 273 K to 453 K and its max value was about 0.0036 K−1 at 273 K (Fig. 11d), suggesting that the BiF3:2%Er3+/20%Yb3+ NPs had a certain thermometric property, which might be employed as a temperature sensor.
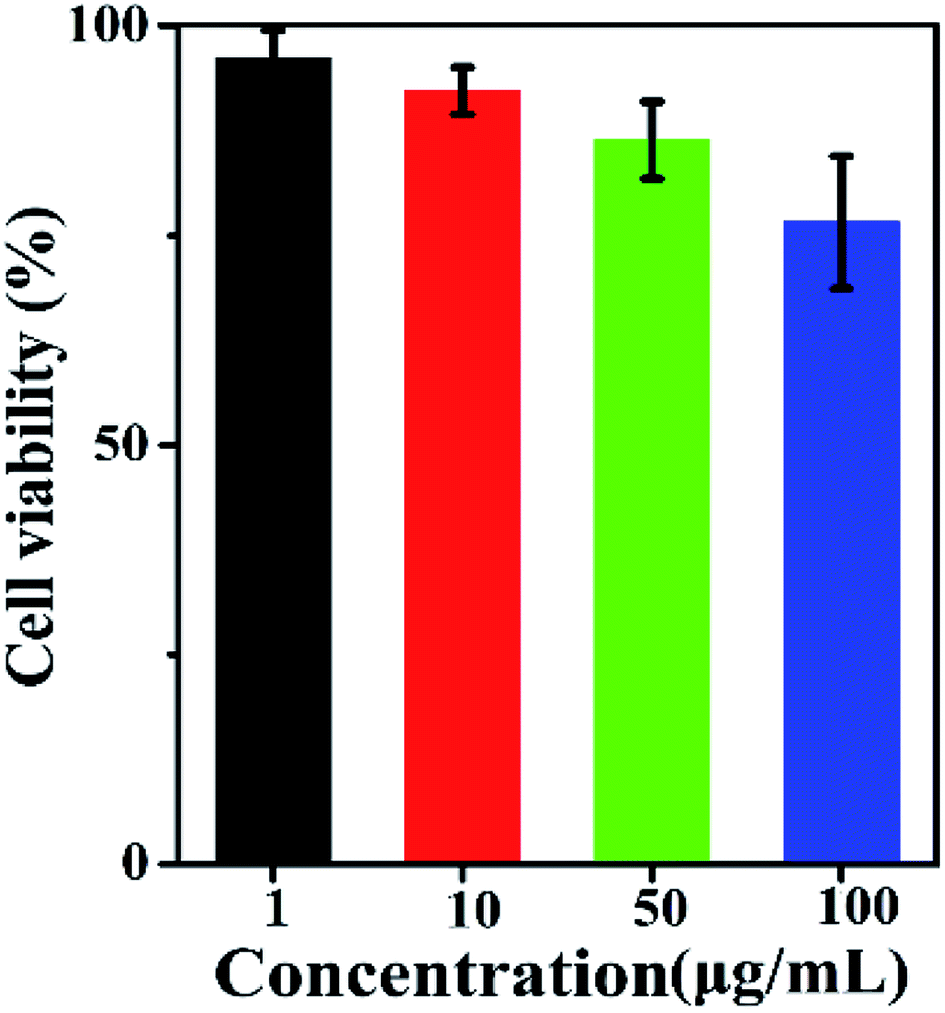
3.2.6 Cell toxicity test. In order to evaluate the potential biosafety, cytotoxicity tests must be investigated.49,50 As illustrated in Fig. 12, the cytotoxicity of a NPs phospholipid aqueous solution with different concentrations was assessed by CCK-8 assay under 5% CO2 at 37 °C for 24 h. The viability of the B16-F10 cells decreased to 90% at a density of 1 μg mL−1. When the concentration varied from 50 μg mL−1 to 100 μg mL−1, the cellular viability of B16-F10 cells decreased to 82%, indicating that the UCNPs phospholipid aqueous solution presented lower cytotoxicity.
 |
| | Fig. 12 Cell viability of B16-F10 cells incubated with different concentrations of BiF3:2%Er3+/20%Yb3+ phospholipid aqueous solution. | |
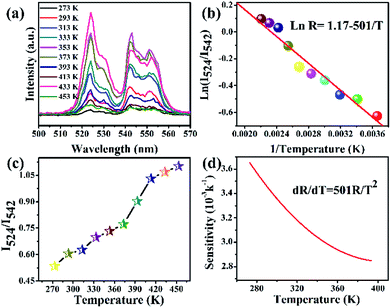
3.2.7 In vivo imaging. 100 μL BiF3:2%Er3+/20%Yb3+ UCNPs phospholipid aqueous solution (100 μg mL−1) was injected into a Kunming mouse subcutaneously or intraperitoneally for deeper tissue imaging. In a comparative experiment, the luminous point on a Kunming mouse without treatment with NPs by exciting at 980 nm could not be observed with UCL (Fig. 13a and b). On the other hand, after intraperitoneal and subcutaneous injection in the corresponding area (100 μL, 100 μg mL−1), yellow UCL could be observed in dark upon the excitation at 980 nm laser (Fig. 13c and d). These indicated that UCNPs had a high contrast and deep penetration for in vivo optical bioimaging, which could be used as probe.5
 |
| | Fig. 13 In vivo UC imaging of a Kunming mouse: (a and b) without injection of UCNPs, (c) subcutaneous injection, and (d) intraperitoneal injection of UCNPs [100 μL (100 μg mL−1) for c and d]. | |
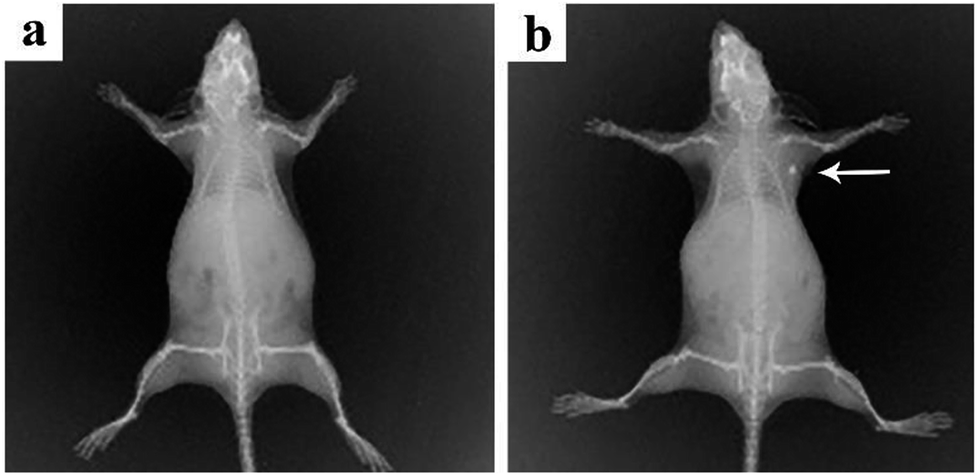
3.2.8 In vivo X-ray imaging. A certain amount of BiF3:2%Er3+/20%Yb3+ (200 μL, 100 μg mL−1) UCNPs phospholipid aqueous solution was injected subcutaneously in a Kunming mouse for X-ray imaging. Obvious X-ray signals marked by a white arrow could be observed for the Kunming mouse injected with NPs (Fig. 14b) compared to non-injection (Fig. 14a). It has been proven that they can absorb X-rays. The results showed that they could be utilized as X-ray imaging contrast agents.
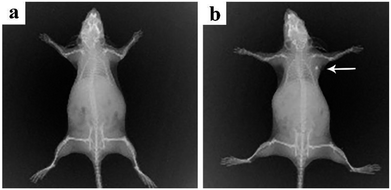 |
| | Fig. 14 In vivo X-ray imaging of a Kunming mouse before (a) and after (b) subcutaneous injection of 200 μL of BiF3:2%Er3+/20%Yb3+ NPs. | |
4. Conclusions
In summary, multi-functional BiF3 UCNPs were successfully synthesized by a facile co-precipitation method, both below and above room temperature (−25 °C, 100 °C). The growth mechanism indicated that the obtained BiF3 NPs were formed through the growth process of “Nucleation → Crystallization → Ostwald ripening”. Fluorescence intensity ratio technology was used to investigate the temperature sensitivity of BiF3:2%Er3+/20%Yb3+ and the max sensitivity was found to be 0.0036 K−1 at 273 K. The integrated emission of BiF3:2%Er3+/20%Yb3+ NPs excited by dual-wavelength simultaneously was 1.49 times more than that excited by two single wavelengths (1550 nm and 980 nm), respectively. Multicolor and bright white light could be obtained upon excitation at 980 nm by modulating the content of Ho3+, Er3+, and Tm3+, by which they might be used as security labeling and backlight sources for color displays. The low cytotoxicity of BiF3:2%Er3+/20%Yb3+ was confirmed by cell toxicity tests with phospholipid aqueous solution. BiF3:2%Er3+/20%Yb3+ NPs presented better properties of penetration and contrast in the in vivo imaging and X-ray imaging tests, indicating that they could be used as potential probe and contrast agents in in vivo optical bioimaging.
Live subject statement
All animal procedures were performed in accordance with the Guidelines for Care and Use of Laboratory Animals of Zhengzhou University and experiments were approved by the Animal Ethics Committee of Henan Laboratory Animal Center.
Conflicts of interest
There are no conflicts to declare.
Acknowledgements
The authors gratefully acknowledge Chinese Academy of Sciences (Grants XDA09030203), the NSFH (142300410223) for their financial support.
References
- Z. W. Wei, L. N. Sun, J. L. Liu, J. Z. Zhang, H. R. Yang, Y. Yang and L. Y. Shi, Biomaterials, 2014, 35, 387–392 CrossRef CAS PubMed.
- L. Y. Zeng, Y. W. Pan, R. F. Zou, J. C. Zhang, Y. Tian, Z. G. Teng, S. J. Wang, W. Z. Ren, X. S. Xiao, J. C. Zhang, L. L. Zhang, A. G. Li, G. M. Lu and A. G. Wu, Biomaterials, 2016, 103, 116–127 CrossRef CAS PubMed.
- Z. M. Deng, X. L. Li, Z. L. Xue, M. Y. Jiang, Y. B. Li, S. J. Zeng and H. R. Liu, Nanoscale, 2018, 10, 9393–9400 RSC.
- Z. L. Xue, Z. G. Yi, X. L. Li, Y. B. Li, M. Y. Jiang, H. R. Liu and S. J. Zeng, Biomaterials, 2017, 115, 90–103 CrossRef CAS PubMed.
- S. J. Zeng, Z. G. Yi, W. Lu, C. Qian, H. B. Wang, L. Rao, T. M. Zeng, H. R. Liu, H. J. Liu, B. Fei and J. H. Hao, Adv. Funct. Mater., 2014, 24, 4051–4059 CrossRef CAS.
- X. L. Li, Z. G. Yi, Z. L. Xue, S. J. Zeng and H. R. Liu, Mater. Sci. Eng., C, 2017, 75, 510–516 CrossRef CAS PubMed.
- J. Zhou, Z. G. Lu, G. G. Shan, S. H. Wang and Y. Liao, Biomaterials, 2014, 35, 368–377 CrossRef CAS PubMed.
- F. Wang and X. G. Liu, J. Am. Chem. Soc., 2008, 130, 5642–5643 CrossRef CAS PubMed.
- P. Huang, W. Zheng, S. Y. Zhou, D. T. Tu, Z. Chen, H. M. Zhu, R. F. Li, E. Ma, M. D. Huang and X. Y. Chen, Angew. Chem., Int. Ed., 2014, 53, 1252–1257 CrossRef CAS PubMed.
- M. Nyk, R. Kumar, T. Y. Ohulchanskyy, E. J. Bergey and P. N. Prasad, Nano Lett., 2008, 8, 3834–3838 CrossRef CAS PubMed.
- H. H. Gorris and O. S. Wolfbeis, Angew. Chem., Int. Ed., 2013, 52, 3584–3600 CrossRef CAS PubMed.
- J. Zhou, Q. Liu, W. Feng, Y. Sun and F. Y. Li, Chem. Rev., 2014, 115, 395–465 CrossRef PubMed.
- G. F. Wang, Q. Peng and Y. D. Li, J. Am. Chem. Soc., 2009, 131, 14200–14201 CrossRef CAS PubMed.
- P. P. Lei, R. An, X. S. Zhai, S. Yao, L. L. Dong, X. Xu, K. M. Du, M. L. Zhang, J. Feng and H. J. Zhang, J. Mater. Chem. C, 2012, 18, 1580 Search PubMed.
- G. Tian, Z. J. Gu, L. J. Zhou, W. Y. Yin, X. X. Liu, L. Yan, S. Jin, W. L. Ren, G. M. Xing, S. J. Li and Y. L. Zhao, Adv. Mater., 2012, 24, 1226–1231 CrossRef CAS PubMed.
- Z. X. Zhang, R. F. Cao, L. N. Guo, P. Li, C. X. Liang and T. S. Li, New J. Chem., 2018, 42, 15215–15220 RSC.
- E. M. Chan, Chem. Soc. Rev., 2015, 44, 1653–1679 RSC.
- Z. Wang, J. Feng, M. Pang, S. h. Pan and H. J. Zhang, Dalton Trans., 2013, 42, 12101–12108 RSC.
- N. S. Singh, N. K. Sahu and D. Bahadur, J. Mater. Chem. C, 2014, 2, 548–555 RSC.
- X. Lu, M. Yang, L. Y. Yang, Q. L. Ma, X. T. Dong and J. Tian, J. Mater. Sci.: Mater. Med., 2015, 26, 4078–4084 CAS.
- Z. Yin, H. Li, W. Xu, S. B. Cui, D. L. Zhou, X. Chen, Y. S. Zhu, G. S. Qin and H. W. Song, Adv. Mater., 2016, 28, 2518–2525 CrossRef CAS PubMed.
- P. P. Lei, P. Zhang, Q. H. Yuan, Z. Wang, L. L. Dong, S. Y. Song, X. Xu, X. L. Liu, J. Feng and H. J. Zhang, ACS Appl. Mater. Interfaces, 2015, 7, 26346–26354 CrossRef CAS PubMed.
- H. X. Mai, Y. W. Zhang, R. Si, Z. G. Yan, L. D. Sun, L. P. You and C. H. Yan, J. Am. Chem. Soc., 2006, 128, 6426–6436 CrossRef CAS PubMed.
- X. Teng, Y. H. Zhu, W. Wei, S. C. Wang, J. F. Huang, R. Naccache, W. B. Hu, A. L. Y. Tok, Y. Han, Q. C. Zhang, Q. L. Fan, W. Huang, J. A. Capobianco and L. Huang, J. Am. Chem. Soc., 2012, 134, 8340–8343 CrossRef CAS PubMed.
- Q. Liu, Y. Sun, T. S. Yang, W. Feng, C. G. Li and F. Y. Li, J. Am. Chem. Soc., 2011, 133, 17122–17125 CrossRef CAS PubMed.
- S. Sarkar, A. Dash and V. Mahalingam, Chem.–Asian J., 2014, 9, 447–451 CrossRef CAS PubMed.
- X. L. Wu, L. G. Xu, W. Ma, L. Q. Liu, H. Kuang, N. A. Kotov and C. L. Xu, Adv. Mater., 2016, 28, 5907–5915 CrossRef CAS PubMed.
- P. P. Lei, R. An, S. Yao, Q. S. Wang, L. L. Dong, X. Xu, K. M. Du, J. Feng and H. J. Zhang, Adv. Mater., 2017, 29, 1700505 CrossRef PubMed.
- P. Du, L. H. Luo, X. Y. Huang and J. S. Yu, J. Colloid Interface Sci., 2018, 514, 172–181 CrossRef CAS PubMed.
- P. Du and J. S. Yu, Microchim. Acta, 2018, 185, 237 CrossRef PubMed.
- P. Li, L. N. Guo, Z. X. Zhang, T. S. Li and P. L. Chen, Dyes Pigm., 2018, 154, 242–251 CrossRef CAS.
- B. H. Wang, Y. X. Zhai, J. J. Shi, L. Y. Zhuang, W. Liu, H. J. Zhang, H. L. Zhang and Z. Z. Zhang, J. Controlled Release, 2017, 268, 225–236 CrossRef CAS PubMed.
- P. Li, L. N. Guo, C. X. Liang, T. S. Li and P. L. Chen, Mater. Sci. Eng., B, 2018, 229, 20–26 CrossRef CAS.
- A. M. Li, D. K. Xu, H. Lin, S. H. Yang, Y. Z. Shao and Y. L. Zhang, Sci. Rep., 2016, 6, 31366 CrossRef CAS PubMed.
- L. N. Guo, Y. H. Wang, Y. Z. Wang, J. Zhang, P. Y. Dong and W. Zeng, Nanoscale, 2013, 5, 2491–2504 RSC.
- C. X. Liang, L. N. Guo, P. Li, T. S. Li, P. L. Chen, M. H. Liu and Y. J. Wu, J. Alloys Compd., 2017, 715, 37–42 CrossRef CAS.
- P. Chen, S. L. Yu, B. B. Xu, J. C. Wang, X. W. Sang, X. F. Liu and J. R. Qiu, Mater. Lett., 2014, 128, 299–302 CrossRef CAS.
- J. J. Zhou, J. Y. Deng, H. M. Zhu, X. Y. Chen, Y. Teng, H. Jia, S. Q. Xu and J. R. Qiu, J. Mater. Chem. C, 2013, 1, 8023–8027 RSC.
- Z. Chen, G. B. Wu, H. Jia, K. Sharafudeen, W. B. Dai, X. W. Zhang, S. F. Zeng, J. M. Liu, R. F. Wei, S. C. Lv, G. P. Dong and J. R. Qiu, J. Phys. Chem. C, 2015, 119, 24056–24061 CrossRef CAS.
- Z. Chen, X. W. Zhang, S. F. Zeng, Z. J. Liu, Z. J. Ma, G. P. Dong, S. F. Zhou, X. F. Liu and J. R. Qiu, Appl. Phys. Express, 2015, 8, 032301 CrossRef CAS.
- Y. H. Yao, C. Xu, Y. Zheng, C. S. Yang, P. Liu, J. X. Ding, T. Q. Jia, J. R. Qiu, S. A. Zhang and Z. R. Sun, RSC Adv., 2016, 6, 3440–3445 RSC.
- D. He, C. F. Guo, S. Jiang, N. M. Zhang, C. K. Duan, M. Yin and T. Li, RSC Adv., 2015, 5, 1385–1390 RSC.
- C. D. S. Brites, X. J. Xie, M. L. Debasu, X. Qin, R. F. Chen, W. Huang, J. Rocha, X. G. Liu and L. D. Carlos, Nat. Nanotechnol., 2016, 11, 851 CrossRef CAS PubMed.
- G. Y. Zhang, Q. P. Qiang, S. S. Du and Y. H. Wang, RSC Adv., 2018, 8, 9512–9518 RSC.
- W. Yu, W. Xu, H. W. Song and S. Zhang, Dalton Trans., 2014, 43, 6139–6147 RSC.
- J. Zhang, B. W. Ji, G. B. Chen and Z. H. Hua, Inorg. Chem., 2018, 57, 5038–5047 CrossRef CAS PubMed.
- J. Zhang, X. M. Jiang and Z. H. Hua, Ind. Eng. Chem. Res., 2018, 57, 7507–7515 CrossRef CAS.
- P. Li, L. N. Guo, C. X. Liang, T. S. Li, P. L. Chen, M. H. Liu and Y. J. Wu, RSC Adv., 2017, 7, 51233–51244 RSC.
- D. M. Yang, Y. L. Dai, J. H. Liu, Y. Zhou, Y. Y. Chen, C. X. Li, P. A. Ma and J. Lin, Biomaterials, 2014, 35, 2011–2023 CrossRef CAS PubMed.
- P. Ramasamy, P. Chandra, S. W. Rhee and J. Kim, Nanoscale, 2013, 5, 8711–8717 RSC.
Footnote |
| † Electronic supplementary information (ESI) available. See DOI: 10.1039/c9ra01018a |
|
| This journal is © The Royal Society of Chemistry 2019 |
Click here to see how this site uses Cookies. View our privacy policy here. 
 Open Access Article
 This Open Access Article is licensed under a
  *a,
Linna Guo
*a,
Linna Guo