 Open Access Article
The enhancement of the D–A effect of an asymmetric Schiff base by introducing acetyl groups into diaminomaleonitrile: synthesis, red fluorescence and crystal structure†
Ke Wang,
Hao Su,
Pengfei Wang,
Wenjie Wang and
Hui Li *
*
Key Laboratory of Cluster Science of Ministry of Education, School of Chemistry and Chemical Engineering, Beijing Institute of Technology, Beijing 100081, P. R. China. E-mail: lihui@bit.edu.cn
First published on 8th May 2019
Abstract
An asymmetrical salen-type organic ligand was designed and synthesized by a new strategy developed using a precursor Ac-DMN, which is a diaminomaleonitrile (DMN) incorporated with an acetyl group. In this study, two types of asymmetrical ligands, namely Ac-DMN-salicylaldehyde (L0) and Ac-DMN-4-N,N-diethyl-salicylaldehyde (L1), and their Zn(II) coordination complexes were studied. With the electron-pushing substituent, L1 showed interesting photoluminescence behaviour distinct from that of L0. In a THF solution, the maximum fluorescence emission of L1 red-shifted to 90 nm compared with that of L0. Furthermore, in a THF–H2O solution, L1 exhibited aggregation-induced emission (AIE), but L0 exhibited aggregation-caused quenching (ACQ). Upon coordination with Zn(II), the maximum emission wavelengths in THF for both the ligands were red-shifted to 100 nm and 105 nm, respectively. The crystalline solid-state photoluminescence properties were studied based on the single-crystal structural analysis.
Introduction
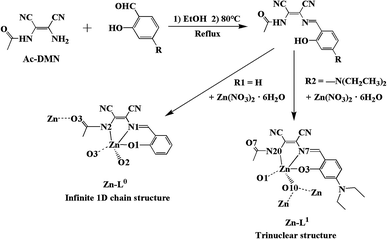
The study of asymmetric Schiff bases has been an active research field relative to functional materials and catalysis for a long time since they generally exhibit unusual structures and properties. In order to fabricate a variety of new functional materials for their use as catalysts, exploring new asymmetric Schiff bases is still a challenge for chemists. Asymmetric Schiff bases with electron-donating and accepting structural units (D–A) possess a special optical character.1 Therefore, the photoluminescence properties of these kinds of organic molecules as well as their coordination compounds have drawn increasing attention in recent years. This effect of push and pull electrons triggers intramolecular charge transfer (ICT), which is a satisfactory approach to increase the luminance of compounds.2 For the aggregation of luminescent molecules, a new phenomenon called aggregation-induced emission (AIE) has been found based on the different molecular configurations, accumulation and interactions, which overturn the concept of aggregation-caused quenching (ACQ). In general, the photoluminescence of AIE luminescent materials does not weaken neither in solution nor in solid state via restricting the intramolecular rotation (RIR), so it can be applied in liquid or solid phase.3 Clearly, such materials are crucial for chemosensors, photoelectric devices, organic light-emitting diodes (OLEDs), photoluminescence probes and cell imaging.4 Diaminomaleonitrile (DMN) molecules have excellent rigidity and planarity.5 DMN-type Schiff bases are often used in AIE luminescent materials.6 However, most of the DMN-type Schiff bases are symmetrical structures, and the reports about asymmetric structures are rare. The main challenge in the synthesis of an asymmetric Schiff base is how to control target products and avoid symmetrical by-products.7 Therefore, it is very meaningful to explore a reliable asymmetric synthesis method. In preceding studies by our group, we have synthesized symmetric DMN-Schiff bases (2013).8 In 2017, a new asymmetric D–A type Schiff base was obtained by a novel, controllable method developed in our laboratory for the synthesis of asymmetric compounds.9In this study, we focused on the enhancement of the D–A function of the asymmetric DMN-Schiff bases. It is the first example of introducing acetyl groups into the asymmetric DMN-Schiff bases. Combining with the electron-pulling of the acetyl group, the electron-pushing group N,N-diethyl has been incorporated in the salicylaldehyde side of asymmetric DMN-Schiff bases. Two kinds of new ligands were designed and synthesized, which are N-((Z)-1,2-dicyano-2-((E)-(2-hydroxybenzylidene)amino)vinyl)acetamide (L0) and N-((Z)-1,2-dicyano-2-((E)-(4-(diethylamino)-2-hydroxybenzylidene)amino)vinyl)acetamide (L1) (Scheme 1). Their Zn(II) coordination compounds Zn-L0 and Zn-L1 were also obtained. The photoluminescence properties of L0, L1, Zn-L0 and Zn-L1 in the solution and solid state were studied. The substituent group on 4-substitution of L1 is N,N-diethyl that has higher activity, the introduction of which could form a D–A structure with an acetyl group. The L0 with salicylaldehyde unit was used to compare with L1 for studying the influence of D–A structure to photoluminescence properties and compounds conformation that could be seen from the crystal structures with the same of the central metal. In addition, with the introduction of an electron-pushing group, the luminescence of the complex changed from ACQ to AIE, and the solid photoluminescence changed from quenched to orange with red-shifting. These phenomena were explained by enhanced ICT. The experimental results indicate the conception of precise regulation and control, and this design idea can be applied to further research.
Result and discussion
Synthesis and characterization
The loading acetyl group of DMN (Ac-DMN) was used as a precursor for the synthesis of asymmetric DMN-Schiff bases. The functions of Ac-DMN are not only providing electron-pulling but also offering coordination ability to metal ions and inter- or intramolecular hydrogen bonding interactions. The precursor Ac-DMN was synthesized by the reaction of acetyl chloride with DMN in an ice-water bath. Ligands L0 and L1 were synthesized by a reflux method, in which salicylaldehyde and 4-(diethylamino)salicylaldehyde were added to the precursor Ac-DMN ethanol solution, respectively, to synthesize L0 and L1. The structures of L0 and L1 were confirmed using 1H NMR, 13C NMR, mass spectra, FT-IR, and elemental analyses. Especially, the single crystal structure of L1 was analyzed using X-ray single-crystal diffraction method. Moreover, the crystals of Zn-L0 and Zn-L1 were fostered in methanol and acetonitrile solution by volatilizing at room temperature. The details about synthesis and characterization of the precursor, L0, L1, Zn-L0 and Zn-L1 could be found in ESI.†Thermal properties
Thermogravimetric analysis (TGA) showed the decomposition temperatures of L0 and L1 to be 263 °C and 278 °C and coordination compounds to be 427 °C and 310 °C, respectively, in a nitrogen atmosphere (Fig. S1 and S2†). The curves exhibit the weight loss process. The results indicated that desirable thermal stability of compounds were important to luminance materials. Remarkably, L1 as an excellent photoluminescence material showed expected stability in a solution with pH values ranging from 3 to 8 by immersing in it for one day. The results can be confirmed by the PXRD spectra (Fig. S3†). When the pH value was less than 3 or greater than 8, the coordination polymer was dissolved in an aqueous solution. As a result, this material can be used in acidic and weakly alkaline environments. In addition, the material was insoluble in water that could be applied to aqueous solution systems.Solution fluorescent properties
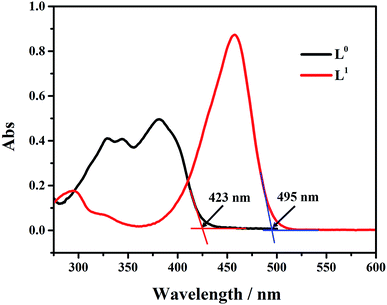
The UV absorption curves of L0 and L1 in THF solution are shown in Fig. 1. The absorption peaks of L0 were observed at 325 nm, 335 nm, and 378 nm. The peak at 325 nm was attributed to the phenol group impacted by the solution resulting in the red shift. The maximum absorption peak was located at 378 nm. L1 had two absorption peaks at 296 nm and 454 nm. The absorption peak at 296 nm could be attributed to N,N-diethyl group in the benzene ring. The peak at 454 nm was attributed to ICT that resulted in the red-shift. The absorption edges of L0 and L1 appeared at about 423 nm and 495 nm, respectively, from which we could calculate the band gap to be 2.93 eV and 2.51 eV. It is clear that by introducing the N,N-diethyl group, the band gap reduced observably that is good for electron transitions and to improve photoluminescence properties.To further understand the electron distribution in molecules of L0 and L1, DFT calculations were operated using Gaussian 03 at the B3LYP/6-31G(d) level. By the DFT calculation, the orbital distribution could be seen more intuitively. In L0, the highest occupied molecular orbital (HOMO) isosurface was mainly distributed on benzene ring and carbon–carbon double bond, and the lowest unoccupied molecular orbital (LUMO) isosurface was mainly located around the N of the DMN skeleton. When excited by 420 nm ultraviolet light, the electrons absorbed energy and jumped from the ground state to the excited state, and the electrons that absorbed energy moved from HOMO to LUMO. It could be seen that the electron cloud in L0 was evenly distributed on the molecule. The contribution of the excited electron transition energy from HOMO−2 to LUMO of S3 state was the highest (94%), following S1 state electrons energy in HOMO-to-LUMO transition (80%). Moreover, the DFT calculation could explain the attribution of the peaks in the ultraviolet spectra. The peak at 325 nm was caused by electron transition from HOMO−2 to LUMO level, the peak at 335 nm was ascribed to the transition from HOMO−1 to LUMO, and the peak at 378 nm was assigned to the HOMO-to-LUMO transition. In L1, the HOMO isosurface was spread over N,N-diethyl and benzene ring affected by the introduction of electron-pushing group, and the LUMO isosurface was mainly located around DMN and around the acetyl group, which made possible for electrons absorbing energy to jump from HOMO to LUMO triggered the significant transfer of electrons crossing the molecule. The HOMO-to-LUMO electron transition of S1 absorbed the most energy (94%) and led to the highest intensity peak in the UV spectrum at 454 nm. The distribution of the electron clouds of each energy level are shown in Table S1 and S2.† The band gaps calculated by DFT were 3.40 eV and 3.13 eV respectively (Fig. 2), which were higher than 2.93 eV and 2.51 eV calculated by absorption edge wavelength in THF solution, which indicated that THF had certain effect of reducing the band gap.10 In the THF solution, the molecules interacted with THF to reduce the band gap, resulting in red shift. Both of them indicate that the band gap decreases with the introduction of the electron group, which is more conducive to the electron transition and improves the photoluminescent properties of the compound.
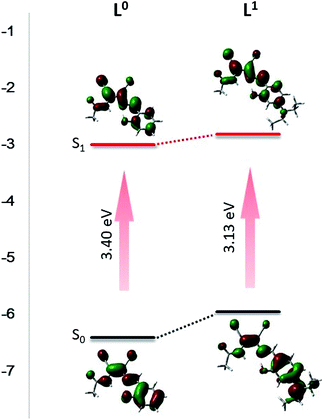 | ||
| Fig. 2 DFT calculate for molecular orbital amplitude plots of HOMO and LUMO energy levels of L0 and L1. | ||
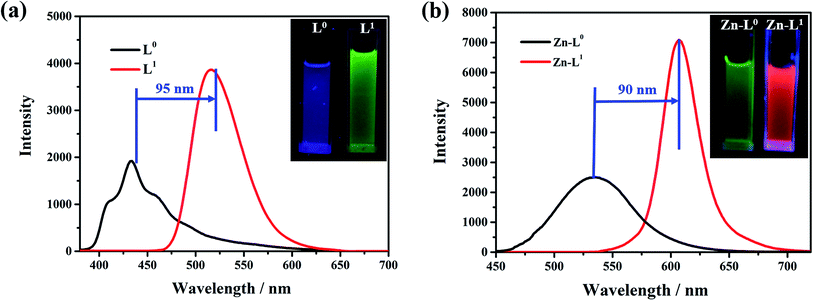
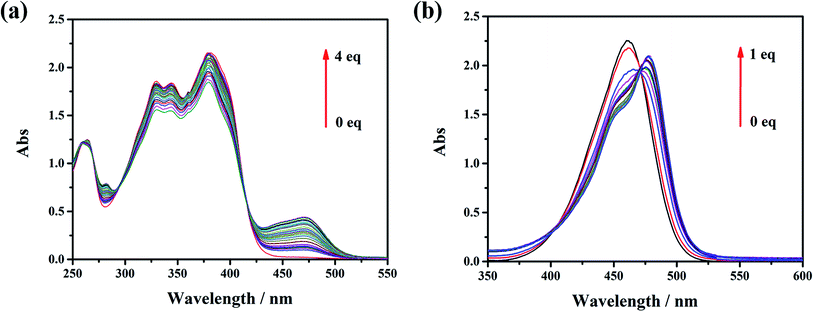
The influence of the electron pushing group was reflected distinctly on the photoluminescence spectra of L0, L1 and their coordination compounds in THF solutions, as shown in Fig. 3. The luminescence maximum intensities of L0 and L1 were at 430 nm and 520 nm, respectively (Fig. 3a). Clearly, the fluorescent emission of L1 red-shifted significantly by about 95 nm than that of L0 because of the introduction of a donating group, which resulted in ICT from N,N-diethyl to acetyl and cyan group. After coordinating with the Zn(II) ion, the luminescent maximum intensities of Zn-L0 at 530 nm and Zn-L1 at 620 nm further red-shifted to about 90 nm (Fig. 3b). It should be noticed that the maximum emission wavelengths for both ligands and their complexes red shift by more than 90 nm after introducing the –N(Et)2 group. To the best of our knowledge, this is an unusual phenomenon.11 Comparing with ligands and their coordination compounds, the emission intensities of Zn-L1 and Zn-L0 were stronger than those of L1 and L0, respectively, and the difference in values of Zn-L1 and L1 was bigger than those of Zn-L0 and L0, respectively. The interaction process of Zn(II) ion and L0 and L1 in THF could be monitored by ultraviolet titration. The equivalent points were at 296 nm and 418 nm for L0 (Fig. 4a) and at 408 nm and 475 nm for L1 (Fig. 4b). The binding constants between the ligands L0 and L1 were 1.9333 × 10⁴ and 5.6988 × 10³, respectively, which were calculated by Benesi–Hilderbrand curves, as shown in Fig S4 and S5.† Clearly, the unusual fluorescence properties of the ligands and their complexes in this study are contributed by the acetyl group in L0 and L1, which is a strong electron-pulling group that enhances the ICT effect significantly.
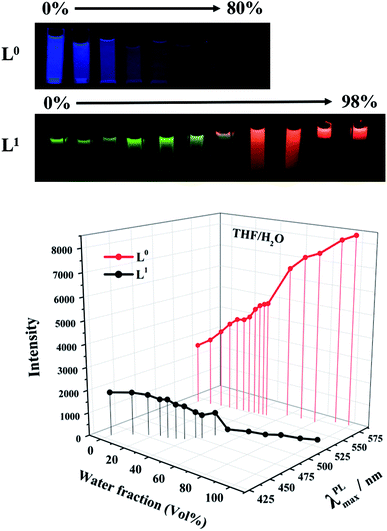
The issue of different behaviors of L0 and L1 aggregations in solution was studied in a THF/water mixture solution with different ratios. Both L0 and L1 were soluble in THF, but had low solubility in water. By adding water to the THF solution of the ligands, different interesting phenomena could be noticed, as shown in Fig. 5. When a small amount of water is present, the photoluminescence of L0 almost remained unchanged, but after adding 50% of water, the photoluminescence quenched quickly, which is a typical ACQ mechanism that happened with the red-shift from 432 nm to 535 nm. Moreover, supplying of water helps to form hydrogen bonds between L0 molecules, heightening the intermolecular effect to reward the red shift. Conversely, the luminance intensity of L1 was increased gradually along with adding water. Meanwhile, the emission wavelength was red-shift from 543 nm to 582 nm when the fraction of water is up to 60% volume. When the volume of water reached 90%, stratification was clearly observed, and L1 aggregates from the upper layer emitted strong red fluorescence, which further indicated that photoluminescence enhancement was caused by aggregation. This could account for the fact that N,N-diethyl in L1 made the L1 molecule more hydrophobic than L0, which is an intrinsic quality for AIE property. It should be noticed that the maximum emission wavelengths for both L0 and L1 were red-shifted by more than 90 nm with the increase in the volume fractions of water, although the emission intensities decreased for L0 based on ACQ and increased for L1 based on AIE mechanism. Moreover, the red shift occurred in the process of aggregation. Again, the acetyl-modification was responsible for the red-shift since the function of the acetyl group to form hydrogen bonds made it sensitive to the polar environment. Then, the acetyl group enhanced the ICT effect further. Therefore, the acetyl group performed dual functions of ICT and the red-shift fluorescent emission combined with the coordination effects by Zn(II) ions.
Crystal structures
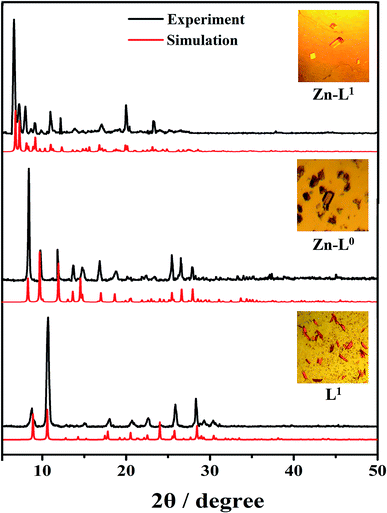
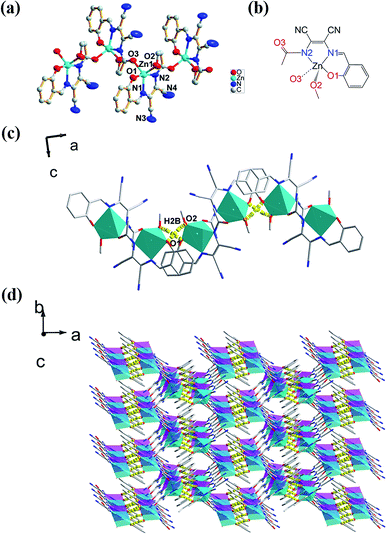
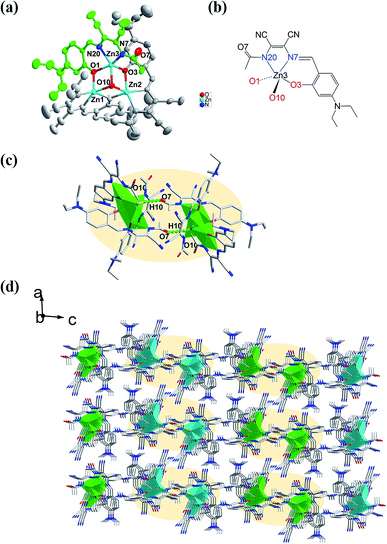
In order to understand the different behaviors of photoluminescence properties of L0, L1 and their Zn(II) coordination complexes, their single-crystal structures were studied using the X-ray single-crystal diffraction method except for L0 since its good-quality single crystals were not obtained successfully even after many efforts. Therefore, the crystal structures of L1, Zn-L0 and Zn-L1 are discussed in this section. The bulky crystals of L1, Zn-L0 and Zn-L1 match up with the simulation data of their single crystals (Fig. 6), which are synthesized in a facile manner at room temperature and by slow evaporation.The molecular structure of L1 is shown in Fig. 7a. The space group was P21. The molecules were connected by strong H-bonding N1–H1A⋯O1 (1.972 Å, 2.827 Å, 172.15°) into a one-dimensional chain (Fig. 7b) with the space apart from 4.7990 Å. Although the crystal structure of L0 has not been obtained, the crystal structure of complex Zn-L0 has been studied which is a 1D coordination polymer (Fig. 8a). The Zn(II) ions were five-coordinated, with the tridentate L0 (Zn1–O1, Zn1–N1, Zn1–N2) and carbonyl oxygen atoms as bridge atoms (O3) and a coordinating methanol group (Zn1–O2). These 1D chains are linked to a 2D layered structure via H-bonds O2–H2B⋯O1 (1.806 Å, 2.655 Å, 153.06°). There are only van der Waals interactions between the layers along the 3D direction (Fig. 8c). The structure of Zn-L1 comprises a trinuclear anionic cluster [Zn3(L1)3(μ3-OH)]− containing μ3-OH as bridging ligands and cationic [HN(Et)3]+ as counterion (Fig. 9a). Three central metal atoms are bridged by μ3-OH. The structure could be described as a pseudo-cube with a vacant position at the opposite vertex to the hydroxyl. Each coordination anionic cluster was linked by H-bonding O10–H10⋯O7 (2.204 Å, 3.013 Å, 169.08°) to form a dimer, which links to another dimer by intermolecular forces to obtain a chain structure. The 3D structures were stacked by intermolecular forces (Fig. 9c). Coordination modes could be seen in Scheme 1 and Fig. S4,† and the structure from the other viewing direction of Zn-L0 and Zn-L1 are shown in Fig. S7–S11.† The crystal data and relevant information are given in Table S3–S6.† The structures of the two complexes are significantly different due to the introduction of N,N-diethyl groups. Zn-L0 is an infinite chain, but Zn-L1 is a trinuclear structure with a pseudo-cube configuration. The reason can be explained as follows: after introducing the electron-donating group (N,N-diethyl), the negative charge density increases, and the coordination ability of hydroxy group of benzene ring of L1 could increase and make the hydroxy group a bridge μ2-OH.
 | ||
| Fig. 7 (a) ORTEP picture of L1, (b) 1D chain of L1 via H-bonding (N1–H1A⋯O1: 1.972 Å, 2.827 Å, 172.15°). | ||
Solid-state fluorescent properties
For the solid state, the maximum emission wavelength for both L0 and L1 is 596 nm with different intensities (Fig. 10a). The fluorescent emission of L0 has been completely quenched and the L1 has a strong fluorescent emission red-shifted to 70 nm relative to its THF solution. The results are consistent with the trend of L1 and L0 in a THF/H2O solution with the different ratios of THF/H2O for the study of ACQ and AIE. Combining with the studies of the solution emission, there may be some reasons to explain the novel behaviours. By the introduction of the acetyl group, it not only provides a coordination binding site and pushing electron density to create a more asymmetrical electron distribution at the molecular level but also offers a hydrogen bond function to enhance the intermolecular interaction, which makes the two ligands more sensitive to the polar solvents or environment from the viewpoint of supramolecular chemistry. The intermolecular hydrogen bonds of L0 and L1 are structural features for luminance with excited-state intramolecular proton transfer (ESIPT), which highly depends on solvent environments.12 The luminescence emission spectra are shown in Fig. S20 and S21.† It could be observed that the emission wavelength with the increase in polarity of solvents became larger. Meanwhile, the Stokes shift and red shift of L0 and L1 in solid state are typical luminescence properties of ESIPT. Furthermore, the addition of water increases the polarity of the solvent, so that it could break the equilibrium in the original solvent, which brings intramolecular twist and decreases coplanarity. These states were referred to twisted intramolecular charge transfer (TICT), which makes the charge separate between donors and acceptors, resulting in the narrowing of the bond gap. The twist molecular conformation is more stable in polar solvents, which leads to an increase in the luminance intensity and emission efficiency.13 From the luminescence emission spectra of L1 in different solvents (Fig. S21†), it was clear that the emission wavelength became larger with the increase in the polarity of solvents; these phenomena illustrate that the TICT effect is appropriate for L1. In molecular crystal structure of L1, because of inducing the N,N-diethyl group, the benzene ring is easily twisted around the C7–C8 bond. Compared with the fluorescence quantum yield (ΦF) and the fluorescence lifetimes (τ) of L0 and L1, which are 2.48%, 11.31%, 0.7107 and 4.8136 ns, respectively, which proved the influence of TICT state for luminance of L0 and L1. These factors have more effects on the ligand L1 than L0. Moreover, the crystal structure study shows the L1 molecules linked with each other in parallel and order pattern, which is responsible for the L1 molecule's AIE and photoluminescent emission to red-shift. For L0, molecular planarity is better than L1 since it is not bulky N,N-diethyl group, which could make L0 closer packing in crystal lattice through π–π stacking interactions. It has typical structural characterizes for ACQ mechanism.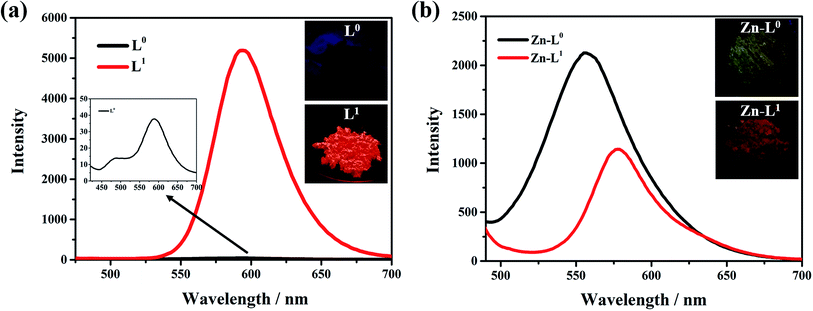 | ||
| Fig. 10 (a) L0 and L1 on solid state (λex = 475 nm), (b) Zn-L0 and Zn-L1 on solid state (λex = 475 nm). All photos were filmed at 365 nm in an ultraviolet light box. | ||
It is interesting to note that the crystallized solids of the Zn(II) coordination complexes of L0 and L1 have different performances on fluorescent emissions relative to themselves. The fluorescent intensity of Zn-L0 was stronger than that of L0 and the intensity of Zn-L1 was weaker than that of L1, which can be explained by the fact that after coordinating, the polymetallic clusters of Zn-L1 were formed to weaken the photoluminescence. Moreover, zinc had electron pulling ability so it participated in the coordination, the distribution of electron clouds became more balance than L1 that affected photoluminescent intensity.14 The fluorescence quantum yields (ΦF) of Zn-L0 and Zn-L1 are 12.99%, 13.87%, and the fluorescent lifetimes (τ) of them are 0.7115 and 0.7285 ns, respectively. These combinations such as coordinated bonds, hydrogen bonds and intermolecular forces reinforce the rigidity of the molecule, limit the rotation of the benzene ring, and reduce the non-radiative relaxation of the excited states, so that the photoluminescence intensity increases.
Conclusions
The synthesis of Schiff bases with different substitution groups at four positions has been reported, in which the introduction of a strong electron-pushing group improves the photoluminescent characteristics by enhancing the ICT effect. The acetyl group increases the possibility of hydrogen and coordination bonding in order to control the intermolecular interaction and influence the arrangement between the molecules. L1 has AIE characters, but L0 has ACQ that limits the application of luminance materials. It is shown that the introduction of electron-rich groups can improve the level of molecular photoluminescence and expand the application range. It also makes multifarious structures of coordination compounds probable, as proved by the crystal structures of Zn-L0 and Zn-L1. These design ideas help synthesize better red-emitting materials in the future. Because L1 is stable in water solution with the range of pH values from 3 to 8, the design and synthesis of bio-fluorescent probes based on coordination complexes of L1 will exhibit a bright application.Conflicts of interest
The authors confirm that this article content has no conflict of interest.Acknowledgements
This work was financially supported by the National Natural Science Foundation of China (no. 21471017).References
- Z. Yao, M. Zhang, H. Wu, L. Yang, R. Li and P. Wang, J. Am. Chem. Soc., 2015, 137, 3799–3802 CrossRef CAS PubMed
.
-
(a) S. Gan, W. Luo, B. He, L. Chen, H. Nie, R. Hu, A. Qin, Z. Zhao and B. Tang, J. Mater. Chem. C, 2016, 4, 3705–3708 RSC
; (b) P. Data, P. Pander, M. Okazaki, Y. Takeda, S. Minakata and A. P. Monkman, Angew. Chem., 2016, 128, 5833–5838 CrossRef
; (c) H. Xiao, P. Li, W. Zhang and B. Tang, Chem. Sci., 2016, 7, 1588–1593 RSC
.
-
(a) L. Hu, Y. Duan, Z. Xu, J. Yuan, Y. Dong and T. Han, J. Mater. Chem. C, 2016, 4, 5334 RSC
; (b) J. Luo, Z. Xie, J. W. Lam, L. Cheng, H. Chen, C. Qiu, H. S. Kwok, X. Zhan, Y. Liu, D. Zhu and B.-Z. Tang, Chem. Commun., 2001, 1740–1741 RSC
.
-
(a) W. Qin, J. W. Y. Lam, Z. Yang, S. Chen, G. Liang, W. Zhao, H. Kwok and B. Tang, Chem. Commun., 2015, 51, 7321 RSC
; (b) Q. Zhang, H. Kuwabara, W. Potscavage, S. Huang, Y. Hatae, T. Shibata and C. Adachi, J. Am. Chem. Soc., 2014, 136, 18070 CrossRef CAS PubMed
; (c) G. Salassa, J. Ryan, E. EscuderoAdán and A. W. Kleij, Dalton Trans., 2014, 43, 210–221 RSC
; (d) C. Gomez-Duran, R. Hu, G. Feng, T. Li, F. Bu, M. Arseneault, B. Liu, E. Pena-Cabrera and B. Tang, ACS Appl. Mater. Interfaces, 2015, 7, 15168 CrossRef CAS PubMed
.
-
(a) J. Yang, R. Shi, P. Zhou, Q. Qiu and H. Li, J. Mol. Struct., 2016, 1106, 242–258 CrossRef CAS
; (b) L. Hu, J. Sun, J. Han, Y. Duan and T. Han, Sens. Actuators, B, 2017, 239, 467–473 CrossRef CAS
; (c) T. Fan, W. Xu, J. Yao, Z. Jiao, Y. Fu, D. Zhu, Q. He, H. Cao and J. Cheng, ACS Sens., 2016, 1, 312–317 CrossRef CAS
; (d) K. Vijay, C. Nandib and S. Samant, RSC Adv., 2016, 6, 49724–49727 RSC
.
-
(a) T. Han, X. Gu, J. Lam, A. Leung, R. Kwok, T. Han, B. Tong, J. Shi, Y. Dong and B. Tang, J. Mater. Chem. C, 2016, 4, 10430 RSC
; (b) X. Yang, X. Chen, X. Lu, C. Yan, Y. Xu, X. Hang, J. Qu and R. Liu, J. Mater. Chem. C, 2016, 4, 383–390 RSC
.
-
(a) M. Kaloo and J. Sankar, Chem. Commun., 2015, 51, 14528 RSC
; (b) M. Kaloo and J. Sankar, New J. Chem., 2014, 38, 923–926 RSC
; (c) I. Oliveri, S. Failla, A. Colombo, C. Dragonetti, S. Righetto and S. Bella, Dalton Trans., 2014, 43, 2168–2175 RSC
; (d) H. Jung, P. Kwon, J. Lee, J. Kim, C. Hong, J. Kim, S. Yan, J. Lee, J. Lee, T. Joo and J. Kim, J. Am. Chem. Soc., 2009, 131, 2008–2012 CrossRef CAS PubMed
.
- Q. Meng, P. Zhou, F. Song, Y. Wang, G. Liu and H. Li, CrystEngComm, 2013, 15, 2786 RSC
.
- W. Wang, L. Hao, C. Chen, Q. Qiu, K. Wang, J. Song and H. Li, RSC Adv., 2017, 7, 20488 RSC
.
- Y. Liu, Y. Zhang, X. Wu, Q. Lan, C. Chen, S. Liu, Z. Chi, L. Jiang, X. Chen and J. Xu, J. Mater. Chem. C, 2014, 2, 1068 RSC
.
- T. Han, Y. Hong, N. Xie, S. Chen, N. Zhao, E. Zhao, J. Lam, H. Sung, Y. Dong, B. Tong and B. Tang, J. Mater. Chem. C, 2013, 1, 7314 RSC
.
-
(a) K. Li, Q. Feng, G. Niu, W. Zhang, Y. Li, M. Kang, K. Xu, J. He, H. Hou and B. Tang, ACS Sens., 2018, 3, 920–928 CrossRef CAS PubMed
; (b) L. Wang, Y. Li, X. You, K. Xu, Q. Feng, J. Wang, Y. Liu, K. Li and H. Hou, J. Mater. Chem. C, 2017, 5, 65–72 RSC
.
- K. Li, Y. Liu, Y. Li, Q. Feng, H. Hou and B. Tang, Chem. Sci., 2017, 8, 7258–7267 RSC
.
- Y. Dong, R. Fan, W. Chen, P. Wang and Y. Yang, Dalton Trans., 2017, 46, 6774 Search PubMed
.
Footnote |
| † Electronic supplementary information (ESI) available: Details about general methods, syntheses, structure information, spectra (IR, 1H NMR, UV-vis, fluorescence), PXRD, thermogravimetric analysis. CCDC 1862896–1862898. For ESI and crystallographic data in CIF or other electronic format see DOI: 10.1039/c9ra00977a |
| This journal is © The Royal Society of Chemistry 2019 |

