 Open Access Article
Creative Commons Attribution 3.0 Unported Licence
Accelerated physical ageing of poly(1,4-cyclohexylenedimethylene-co-2,2,4,4-tetramethyl-1,3-cyclobutanediol terephthalate)†
Emil Andersen ab,
René Mikkelsenb,
Søren Kristiansenb and
Mogens Hinge
 *a
*a
aPlastic and Polymer Engineering, Department of Engineering, Aarhus University, Hangøvej 2, DK-8200 Aarhus N., Denmark. E-mail: hinge@eng.au.dk; Tel: +45 22770555
bLEGO System A/S, Kløvermarken 16, DK-7190 Billund, Denmark
First published on 7th May 2019
Abstract
Successfully evaluating plastic lifetime requires understanding of the relationships between polymer dynamics and mechanical performance as a function of thermal ageing. The relatively high Tg (Tg = 110 °C) of poly(1,4-cyclohexylenedimethylene-co-2,2,4,4-tetramethyl-1,3-cyclobutanediol terephthalate) (PCTT) renders it useful as a substituent for PET in higher temperature applications. This work links thermal ageing and mechanical performance of a commercial PCTT plastic after exposure to 40–80 °C for up to 2950 h. No chemical or conformational changes were found while pronounced physical ageing, measured as enthalpic relaxation, caused yield hardening (28% increase in yield strength) and embrittlement (80% decrease in toughness). Enthalpic relaxation increased with temperature and time to 3.8 J g−1 and correlated to the determined toughness and yield strength. Finally, a 9% increase in Young's modulus was observed independent of temperature and with no correlation to enthalpic relaxation. Enthalpic relaxation followed Vogel–Fulcher–Tammann behaviour, while yield strength and charpy v-notch toughness followed Arrhenius behaviour enabling prediction of the different properties with time and temperature.
1. Introduction
Increased awareness of environmental impact from plastics has intensified the research into bio-based and recyclable polymeric materials.1–4 A class of plastics showing strong potential is polyesters. Polyesters are challenged in high-temperature environments due to their vulnerability to thermally induced mechanical changes which limits service life. These mechanical changes can be subdivided into chemical and physical ageing. Chemical aging e.g. hydrolysis and oxidation can cause polymer cleavage and/or cross-linking.5 Excessive cross-linking often results in embrittlement where a reduction in molecular mass reduces mechanical, thermal and rheological properties rendering the plastic defective.6 Physical ageing arises from super-cooling amorphous materials and is the subsequent time and temperature-dependent drift towards equilibrium.7 It is a general effect, influencing the amorphous phases in all polymer materials decreasing the ductile properties.8–10 This polymeric compaction by segmental polymer movement results in reduced free volume, and thus increases density of the amorphous phases.11,12 Physical ageing is only observed below the glass transition temperature (Tg, indicated as onset throughout this paper) where the amorphous phases are solidified out of equilibrium. Thus, heating the material above Tg erases physical ageing, presented as enthalpic relaxation, determinable by differential scanning calorimetry (DSC).13 However, below Tg the driving force of physical ageing is the temperature difference between the exposed temperature (Te) and Tg14 implying that higher service temperature (below Tg) causes faster physical aging.While maximizing Tg–Te is a common strategy for physical aging inhibition, other inhibiting methods include increasing crystallinity, increasing molecular weight and addition of hydrogen-bonding additives.14,15 Increasing crystallinity reduces the size of the amorphous phases and restricts polymeric movement as a larger fraction of the amorphous phases are restricted by the crystal–amorphous interface. This mobility restriction of the polymer decreases the rate of enthalpic relaxation.16 Physical aging rate reduction has a nonlinear relationship with crystallinity in e.g. poly(ethylene terephthalate) (PET) an increase in crystallinity from 19–21% causes 29% decrease in enthalpic relaxation rate while an increase from 38–48% causes 23% decrease in enthalpic relaxation rate.16 It could be argued that moisture acting as plasticiser increases physical aging rate, however, it is demonstrated in PET that moisture splits enthalpic relaxation into two peaks, but not consequently accelerating it.17,18
Temperature acceleration is commonly evaluated by Arrhenius-factorisation, expressed by an activation energy.19 The activation energy is the strength of temperature dependence, calculated from time–temperature superpositions (called shift factors). This is particularly useful when predicting properties of commodity materials, as they are typically used at various temperature ranges. However, when approaching Tg the relaxation times of the amorphous phase, such as enthalpic relaxation, is known to follow a Vogel–Fulcher–Tammann (VFT) behaviour as given in eqn (1).20
 | (1) |
PET (Tg = 75 °C) products are challenged by physical aging in elevated temperature applications.16 Mechanical implications of physical ageing for PET is observed as a decrease in essential work of fracture and increase in yield strength.21 These changes in mechanical properties causes physical ageing to be considered the most significant ageing kinetic in PET that limits its service life.22,23 PETG (Tg = 78 °C) is synthesised as PET but substituting a fraction of the ethylene glycol with 1,4-cyclohexanedimethanol (CHDM) causes the end-product to be more ductile but Tg only increases by ∼4 °C.24,25 A potential material could be poly(1,4-cyclohexylenedimethylene-co-2,2,4,4-tetramethyl-1,3-cyclobutanediol terephthalate) (PCTT, for its structure see Fig. 1) (Tg = 110 °C) synthesised by replacing the ethylene in PETG with the rigid 2,2,4,4-tetramethyl-1,3-cyclobutanediol (TMCD) causing Tg to increase significantly, ∼35 °C.26 Thus, PCTT could be suitable for high temperature applications in comparison to PET and PETG. At present there is no literature or studies examining the chemical and mechanical properties of PCTT during thermal aging at temperatures below Tg.
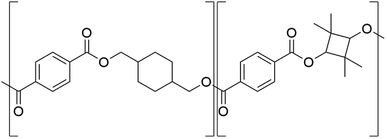 | ||
| Fig. 1 Chemical structure of poly(1,4-cyclohexylenedimethylene-co-2,2,4,4-tetramethyl-1,3-cyclobutanediol terephthalate) (PCTT). | ||
This paper contributes to the investigation of physical and chemical ageing of PCTT while evaluating its mechanical properties. Injection moulded specimens were heat-treated at different temperatures (40 °C to 80 °C) for various periods (until 2950 h) and subsequent changes to chemical, thermal and mechanical properties were determined. Chemical changes were investigated by attenuated total reflectance Fourier transform infrared spectroscopy (ATR-FTIR) and nuclear magnetic resonance spectroscopy (NMR) and morphological changes were evaluated by DSC where enthalpic relaxation was used to determine parameters for a VFT-model. Mechanical properties were evaluated by tensile and impact testing and used to determine parameters for an Arrhenius model.
2. Materials and method
2.1. Production of test specimens
PCTT (TX1001, Eastman, USA) was dried at 85 °C for six hours (to ∼0.03 wt% water) before injection moulding (Arburg 470E 600-290, Arburg, GER) at 260 °C into an 80 °C mould. 248 dumbbell-shaped tensile specimens (gauge dimension: 2 mm × 6.94 mm × 100 mm, ESI, Fig. S10†) were moulded at a peak-pressure of 78 MPa. 204 charpy v-notch test specimens (dimension: 6 mm × 4 mm × 50 mm) were moulded in the same way but at a peak-pressure of 53 MPa.2.2. Heat treatments
A specimen set comprises of six tensile specimens, six v-notch charpy specimens and two DSC specimens cut from a tensile specimen. Three ovens (one ED115 E2, BINDER, GER, and two UN110, Memmert, GER) located in an environmentally controlled room (22–24 °C, 20–40% RH) were kept at 40, 60 and 80 °C, respectively. One set was tested immediately as reference (0 h). 10 sets were placed in each oven and extracted after 8, 18, 43, 67, 95, 262, 418, 1127, 1605 and 2950 h. Three times six v-notch charpy specimens were heat-treated at 70 °C, 60% RH in a humidity chamber (HPP260, Memmert, GER) and were extracted after 18, 43 and 67 h. After extraction all sets were stored for at least 48 h prior measurements for temperature and surface humidity equilibration.2.3. Tensile testing
Test specimens were mounted with the inlet pointing outward in the bottom grip in a universal testing machine (Z005, Zwick Roell, GER) fitted with a 25 mm gauge length clip on extensometer (180102/2008, Zwick Roell, GER) all controlled by testXpert II (Zwick, GER). Tensile tests and data extractions were performed according to ISO 527-1.27 Young's modulus determination was between 0.05 to 0.25% elongation at 1 mm min−1 while yield strength, ultimate tensile strength, stress and strain at break were evaluated at 100 mm min−1 above 0.25% elongation.2.4. Charpy v-notch impact test
Charpy specimens were cut (ZNO, Zwick, GER) according to ISO 179-1 (ref. 28) type A-notch, with a notch tip diameter of 0.5 mm. Specimens were horizontal positioned with the v-notch opposite the pendulum and tested (according ISO 179-1) with a 4 J potential energy pendulum (HIT, Zwick, GER). Data was collected by software testXpert II (Zwick, GER) by measuring the angle of pendulum rotation as a function of dissipated energy.2.5. Differential scanning calorimetry
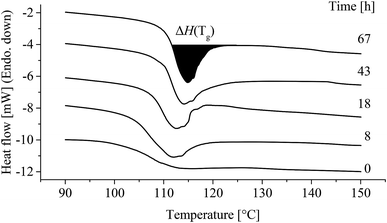
A 2 mm thick, ∅4 mm cylindrical sample was punched from a tensile specimen and placed in a pan (901683.901 Tzero Hermetic Pan, TA Instruments, USA), covered with a lid (Tzero Hermetic Lid 901683.901, TA Instruments, USA) crimped (Tzero Press, TA Instruments, USA), weighed (Quintex 124-1s, Sartorius, GER) and inserted into the DSC (Q2000, TA Instruments, USA). Temperature was swept twice from 20 °C to 300 °C and back to 20 °C at 20 °C min−1. DSC was applied to quantify enthalpic relaxation by integration of the endothermic peak at Tg.29 Enthalpic relaxation (ΔH(Tg)) was determined in Universal Analysis 2000 (V. 4.5, TA Instruments, USA) by numerical integration with a linear extrapolation from the constant heat flow plateau after Tg subtracted the unaged ΔH(Tg) (t = 0 h) (Fig. 12). Onset Tg was determined during cooling, ΔCp was determined as the change in heat flow over Tg during heating and Tm was determined from integration with linear baseline from 240 to 280 °C.2.6. Arrhenius and VFT factorisation
Arrhenius and VFT plots were created from shift factors (aT) and reciprocal exposed temperature (1/Te). Yield strength and enthalpic relaxation shift factors were determined from superposing the logarithmic function, y = a + b![[thin space (1/6-em)]](https://www.rsc.org/images/entities/char_2009.gif) log(x), to 40 °C. Charpy v-notch shift factors were determined from when toughness was halved and time-superposing to when 60 °C was halved. Yield strength and charpy v-notch toughness was fit with Arrhenius and enthalpic relaxation to the VFT equation.
log(x), to 40 °C. Charpy v-notch shift factors were determined from when toughness was halved and time-superposing to when 60 °C was halved. Yield strength and charpy v-notch toughness was fit with Arrhenius and enthalpic relaxation to the VFT equation.
2.7. Imaging
Fractured charpy v-notch samples were placed in the microscope (AX10, ZEISS, GER) below the 10× (Epiplan 10×/0.25 HD M27, ZEISS, GER) lens where it was imaged (Axiocam 105 color, ZEISS, GER) and saved by software (ZEN 2 core, ZEISS, GER).2.8. Attenuated total reflectance infrared spectroscopy (ATR-FTIR)
Spectra were collected on the tensile specimen grip section on FT-IR (Thermo Scientific, iS50, USA) equipped with ZnSe ATR (iD5, Thermo Scientific, USA) from 500–4000 cm−1 with avg. of 8 scans, wavelength dependent penetration depth and baseline were corrected in OMNIC (v. 8.2.388., TA Scientific, USA). Bands 2934 cm−1, 1719 cm−1, 1452 cm−1, 1018 cm−1, 874 cm−1, and 729 cm−1 were integrated and normalized by the integrated area of the band at 874 cm−1 as a function of time at 40, 60, and 80 °C.2.9. Nuclear magnetic resonance spectroscopy
PCTT samples were dissolved in 0.8 mL solution of 25 vol% trifluoroacetic acid (99.5% TFAA D, eurisotop, GBR) in CDCl3 (99.8% Chloroform-d, Sigma Aldrich, GER) at 40 °C assisted by ultrasound (Ultrasonic Cleaner, VWR, USA) for 2 h. NMR spectrometer (Ascend™ 400 MHz, Bruker, USA) recorded HCQS, NOESY, 16 scan 1H and 1024 scan 13C spectra with subsequent data-treatment in Mnova (V. 10.0, Mestrelab Research, ESP).3. Results
3.1. NMR analysis
The NMR assignment and calculations will follow the nomenclature given in Fig. 2 where *, ′ and ′′ denotes end-group, trans, and cis atoms, respectively.PCTT was characterised by comparing the NMR spectra to analysis of the PCTT monomers, i.e. terephthalic acid (TPA), 1,4-cyclohexanedimethanol (CHDM)24 and 2,2,4,4-tetramethyl-1,3-cyclobutanediol (TMCD).30 13C NMR spectra of virgin PCTT is presented in Fig. 3.
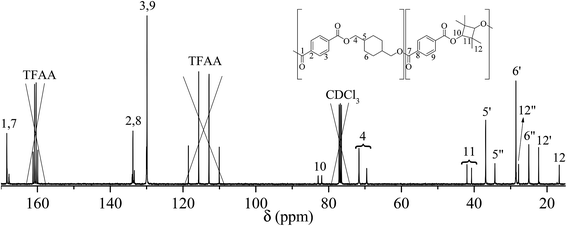 | ||
| Fig. 3 13C-NMR of poly(1,4-cyclohexylenedimethylene-co-2,2,4,4-tetramethyl-1,3-cyclobutanediol terephthalate) (PCTT), chemical shifts marked where ′ is trans and ′′ is cis conformation. | ||
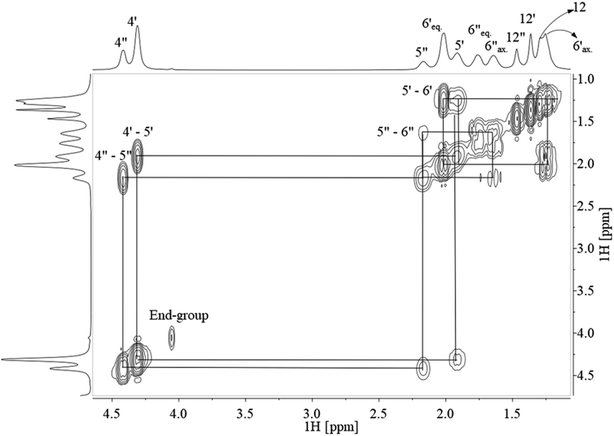
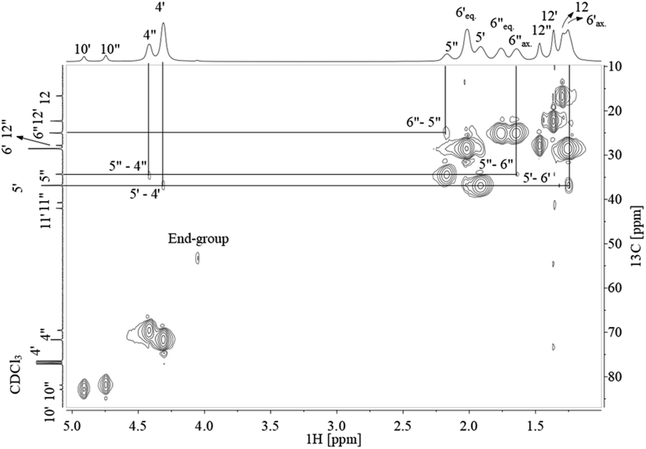
Assignment of 13C NMR in Fig. 3 verified the expected PCTT structure, dyads (NTT, NTC, NCT, and NCC) and clear splitting of the cis and trans configuration of the CHDM (i.e. 5′/5′′ and 6′/6′′) and TMCD (i.e. 12′/12′′) units was seen. 1H–1H COSY NMR (Fig. 4) and 1H–13C HSQC NMR (Fig. 5) was recorded to validate the assignment.
The signals from proton-containing adjacent groups (Fig. 4) allows for the assignment of cis and trans conformation in CHDM. Also, the CHDM methyl end-group (4*) at 4.05 ppm has 1H–1H cross-peaks at 1.73, 1.66 and 4.85 ppm which are assigned to the equatorial, axial methine proton (5*) and hydroxyl proton (13*). TMCD contains no proton-containing adjacent groups, and thus HSQC is required to support the previous 13C NMR to 1H NMR analysis.
The correlation between 1H NMR and 13C NMR signals shown in Fig. 5 confirm the cis and trans conformation in CHDM and correlate with the previous 13C NMR assignment of TMCD.30 Also, the methyl and methine end-groups present cross-signals in 1H–13C NMR at 4.05 ppm–53.42 ppm and 1.73/1.66 ppm–22.00 ppm, respectively. Lastly, no cross-signal is presented at the hydroxyl group at 4.85 ppm, confirming the CHDM end-group assignment. Full assignment from 1H and 13C NMR is presented in Table S1 ESI.†
Assuming linearity i.e. that CHDM is the only end-group of linear polymers, then the average degree of polymerization of the CHDM (C) unit, nC, can be estimated from 1H NMR by dividing the methyl cis (4′′, 4.43 ppm) and trans (4′, 4.32 ppm) peaks, by the end-group (4*, 4.05 ppm). TMCD (T) average degree of polymerization, nT, can similarly be calculated using the methine cis (10′′, 4.75 ppm) and trans (10′, 4.91 ppm) peaks by the end-group (4*, 4.05 ppm) as given in eqn (2):
 | (2) |
From the degree of polymerization, the average number molecular weight, ![[M with combining macron]](https://www.rsc.org/images/entities/i_char_004d_0304.gif) n, can be found as given in eqn (3):
n, can be found as given in eqn (3):
![[M with combining macron]](https://www.rsc.org/images/entities/i_char_004d_0304.gif) n = MCnC + MTnT n = MCnC + MTnT
| (3) |
TMCD/CHDM ratio (fT/C) was calculated from the carbonyl 13C-NMR CHDM (1, 167.8 ppm) and TMCD (7, 168.4 ppm) peaks as given in eqn (4):
 | (4) |
Trans/cis ratios of the two units (rCtrans/cis, rTtrans/cis) were calculated from the methine cyclic carbon peak in CHDM (5′′/5′, 36.9/34.3 ppm) and TMCD (10′′/10′, 82.9/81.9 ppm) as given in eqn (5):
 | (5) |
Mole fraction of the Dyad sequences was determined from the benzene terephthalic acid 13C NMR peak at 133.7 ppm and calculated from the concentration of TMCD and CHDM as given in eqn (6):
| NTT = XT2 ∧ NTC = NCT ∧ NCC = XC2 | (6) |
Analysing 1H, 13C, COSY, HSQC and eqn (1)–(6), the average number molecular mass (![[M with combining macron]](https://www.rsc.org/images/entities/i_char_004d_0304.gif) n), and monomer fractions (XT, XC, and fT/C) and dyads were found. None of these values showed significant change at the 80 °C heat-treatment temperature over time (ESI, Fig. S1, S2, Table S2 and S3†). Average values and standard deviations for all values are therefore calculated and given in Table 1.
n), and monomer fractions (XT, XC, and fT/C) and dyads were found. None of these values showed significant change at the 80 °C heat-treatment temperature over time (ESI, Fig. S1, S2, Table S2 and S3†). Average values and standard deviations for all values are therefore calculated and given in Table 1.
![[M with combining macron]](https://www.rsc.org/images/entities/i_char_004d_0304.gif) n: number-average molecular weight, NCT, NCC, NTT and NTC: Dyad distribution
n: number-average molecular weight, NCT, NCC, NTT and NTC: Dyad distribution
| fC/T | rCtrans/cis | rTtrans/cis | ![[M with combining macron]](https://www.rsc.org/images/entities/i_char_004d_0304.gif) n [kDa] n [kDa] |
Dyads | ||||
|---|---|---|---|---|---|---|---|---|
| NCT | NCC | NTT | NTC | |||||
| Avg. | 79.7/20.3 | 69.9/30.1 | 53.6/47.4 | 14.9 | 15.7 | 63.8 | 4.7 | 15.7 |
| Std. dev. | 0.7 | 0.5 | 2.9 | 1.8 | 1.2 | 1.5 | 0.9 | 0.9 |
Thus, NMR demonstrates no significant changes in cis/trans conformations, dyads or molecular weight indicating no chemical degradation has occurred during heat treatment.
3.2. ATR-FTIR
ATR-FTIR spectra of reference (t = 0 h) PCTT sample is given in Fig. 6.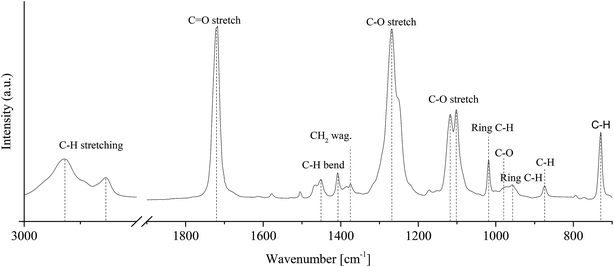 | ||
| Fig. 6 ATR-FTIR spectrum of an injection moulded sample without heat treatment and assignment to poly(1,4-cyclohexylenedimethylene-co-2,2,4,4-tetramethyl-1,3-cyclobutanediol terephthalate) (PCTT). | ||
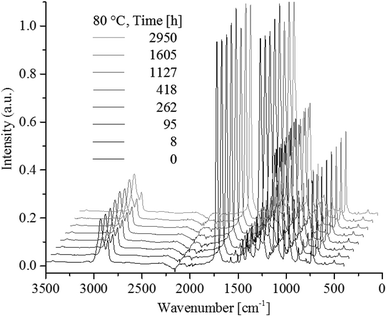
Ester C![[double bond, length as m-dash]](https://www.rsc.org/images/entities/char_e001.gif) O stretching is assigned to the band at 1719 cm−1 and C–O at 1267 cm−1. Hexane C–H is assigned to bending at 1452 cm−1 and stretching at 1018 cm−1.31 Aromatic C–H bending is assigned to the bands at 873 cm−1 while 1,4-para-substituted aromatic C–H out of plane stretch is assigned to the 729 cm−1 band.32,33 Which in combination verified the chemical composition. Fig. 6 shows ATR-FTIR spectra of PCTT samples heat-treated at 80 °C as a function of time.
O stretching is assigned to the band at 1719 cm−1 and C–O at 1267 cm−1. Hexane C–H is assigned to bending at 1452 cm−1 and stretching at 1018 cm−1.31 Aromatic C–H bending is assigned to the bands at 873 cm−1 while 1,4-para-substituted aromatic C–H out of plane stretch is assigned to the 729 cm−1 band.32,33 Which in combination verified the chemical composition. Fig. 6 shows ATR-FTIR spectra of PCTT samples heat-treated at 80 °C as a function of time.
Fig. 7 shows no significant changes to any IR bands, even after 2950 h of heat-treatment at the highest tested temperature of 80 °C. Presenting IR band differences during all heat-treatment temperatures (ESI, Table S4 and S5†) shows no significant change in intensity except for one initial drop of 6.8% in the 2934 cm−1 CH2/CH3 stretching vibrations. Hence, ATR-FTIR analysis show no chemical change over the examined time and heat-treatment temperature range.
3.3. Tensile test
Young's modulus is shown in Fig. 8 as a function of time at the different heat-treatment temperatures.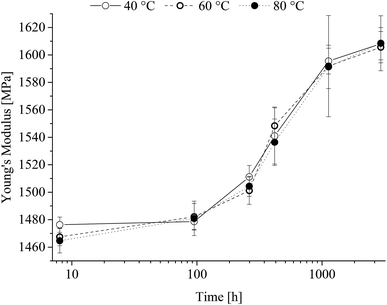 | ||
| Fig. 8 Young's modulus of poly(1,4-cyclohexylenedimethylene-co-2,2,4,4-tetramethyl-1,3-cyclobutanediol terephthalate) as a function of heat treatment time. | ||
From Fig. 8 it is seen that after an initial lack period of 100 h a steady increase in Young's modulus independent of the heat-treatment temperature range is observed. The obtained yield strength is shown in Fig. 9 as a function of time at the different heat-treatment temperatures.
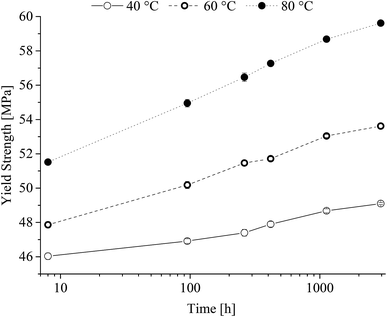 | ||
| Fig. 9 Yield strength of poly(1,4-cyclohexylenedimethylene-co-2,2,4,4-tetramethyl-1,3-cyclobutanediol terephthalate) (PCTT) resulting from heat-treatment. | ||
Fig. 9 show that yield strength increased with time and that temperature induced a significant shift already after 8 h. It is further seen that the rate of yield strength increase is larger at higher treatment temperatures. This clearly demonstrates a yield hardening of PCTT with both time and in particular treatment temperature. Ultimate tensile strength was equal to the fracture stress at 40 and 60 °C, however, 80 °C exposure resulted in having ultimate tensile strength equal to the yield strength (ESI, Fig. S3†). Elongation and stress at break reveal no significant change (ESI, Fig. S4 and S5†).
3.4. Charpy v-notch toughness
Charpy v-notch specimen testing presented impact toughness decrease as a function of time and treatment temperature as shown in Fig. 10.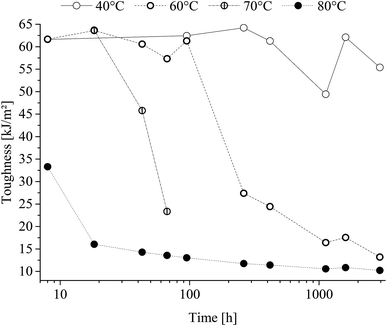 | ||
| Fig. 10 Charpy v-notch toughness of poly(1,4-cyclohexylenedimethylene-co-2,2,4,4-tetramethyl-1,3-cyclobutanediol terephthalate) (PCTT) resulting from heat-treatment. | ||
From Fig. 10 it is seen that charpy v-notch impact toughness decreased sharply after treatment at the temperatures, 60, 70 and 80 °C after being constant for a temperature-dependent time period. This decrease followed from ductile-to-brittle fracture mode transition, i.e. from yielding fracture to brittle fracture. This transition occurred earlier with higher treatment temperature, demonstrating a ductile-to-brittle transition of heat-treated PCTT with time and accelerated by temperature. However, samples heat-treated at 40 °C did not drop below half the initial toughness, and thus did not transition from ductile-to-brittle within the investigated time range.
Picturing the fracture surfaces of the heat-treated charpy v-notch bar from the ductile and brittle fracture are shown in Fig. 11A and B, respectively.
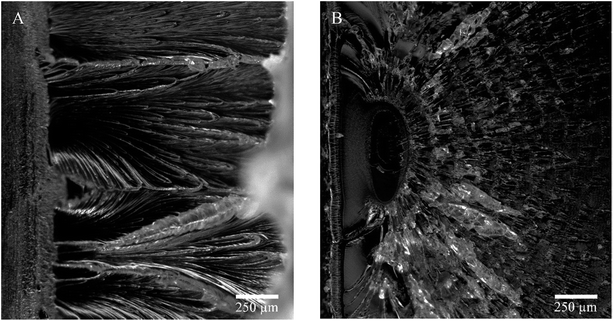 | ||
| Fig. 11 Charpy v-notch fracture after 262 h at (A) 40 °C, ductile break and (B) 80 °C, brittle break. | ||
A ductile (Fig. 11A) and a brittle (Fig. 11B) fracture surfaces are revealed. The ductile fracture is presented as lamellae drawing while the brittle fracture presents periodic craze bands. Furthermore, the ductile break seems to draw from the surface (left in pictures) while the brittle fracture origins from within the material. Also, the drawing fracture of (A) had multiple origins of fractures whereas the brittle fracture only presents one.
3.5. Thermal analysis
Enthalpic relaxation (ΔH(Tg)) determined by DSC is shown in Fig. 12.Tg and ΔCp presented no significant change with time at different temperatures (ESI, Table S6 and S7†). However, as seen from Fig. 12 the endothermic peak at Tg clearly increased with time at 80 °C.
Enthalpic relaxation as a function of time and heat-treatment temperature is given in Fig. 13.
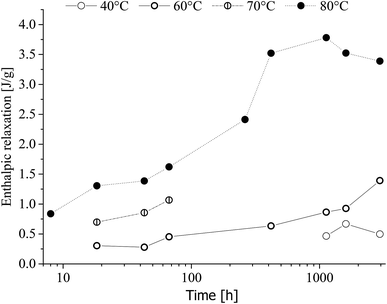 | ||
| Fig. 13 Enthalpic relaxation of poly(1,4-cyclohexylenedimethylene-co-2,2,4,4-tetramethyl-1,3-cyclobutanediol terephthalate) (PCTT) as a function of time aged at indicated heat-treatment temperatures. | ||
Fig. 13 shows that enthalpic relaxation increased with time and treatment temperature induces a clear shift after just 8 h, 80 °C. Further, the enthalpic relaxation plateaued after approximately 500 h for 80 °C while no such behaviour was observed for 40, 60 and 70 °C. Finally, enthalpic relaxation was not observed until after 1000 h at 40 °C and 18 h at 60 and 70 °C.
Extracting yield strength and charpy v-notch data result in Arrhenius plots (Fig. S9 and S10†), presented as an activation energy in Table 2.
| Ea [kJ mol−1] | cv [%] | ||
|---|---|---|---|
| Yield strength | 22.1 | ±3.0 | 14 |
| Charpy v-notch | 105.5 | ±35.2 | 33 |
It is seen that charpy v-notch toughness (Table 2) has the largest coefficient of variation. This is a result from the break-mode transitioning from ductile-to-brittle, decreasing the toughness by 84% from specimen to specimen. Furthermore, charpy v-notch toughness was only evaluated from 60–80 °C as 40 °C never transitioned from ductile-to-brittle break. Using eqn (1), the VFT parameters for enthalpic relaxation were found as R0 = 3.5 × 10⁻⁹ ± 1.8 × 10⁻⁸, B = 3.3 × 10⁻² ± 1.5 × 10⁻² and T∞ = 1.5 × 10⁻³ ± 3.4 × 10⁻⁴.
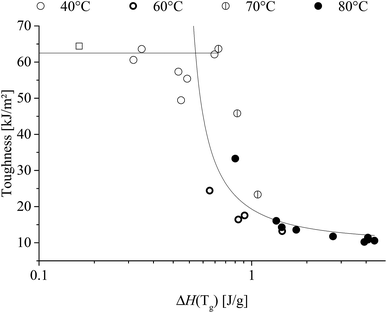
Correlating enthalpic relaxation and toughness are shown in Fig. 14.
Fig. 14 demonstrates that once the enthalpic relaxation reaches ∼0.6 J g−1 then the toughness drops significantly, regardless of heat-treatment temperature. It is also noted that the 70 °C, 60% RH toughness drop was shifted to approx. 25% to a higher enthalpic relaxation indicates the influence of water.
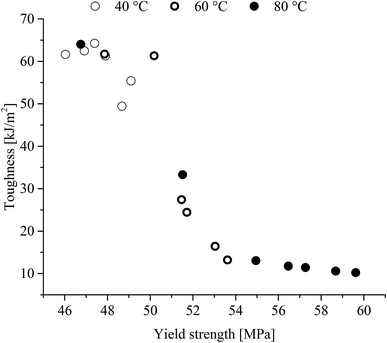
Combining the tensile yield strength and charpy v-notch toughness yields the following correlation (Fig. 15).
Yield hardening is known to cause embrittlement in elements where the correlation is clearly presented here. However, the relationship between yield hardening and charpy v-notch toughness may be correlated due to both phenomena arising from increased physical ageing.
4. Discussion
NMR-determined molecular weight of 14.9 kDa might be underestimated as the end-groups of the TMCD unit was not identified in NMR analysis (Table 1). Although the molecular masse might be valid if a surplus of CHDM was applied or if it was added later in the synthesis as both will result in only few TMCD terminated polymers. 1H and 13C NMR of heat-treated PCTT elements at 80 °C (Table 1, ESI Table S1–S3†) and ATR-FTIR of heat-treated PCTT elements at 40, 60, and 80 °C (Fig. 7, ESI Table S4 and S5†) showed no chemical or cis/trans conformational changes. Furthermore, NMR revealed a CHDM trans/cis ratio of 70/30 as expected from the equilibrium mixture during polymerization (example 5 in ref. 34). TMCD cis/trans ratio was revealed near 50/50, suggesting a random distribution of cis and trans units. Finally, the dyad ratios match the Bernoullian statistical model with a TMCD/CHDM ratio of 20/80, which supports the measured ratios and random copolymerisation.35DSC resulted in negligible changing melting peaks (ESI Table S6†), no cold crystallisation, small molecule evaporation, or other morphological rearrangements except enthalpic relaxation. Thus, the heat treatment resulted in a physical ageing clearly seen as an increase in enthalpic energy release with longer time and higher treatment temperature (Fig. 12 and 10). This enthalpic energy is ascribed to the increased local attraction between polymeric segments in the amorphous phase which must be broken when exceeding Tg.36
The described increase in local interactions would assume to decreases the segmental mobility resulting in decreased toughness which is supported by the ductile-to-brittle break transition in Fig. 10. Further, Fig. 14 shows that toughness and enthalpic relaxation correlates across treatment temperatures and time and as expected from the increased density and decreased segmental mobility leading to embrittlement of PCTT.36,37 Decreased segmental mobility also caused yield hardening, as presented in Fig. 9. Previously it has been argued that yield strength correlates with brittleness38 but the results suggest that both properties could be caused by the densification and reduced polymeric mobility in the amorphous phases. However, yield strength continues to increase while enthalpic relaxation indicates a plateau (Fig. 13, 80 °C after ∼500 h). This seems counter intuitive but the increase in number of molecular interactions can reach a maximum while a continuous rearrangement of existing interaction is still possible which can result in further decrease in molecular mobility. This behaviour has also been observed in PET and is further supported by molecular theory.8,37 Finally the molecular interactions did not result in significantly lower elongation at break, indicating polymer rearrangement during the moderate strain rate (4 s−1) of tensile testing while brittle results were clearly obtained during the higher strain rates of impact testing (3000 s−1) (Fig. 10).36
Drying PCTT may be expected to decrease the impact strength and deaccelerate the mobility-driven enthalpic relaxation as water acts as plasticiser. However, the 70 °C, 60% RH results show that drying the material increased ductile-to-brittle transition (Fig. 14), revealing a plasticizing effect of water on PCTT.39 Also, the enthalpic relaxation at 70 °C fits the VFT model in the investigated temperature-range (ESI, Fig. S9†). 70 °C at 60% RH is also included herein, revealing no significant enthalpic relaxation acceleration from moisture.
Charpy v-notch toughness and especially yield strength did not express significant VFT behaviour, but Arrhenius behaviour in the investigated temperature range (ESI, Fig. S7 and S8†). However, a critical assumption is that the activation energy (Ea) is temperature-independent.40 Although care needs to be taken when extrapolating outside (especially in the proximity of Tg41) the investigated temperature range42 parameters for prediction of mechanical and thermal behaviour are determined and can be applied in prediction of PCTT performance resulting from different temperature and time conditions.
5. Conclusion
Examination of PCTT in a temperature span from 40 to 80 °C showed no chemical degradation during heat-treatment (up till 2950 h). Although below Tg mechanical properties were affected by the heat treatment increasing yield strength by 28% and decreased in toughness of 80%. Further, an increase of Young's modulus by 9% was observed to be independent of treatment temperature. Finally, thermal analysis showed an increase in enthalpic relaxation up to 3.8 J g−1. The change in properties could be described by an Arrhenius factorisations and constants have been established to predict the performance of PCTT in a typical service temperature range.Conflicts of interest
There are no conflicts to declare.Acknowledgements
This work is partly funded by the Innovation Fund Denmark (IFD) under File No 7038-0012.References
- R. Koshti, L. Mehta and N. Samarth, Biological Recycling of Polyethylene Terephthalate: A Mini-Review, J. Polym. Environ., 2018, 1–10, DOI:10.1007/s10924-018-1214-7.
- Y. Tachibana, S. Kimura and K. Kasuya, Synthesis and verification of biobased terephthalic acid from furfural, Sci. Rep., 2015, 5, 8249, DOI:10.1038/srep08249.
- F. Neaţu, G. Culică, M. Florea, V. I. Parvulescu and F. Cavani, Synthesis of Terephthalic Acid by p-Cymene Oxidation using Oxygen: Toward a More Sustainable Production of Bio-Polyethylene Terephthalate, ChemSusChem, 2016, 9, 3102–3112, DOI:10.1002/cssc.201600718.
- Y. Wang, X. Cui, Q. Yang, T. Deng, Y. Wang, Y. Yang, S. Jia, Z. Qin and X. Hou, Chemical recycling of unsaturated polyester resin and its composites via selective cleavage of the ester bond, Green Chem., 2015, 17, 4527–4532, 10.1039/C5GC01048A.
- N. S. Allen, M. Edge, M. Mohammadian and K. Jones, Hydrolytic degradation of poly(ethylene terephthalate): Importance of chain scission versus crystallinity, Eur. Polym. J., 1991, 27, 1373–1378, DOI:10.1016/0014-3057(91)90237-I.
- J. D. Badia, E. Strömberg, S. Karlsson and A. Ribes-Greus, The role of crystalline, mobile amorphous and rigid amorphous fractions in the performance of recycled poly (ethylene terephthalate) (PET), Polym. Degrad. Stab., 2012, 97, 98–107, DOI:10.1016/j.polymdegradstab.2011.10.008.
- C. Moynihan, P. Macedo, C. Montrose, P. Gupta, M. DeBolt, J. Dill, B. Dom, P. Drake, A. Easteal and P. Elterman, Structural relaxation in vitreous materials, Ann. N. Y. Acad. Sci., 1976, 279, 15–35, DOI:10.1111/j.1749-6632.1976.tb39688.x.
- L. C. E. Struik, Physical aging in amorphous polymers and other materials, Citeseer, 1977, vol. 106, DOI:10.1002/bbpc.19780820975.
- S. Etienne and L. David, Long-term physical ageing of amorphous polymers, Philos. Mag., 2007, 87, 417–424, DOI:10.1080/14786430600847107.
- R. Zhang, P. Bai, D. Lei and R. Xiao, Aging-dependent strain localization in amorphous glassy polymers: From necking to shear banding, Int. J. Solids Struct., 2018, 146, 203–213 CrossRef CAS.
- H. Zhou, E. A. Lofgren and S. A. Jabarin, Effects of microcrystallinity and morphology on physical aging and its associated effects on tensile mechanical and environmental stress cracking properties of poly(ethylene terephthalate), J. Appl. Polym. Sci., 2009, 112, 2906–2917, DOI:10.1002/app.29822.
- D. Cangialosi, V. M. Boucher, A. Alegría and J. Colmenero, Free volume holes diffusion to describe physical aging in poly(mehtyl methacrylate)/silica nanocomposites, J. Chem. Phys., 2011, 135, 014901, DOI:10.1063/1.3605600.
- K. Aljoumaa and M. Abboudi, Physical ageing of polyethylene terephthalate under natural sunlight: correlation study between crystallinity and mechanical properties, Appl. Phys. A: Mater. Sci. Process., 2015, 122, 6, DOI:10.1007/s00339-015-9518-0.
- S. E. Petrie, Thermal behavior of annealed organic glasses, J. Polym. Sci., Part B: Polym. Phys., 1972, 10, 1255–1272, DOI:10.1002/pol.1972.160100706.
- R. D. Priestley, P. Rittigstein, L. J. Broadbelt, K. Fukao and J. M. Torkelson, Evidence for the molecular-scale origin of the suppression of physical ageing in confined polymer: fluorescence and dielectric spectroscopy studies of polymer–silica nanocomposites, J. Phys.: Condens. Matter, 2007, 19, 205120, DOI:10.1088/0953-8984/19/20/205120.
- A. Aref-Azar, F. Arnoux, F. Biddlestone and J. N. Hay, Physical ageing in amorphous and crystalline polymers. Part 2. Polyethylene terephthalate, Thermochim. Acta, 1996, 273, 217–229, DOI:10.1016/0040-6031(95)02434-4.
- N. Sun, J. Yang and D. Shen, The effect of water absorption on the physical ageing of amorphous poly(ethylene terephthalate) film, Polymer, 1999, 40, 6619–6622, DOI:10.1016/S0032-3861(99)00246-3.
- C. Bastioli, I. Guanella and G. Romano, Effects of water sorption on the physical properties of PET, PBT, and their long fibers composites, Polym. Compos., 1990, 11, 1–9, DOI:10.1002/pc.750110102.
- K. T. Gillen, R. Bernstein and D. K. Derzon, Evidence of non-Arrhenius behaviour from laboratory aging and 24-year field aging of polychloroprene rubber materials, Polym. Degrad. Stab., 2005, 87, 57–67, DOI:10.1016/j.polymdegradstab.2004.06.010.
- G. Tammann and W. Hesse, Die Abhängigkeit der Viscosität von der Temperatur bie unterkühlten Flüssigkeiten, Z. Anorg. Allg. Chem., 1926, 156, 245–257, DOI:.
- T. Bárány, E. Földes and T. Czigány, Effect of thermal and hygrothermal aging on the plane stress fracture toughness of poly(ethylene terephthalate) sheets, eXPRESS Polym. Lett., 2007, 1, 180–187, DOI:10.3144/expresspolymlett.2007.28.
- N. Doulache, M. W. Khemici, A. Gourari and M. Bendaoud, in DSC study of polyethylene terephtalate's physical ageing; 2010 10th IEEE International Conference on Solid Dielectrics, 2010, pp. 1–4, DOI:10.1109/ICSD.2010.5568072.
- S. Montserrat and P. Cortes, Physical ageing studies in semicrystalline poly (ethylene terephthalate), J. Mater. Sci., 1995, 30, 1790–1793, DOI:10.1007/BF00351611.
- S. Paszkiewicz, A. Szymczyk, D. Pawlikowska, I. Irska, I. Taraghi, R. Pilawka, J. Gu, X. Li, Y. Tu and E. Piesowicz, Synthesis and characterization of poly(ethylene terephthalate-co-1,4-cyclohexanedimethylene terephtlatate)-block-poly(tetramethylene oxide) copolymers, RSC Adv., 2017, 7, 41745–41754, 10.1039/C7RA07172H.
- Y. Tsai, C. Fan, C. Hung and F. Tsai, Amorphous copolyesters based on 1, 3/1, 4-cyclohexanedimethanol: Synthesis, characterization and properties, J. Appl. Polym. Sci., 2008, 109, 2598–2604, DOI:10.1002/app.28385.
- B. F. Barton and D. B. Shackelford, Kingsport Patent, US20070276065A1, 2013.
- A. Gerburtig and C. Lacroix, Plastics -- Determination of Tensile Properties -- Part 1: General Principles, 2012, ISO 527-1 2012 Search PubMed.
- Anonymous, Plastics -- Determination of Charpy Impact Properties -- Part 1: Non-instrumented Impact Test, 2010, ISO 179-1 2010 Search PubMed.
- S. M. Wolpert, W. Alexander and W. Bernhard, Time-dependent heat capacity in the glass transition region, J. Polym. Sci., Part A-2, 1971, 9, 1887–1905, DOI:10.1002/pol.1971.160091010.
- D. R. Kelsey, B. M. Scardino, J. S. Grebowicz and H. H. Chuah, High impact, amorphous terephthalate copolyesters of rigid 2, 2, 4, 4-tetramethyl-1, 3-cyclobutanediol with flexible diols, Macromolecules, 2000, 33, 5810–5818, DOI:10.1021/ma000223+.
- S. W. Lee, W. Huh, Y. S. Hong and K. M. Lee, Synthesis and Thermal Properties of Poly (cyclohexylene dimethylene terephthalate-co-butylene terephthalate), Korea Polym. J., 2000, 8, 261–267 Search PubMed.
- I. Ward and M. Wilding, Infra-red and Raman spectra of poly (m-methylene terephthalate) polymers, Polymer, 1977, 18, 327–335, DOI:10.1016/0032-3861(77)90077-5.
- G. Socrates, Infrared and Raman characteristic group frequencies: tables and charts, John Wiley & Sons, 2004, 0470093072 Search PubMed.
- R. H. Hasek and M. B. Knowles, Patent US2917549A, Rochester, N.Y., 1958.
- Y. G. Jeong, W. H. Jo and S. C. Lee, Cocrystallization Behavior of Poly(butylene terephthalate-co-butylene 2,6-naphthalate) Random Copolymers, Macromolecules, 2000, 33, 9705–9711, DOI:10.1021/ma000040n.
- H. E. Meijer and L. E. Govaert, Mechanical performance of polymer systems: The relation between structure and properties, Prog. Polym. Sci., 2005, 30, 915–938, DOI:10.1016/j.progpolymsci.2005.06.009.
- A. Aref-Azar, F. Biddlestone, J. Hay and R. Haward, The effect of physical ageing on the properties of poly (ethylene terephthalate), Polymer, 1983, 24, 1245–1251, DOI:10.1016/0032-3861(83)90053-8.
- T. Bárány, T. Czigány and J. Karger-Kocsis, Application of the essential work of fracture (EWF) concept for polymers, related blends and composites: A review, Prog. Polym. Sci., 2010, 35, 1257–1287, DOI:10.1016/j.progpolymsci.2010.07.001.
- S. A. Jabarin and E. A. Lofgren, Effects of water absorption on physical properties and degree of molecular orientation of poly (ethylene terephthalate), Polym. Eng. Sci., 1986, 26, 620–625, DOI:10.1002/pen.760260907.
- M. Celina, K. T. Gillen and R. A. Assink, Accelerated aging and lifetime prediction: Review of non-Arrhenius behaviour due to two competing processes, Polym. Degrad. Stab., 2005, 90, 395–404, DOI:10.1016/j.polymdegradstab.2005.05.004.
- J. Guo, R. Xiao, C. Tian and M. Jiang, Optimizing physical aging in poly (ethylene terephthalate)-glycol (PETG), J. Non-Cryst. Solids, 2018, 502, 15–21 CrossRef CAS.
- I. M. Hodge, Adam-Gibbs Formulation of Enthalpy Relaxation Near the Glass Transition, J. Res. Natl. Inst. Stand. Technol., 1997, 102, 195–205, DOI:10.6028/jres.102.015.
Footnote |
| † Electronic supplementary information (ESI) available. See DOI: 10.1039/c9ra00925f |
| This journal is © The Royal Society of Chemistry 2019 |


