
 Open Access Article
 This Open Access Article is licensed under a Creative Commons Attribution-Non Commercial 3.0 Unported Licence
Insight into the DNA adsorption on nitrogen-doped positive carbon dots†
Fenglan Lia,
Qianqian Caia,
Xiaoli Haoa,
Chengfei Zhaoa,
Zhengjun Huangab,
Yanjie Zheng*a,
Xinhua Lin*ab and
Shaohuang Weng *ab
*ab
aDepartment of Pharmaceutical Analysis, School of Pharmacy, Fujian Medical University, Fuzhou 350122, China. E-mail: shweng@fjmu.edu.cn; gillzheng@163.com; xhl1963@sina.com
bNano Biomedical Technology Research Center, Fujian Medical University, Fuzhou 350122, China
First published on 23rd April 2019
Abstract
Considerable biosensors have been fabricated on the basis of DNA interaction with carbon nanomaterials, such as graphene oxide (GO) nanosheets. Few studies have focused on the rational design of sensors between carbon dots (CDs) and DNA due to the limited understanding of the real forces behind the adsorption of DNA on CDs. In this work, nitrogen doping-positive CDs (N-CDs), which can quench fluorophore-labeled DNA, were investigated to ascertain the interaction between the CDs and DNA. With reference to DNA adsorption on GO, the adsorption capacity and kinetics of N-CDs for DNA were studied. Desorption of DNA from these surfaces was also measured. Moreover, DNA desorption and anchoring force of N-CDs to DNA were different from those of GO, given that the prepared N-CDs and GO were positively and negatively charged, respectively. Accordingly, DNA was adsorbed on N-CDs mainly via electrostatic adsorption and other forces, such as nucleobase effect, hydrophobic interaction, and van der Waals (vdW) forces. This study enhanced the basic knowledge of DNA adsorption on some CDs for further study in the application of CDs in bioanalysis or biomedicine.
Introduction
The interaction and hybrids between DNA and nanomaterials have received extensive and increased research interest in the past decade.1–3 Among them, carbon nanomaterials for DNA adsorption or attachment are promising and effective tools for biosensing, material design, gene delivery, and in vivo responsive drug system.4,5 The surface attachment of DNA on carbon nanomaterials via some clear interactive forces is the key role in the application of DNA and nanomaterial hybrids. Two main conjugation strategies of covalent bonding and physisorption have been developed in accordance with the surface properties of carbon nanomaterials. An example of the latter is ssDNA and hairpin DNA adsorbed on graphene oxide (GO) and carbon nanotubes (CNT) via physisorption.6 Such physisorption effect can be disrupted by the formation of dsDNA, which is the main mechanism for the development of various biosensing platforms based on carbon nanomaterials (such as GO and CNT) and DNA.7 Moreover, such interactions have inspired the exploration of other carbon nanomaterials with their own attaching forces for DNA.8–10Recently, fluorescent carbon dots (CDs) or graphene quantum dots (GQDs), two new types of zero-dimensional carbon nanomaterials with sizes below 10 nm, have become the focus in biosensing and drug delivery research.11,12 In the biosensing and delivery section, CDs can play several functions such as those of an internal reference fluorescence source, a carrier, and a stabilizer.13–15 At present, CDs are prepared and used as internal reference fluorescence for fabricating ratiometric biosensors for DNA.16,17 Zhang et al. developed a ratiometric fluorescence biosensor on the basis of CdTe QD for double strand DNA detection with the reference fluorescent signal of CDs.16 Moreover, the design of the DNA-functionalized CDs has attracted increasing interest. The attachment of DNA onto CDs through covalent conjugation is a centralized and effective strategy for biosensing applications.18,19 The role of carbon dots in this biosensing application of DNA-functionalized CDs is mainly just as a fluorescence signal for target.18,19 Furthermore, the development and application of the adsorption between DNA and CDs have been gradually improved by strong interactions. Loo et al. prepared carboxylic CQDs using citric acid or malic acid as a reacting source to interact and partially quench the fluorescent DNA through a simple adsorption effect.10 However, CDs have only been used as simple fluorescence signals16–19 or nanoquenchers,10 instead of their double effects and multiple functions being exhibited extensively in these studies. The multifunctional CDs may give rise to some specific sensing models. Recently, our group developed a new kind of CD with dual roles of nanoquencher and reference signal for the ratiometric fluorescence sensing based on the adsorption of ssDNA on positively charged CDs.20,21 In addition, the CDs that bind with DNA have shown promising applications in gene transmission and delivery location.22–24
Few fundamental investigations for the interaction between DNA and CDs have been reported, aside from the work in variable applied areas. Other than covalent bonding, physisorption is another possible effective conjugation method for the attachment of DNA to CDs. In the well-known model of GO and DNA, the physisorption effects in the interactive force involve π–π stacking, hydrogen bonding, and phosphate backbone action.25–27 However, variable CDs may interact contrastingly with DNA because CDs that are synthesized by using diverse methods are slightly different in surface chemistry such as the various doping elements and surface charges. Thus, a comprehensive fundamental investigation on the interaction mechanism between DNA and some special CDs, particularly those with high-quenching efficiency (QE) on fluorescent labeled DNA, is necessary.
In this work, we compared the morphology and structure of two kinds of CDs with different nitrogen doping effects (nitrogen doped positive (N-CDs) and relatively low nitrogen doped CDs (R-CDs)) using GO as the reference model carbon nanomaterial. Afterwards, the affinity of DNA, DNA detection, and DNA desorption using N-CDs were observed and investigated. This study aims to enhance the basic knowledge of DNA adsorption on CDs and help further rationalize their analysis and biomedical applications. In particular, understanding the interaction mechanism of DNA and CDs is important for the design of the application of carbon dots in sensing, delivery carrier, and imaging probe.
Experimental section
Chemicals and materials
Graphene oxide (GO, catalog number 10068) was purchased from Nanjing XFNano Materials Technology Company. Dimethyl sulfoxide (DMSO), sodium dodecylsulfate (SDS), cetyltrimethyl ammonium bromide (CTAB), Tween 80, Triton X-100, adenosine, urea, NaOH, and other chemical reagents of analytical grade were purchased from Sinopharm Chemical Reagent Co., Ltd. All the reagents were used as obtained without any purification. Milli-Q water was used for all the experiments. The DNA sequences used in this work obtained from Takara Biotechnology Co., Ltd were purified through HPLC. The applied DNA sequences in this work are shown as follows (Table 1).| DNA name | Sequence and modifications (5′ to 3′) |
|---|---|
| FAM-DNA | FAM-TCCTTCATCGGTCCTGT |
| cDNA | AGGAAGTAGCCAGGACA |
| FAM-A15 | FAM-AAA AAA AAAAAAAAA |
| FAM-T15 | FAM-TTT TTT TTTTTTTTT |
| FAM-C15 | FAM-CCC CCC CCCCCCCCC |
| FAM-G15 | FAM-GGG GGG GGGGGGGGG |
Characterization
UV-2250 spectrophotometer was used for obtaining UV-Vis absorption spectra with a 1.0 cm quartz cell. Fluorescence measurements were carried out using a Cary Eclipse Fluorescence Spectrophotometer with both excitation and emission slit widths of 5.0 nm. The excitation wavelength for CDs and FAM-labeled sequences were 350 nm and 488 nm, respectively. All UV-Vis absorption and fluorescence measurements were performed at room temperature under ambient conditions. Transmission electron microscopic (TEM) images were obtained on a FEI Talos F200S. Zeta potential measurements were performed with an Anton Paar Litesizer 500 at 25 °C. Fluorescence anisotropy was measured on a spectrofluorometer FS5.Preparation of CDs
The N-CDs were synthesized in a two-step melting routine, according to our previously reported method.20,21 Correspondingly, R-CDs were synthesized via the following method. Briefly, a mixture of 0.6 g glutathione and 2.0 g citric acid monohydrate was heated to 180 °C and maintained for 1 h. Afterwards, acetone was added into the cooled melted mixture. Subsequently, the yellow precipitate was dissolved in ultrapure water. The final product solution was further dialyzed in a dialysis bag (retained molecular weight: 2000 Da) for 2 days, and the product was labeled R-CDs.DNA adsorption on carbon nanomaterials
To gain a complete and comprehensive understanding of the DNA adsorption on N-CDs, two other kinds of carbon nanomaterials in addition to N-CDs, viz., GO and R-CDs, were tested and compared with respect to the behaviour of DNA adsorption. The adsorption capacity of DNA was studied by adding different concentrations of N-CDs, R-CDs, and GO to a 200 μL solution containing 50 nM FAM-labeled DNA in PBS (10 mM, pH 7.4) at 25 °C. The fluorescence of the FAM-labeled DNA before and after the addition of each carbon nanomaterial was measured at 488 nm excitation.Ratiometric DNA sensing based on the ssDNA/N-CDs complex
The desorption of fluorescent ssDNA using the complementary sequence from N-CDs was applied as a model for the DNA sensing. A total of 50 nM FAM-labeled ssDNA was mixed with 2 μg mL−1 N-CDs in 10 mM PBS (pH 7.4). After incubating at room temperature for 10 min, different concentrations (0–3 μM) of 17 mer complementary DNA were added to the ssDNA/N-CDs complex solution. Afterwards, the mixture was further incubated at room temperature for 10 min. Two separate fluorescence spectra were measured at excitation wavelengths of 350 and 488 nm. All the calculations and standard deviations were obtained by using triple parallel detection.DNA desorption
The DNA desorption from N-CDs was investigated from special denaturants and surfactants to study the DNA anchoring force on N-CDs. A total of 4 μg mL−1 N-CDs and 8 μg mL−1 GO were respectively reacted with 100 μM DNA for 10 min to ensure complete adsorption. The control solution volume was 200 μL. The fluorescence of the reaction system was detected for 5 min. Subsequently, half of the reaction solution (100 μL) was independently dispersed in 100 μL of 5 M urea, 10 mM NaOH, 10 mM phosphate, 1 mM adenosine, 3 M NaCl, or 50% DMSO. The fluorescence intensity was immediately measured after mixing. The background fluorescence was measured by diluting the other half of the sample into 100 μL PBS. For surfactant-induced DNA desorption, sample handling was done similar to the chemical treatment. Different concentrations of SDS, Tween 80, Triton X-100, and CTAB were then added to induce desorption.Results and discussion
Characterization of the carbon nanomaterials
The morphologies, optical properties, molecular structures, and surface charges of the three kinds of carbon nanomaterials were investigated. Fig. 1 shows the transmission electron microscopic (TEM) images of N-CDs, R-CDs, and GO. The results illustrated the similarly small sphere sizes of N-CDs (Fig. 1A) and R-CDs (Fig. 1B), which were different from the large, two-dimensional structure of GO (Fig. 1C). The average diameter of N-CDs was 2.5 ± 0.5 nm with a narrow size distribution, whereas the mean size of R-CDs was 1.9 ± 0.3 nm. The UV-Vis spectra of N-CDs and R-CDs showed an evident adsorption peak at approximately 350 nm, which is ascribed to the n–π* transition of C![[double bond, length as m-dash]](https://www.rsc.org/images/entities/char_e001.gif) O. Moreover, no obvious absorption characteristic was observed for GO (Fig. 1D). The dispersion of 100 μg mL−1 N-CDs and R-CDs was light yellow, whereas the same content of GO was black (inset in Fig. 1D). Furthermore, the fluorescence test was conducted to confirm the luminescence of the applied carbon nanomaterials, as shown in Fig. S1.† The N-CDs and R-CDs exhibited specific excitation wavelength values at approximately 350 nm. The N-CDs and R-CDs exhibited maximum fluorescence emissions at approximately 420 and 430 nm, respectively, with excitation at 350 nm. Furthermore, GO showed no fluorescent properties.
O. Moreover, no obvious absorption characteristic was observed for GO (Fig. 1D). The dispersion of 100 μg mL−1 N-CDs and R-CDs was light yellow, whereas the same content of GO was black (inset in Fig. 1D). Furthermore, the fluorescence test was conducted to confirm the luminescence of the applied carbon nanomaterials, as shown in Fig. S1.† The N-CDs and R-CDs exhibited specific excitation wavelength values at approximately 350 nm. The N-CDs and R-CDs exhibited maximum fluorescence emissions at approximately 420 and 430 nm, respectively, with excitation at 350 nm. Furthermore, GO showed no fluorescent properties.
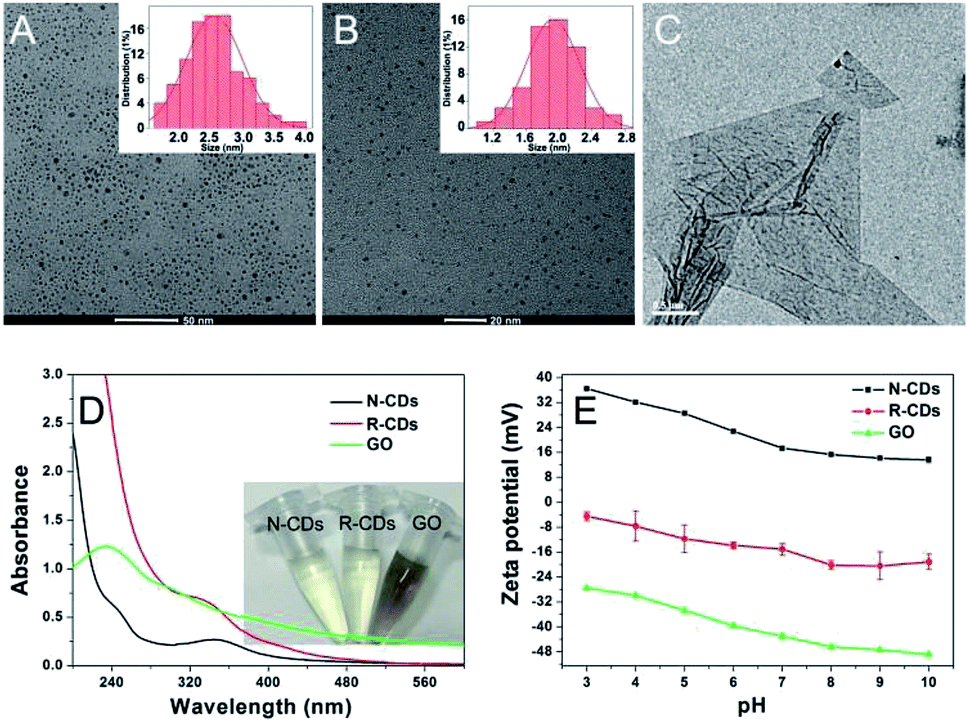 | ||
| Fig. 1 Characterization of N-CDs, R-CDs, and GO. TEM micrographs of (A) N-CDs, (B) R-CDs, and (C) GO. Inset: the diameter distribution of the CDs measured by TEM. (D) UV-Vis spectra of N-CDs (40 μg mL−1), R-CDs (40 μg mL−1), and GO (40 μg mL−1) dispersed in water. Inset: a photograph of these materials (100 μg mL−1). (E) Zeta potential of each material (0.1 mg mL−1) as a function of pH from 3 to 10. | ||
As shown in Fig. S2,† the FTIR spectrum of N-CDs revealed that the adsorption peaks at 3278 and 1560 cm−1 were assigned to the N–H stretching and N–H bending vibrations, suggesting the presence of –NH2 on the surface of N-CDs.28 Moreover, the bands at 1252 and 1140 cm−1 were attributed to the C–O vibrations. Additionally, the stretching vibration absorption of C–N at 1130 and 1262 cm−1 confirmed the doping effect of N on the prepared N-CDs. The XPS spectrum shown in Fig. S3A† indicated that the content of N in N-CDs was 24.31%, thereby confirming the high doping degree of N in N-CDs. Moreover, the molecular characteristics of R-CDs and GO were also discussed for comparison. The peaks at approximately 1716 and 1590 cm−1 due to the stretching vibrations of CO and 3430 cm−1 (O–H stretching vibrations) were found to prove the presence of –COOH and –OH in R-CDs and GO. Furthermore, the band peak of C–N stretching vibration at approximately 1140 cm−1 was observed in the FTIR spectrum of R-CDs, suggesting the slight doping effect of N. The XPS result of R-CDs (Fig. S3B†) illustrated 16.69% content of N in R-CDs, which was relatively lower than that of the N-CDs. Specifically, the FTIR results suggested that the three carbon nanomaterials had a common molecular structure of carbon and oxygen covalent bond, whereas the N-CDs illustrated relatively high contents of N and –NH2.
The zeta-potentials of the three applied carbon nanomaterials were further investigated as a function of pH (Fig. 1E). From pH 3 to 10, the N-CDs were positively charged with some decreases, accompanied with increases in the pH value. The R-CDs and GO were negatively charged in the examined pH ranges. The positive charge of N-CDs may be attributed to the surface amino groups, based on the FTIR results.29 There was a lack of amino groups but a relatively high content of carboxyl groups was responsible for the negative charges of R-CDs and GO.6
DNA binding and quenching on N-CDs
The adsorption and quenching interactions between the N-CDs and fluorophore-modified ssDNA were investigated to validate the possibility of formation of DNA and N-CDs hybrid for DNA sensing. As shown in Fig. 2A, the fluorescence intensity of 50 nM FAM-DNA was significantly quenched by the introduction of 2 μg mL−1 N-CDs. Furthermore, the mixture of N-CDs and FAM-DNA only showed an emission spectrum of N-CDs under excitation at 350 nm. Although the absorption spectrum of FAM-DNA coincided with the emission spectrum of N-CDs to some extent, the area of the overlapping part between 450 and 530 nm is only a small fraction of the area of the N-CDs, which implied that the presence of FAM-DNA was unable to influence the fluorescent property of N-CDs. Thus, almost no FRET behavior was observed using the emission of N-CDs as the excitation source for FAM-DNA (Fig. 2B). The QE of N-CDs to FAM-DNA was calculated to be 93%. These results indicated that N-CDs can be applied as an effective carrier to quench FAM-DNA. The fluorescence anisotropy value (r) was tested and calculated by the formula in the ESI.† Fig. 2C showed that the fluorescence anisotropy of the free FAM-DNA was 0.04, whereas that of N-CDs/FAM-DNA was 0.16. The evidently increased values of the fluorescence anisotropy of N-CDs/FAM-DNA over free DNA suggested the adsorption and anchoring of FAM-DNA on the N-CDs. Furthermore, the TEM image (Fig. 2D) illustrated that the introduction of DNA induced the accumulation of N-CDs (circled portions) in the mixture of N-CDs and FAM-DNA, which was particularly different from the uniform dispersion of pure N-CDs, as shown in Fig. 1A. The aggregate of N-CDs, according to the introduction of DNA, may be due to the interaction force between FAM-DNA and N-CDs. The above-mentioned results suggested the capacity of N-CDs for adsorption and quenching of DNA.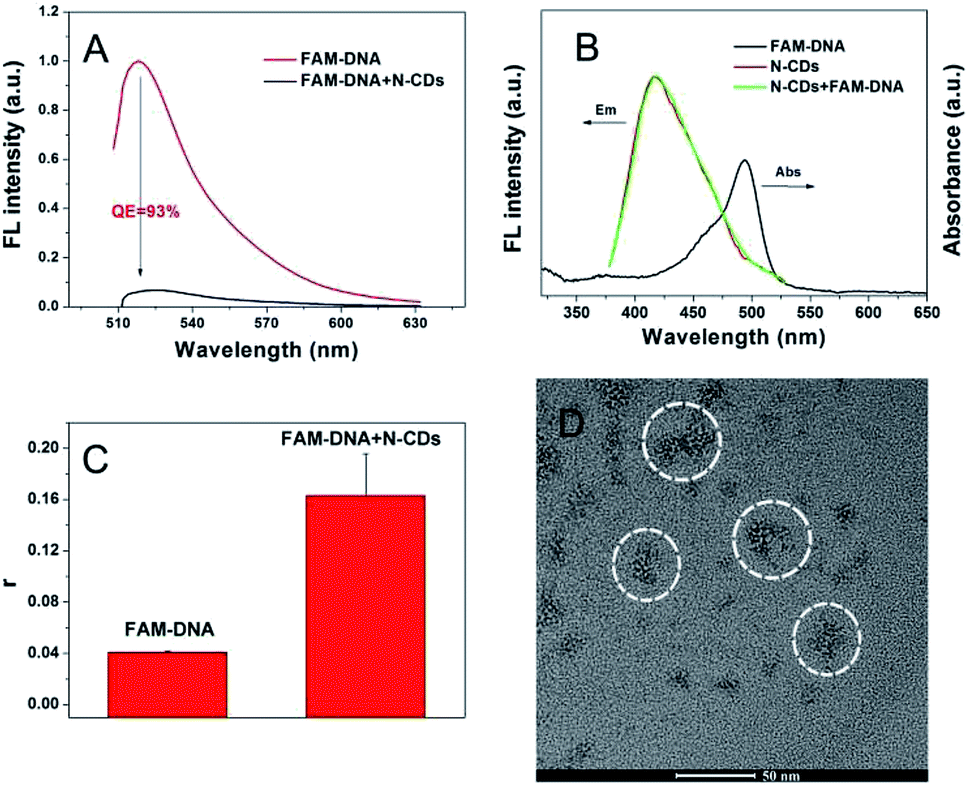 | ||
| Fig. 2 (A) Fluorescent emission spectra of 50 nM FAM-DNA without and with the presence of 2 μg mL−1 N-CDs in 10 mM PBS (pH 7.4) in total 200 μL volume. (B) UV-Vis spectrum of FAM-DNA and fluorescence emission spectra of free N-CDs and ssDNA/N-CDs mixture excited at 350 nm. (C) Fluorescence anisotropy of 50 nM FAM-DNA with or without N-CDs. (D) TEM image of the mixture of N-CDs and FAM-DNA. | ||
The influential factors for the adsorption behavior and quenching process of N-CDs to DNA were further investigated. The quenching ratio as a function of time illustrated that FAM-DNA can be immediately quenched by N-CDs, as shown by the quenching process of GO towards FAM-DNA (Fig. S4†). Moreover, the QE of N-CDs on different DNA sequences suggested that the adsorption capacity of N-CDs for various DNA sequences could be expressed as A > T = C > G (Fig. S5†). Thus, N-CDs are effective and simple carriers for DNA for the further development of biosensing applications based on DNA-functionalized carbon nanomaterials.
Furthermore, the induced quenching processes shown by different kinds of carbon nanomaterials were conducted, as shown in Fig. 3A. The fluorescence quenching as a function of carbon nanomaterial concentrations was monitored by fixing the DNA and buffer contents. For N-CDs and GO, high concentrations of the two carbon nanomaterials induced pronounced fluorescence quenching of DNA. A fast and quasi-linear fluorescence quenching was observed for GO and N-CDs at low concentration of the carbon nanomaterials. A total of 4 μg mL−1 of GO almost completely adsorbed and achieved a QE of higher than 95%. Moreover, 2 μg mL−1 of N-CDs were required for the almost full adsorption and quenching, and achieved approximately 93% QE, which was slightly lower than that of GO. Contrastingly, the ability of the fluorescence-labeled DNA adsorption and quenching by R-CDs was weak. A total of 5 μg mL−1 R-CDs only caused an 8% decrease in the DNA fluorescence. The further increase in R-CDs to 100 μg mL−1 mainly quenched the DNA fluorescence at approximately 13.5%. This condition suggested that different CDs with variable compositions or surface properties such as the N-CDs and R-CDs in this study, can quench the fluorescence modified DNA to different degrees.
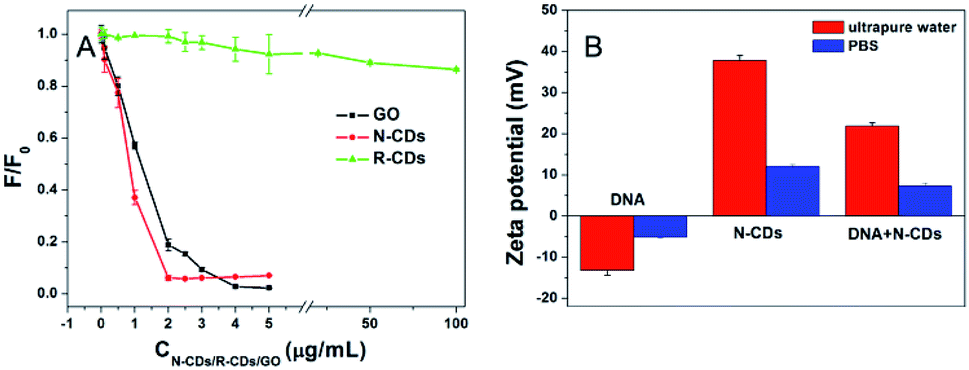 | ||
| Fig. 3 (A) Relative fluorescence quenching as a function of the concentrations of the three applied carbon nanomaterials. The initial slope indicates the relative adsorption capacity. (B) Zeta potential histogram of DNA, N-CDs, and the mixture of N-CDs and DNA in ultrapure water and 10 mM PBS (pH 7.4). | ||
In general, GO has a huge geometric surface area and adsorption capacity for DNA.6 Basically, GO has high adsorption affinity for DNA through the formation of π–π stacking and hydrogen bonding. The above-mentioned characters of N-CDs and R-CDs were similar in morphology, size, and main element, whereas the surface charge and doping degree of nitrogen were different. The quenching behavior of the CDs should appear simultaneously if the interaction between DNA and the other two CDs (R-CDs and N-CDs) was similar to the adsorption force such as in the DNA and GO system. However, it was not. The different adsorption affinities and abilities of N-CDs and R-CDs might account for the different DNA quenching behaviors. Furthermore, the quenching force between the N-CDs and DNA was different from the interaction model of GO and DNA.
Electrostatic interactions may exist in the adsorption behavior of DNA and N-CDs, given that the DNA has a negative charge. Therefore, the zeta potentials of the adsorption system were measured, as shown in Fig. 3B. Zeta potential of DNA were all negative in water and 10 mM PBS (pH 7.4), proving the negative nature of DNA. In ultrapure water, the zeta potential of N-CDs was 32.7 mV due to its positively charged amino groups on the surface, whereas that of DNA was −13.3 mV. The zeta potential for the mixture of N-CDs and DNA was measured to be 21.8 mV. Furthermore, a phenomenon similar to the change rule of the zeta potential for the combination of N-CDs and DNA was found in 10 mM PBS, which indicated the presence of electrostatic interactions between N-CDs and DNA. In addition, N-CDs were able to neutralize the potential of DNA and the charge conversion of DNA in ssDNA/N-CDs mixture was observed. As shown in Fig. S6,† the zeta potential of ssDNA/N-CDs mixture turned from negative to positive with the increased concentrations of N-CDs, when the content of DNA was fixed. When 50 μg mL−1 N-CDs was added, the zeta potential was 7.3 mV, and when the concentration of N-CDs was increased to 100 μg mL−1, the zeta potential increased to 9.9 mV. This charge transfer may be due to the DNA condensation and compression caused by N-CDs binding to nucleic acids30 and is driven by electrostatic interactions. These results suggested that there was electrostatic interaction between N-CDs and DNA.
The quenching system of a fluorescent probe DNA by GO is a typical and well-known platform for DNA detection.31–33 The DNA detection based on the quenching platform of FAM-DNA and N-CDs was investigated by considering the quenching process of DNA by N-CDs. As shown in the detection scheme in Fig. 4, the FAM-labeled random sequence was adsorbed and quenched by N-CDs. Subsequently, different concentrations of complementary DNA (cDNA) were added. Additionally, the fluorescence intensity from the FAM of the reaction solution increased as the DNA concentration increased (Fig. S7A†), suggesting the sensing potential. This result could be attributed to the formation of dsDNA by FAM-DNA, with its complementary sequence desorbing the N-CDs surface for fluorescence recovery (Fig. 4). The concentration of complementary DNA can be quantified by the ratiometric method using the values of FFAM/FN-CDs on the basis of the stable and distinguishable emission of N-CDs, as shown in Fig. S7A.† A linear relationship between the FFAM/FN-CDs and the concentration of cDNA in the range of 0.1–3 μM was observed. The management of the signal of the analytical methods through the ratiometric routine helps to eliminate the possible environment disturbance and improve the stability of the sensing performance.20,34 Thus, the application and exhibition of the ratiometric strategy based on the system of fluorescence quenching probe labeled DNA and N-CDs are the main advantages for such analytical methods. GO quenching fluorescent probe also established a sensing platform to detect DNA but its detection performance with relatively low response (Fig. S7B†) was somewhat poor than the detecting response using N-CDs (Fig. S7A†). Hence, DNA detection can be realized using the quenching platform of FAM-DNA and N-CDs. However, a problem arose spontaneously. The above-mentioned results suggested that the electrostatic interaction for the binding and quenching of N-CDs to FAM-DNA was due to the negative nature of DNA and the positive charge of N-CDs. However, the dsDNA was unable to adsorb on N-CDs to quench the fluorescence through electrostatic interaction, given that dsDNA was negatively charged. This situation indicated that there was an electrostatic interaction between N-CDs and DNA in the real analytical system,20 which initiated the thought about the true interaction force between DNA and the N-CDs it is anchored on.
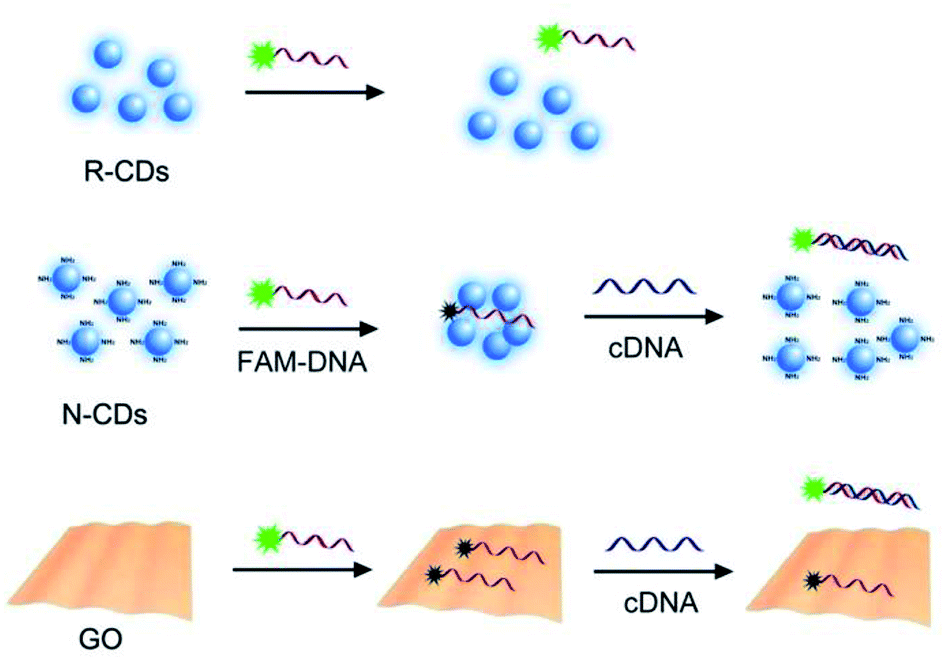 | ||
| Fig. 4 Schematics of a fluorescently-labeled DNA adsorbed by N-CDs or GO, resulting in fluorescence quenching, but no quenching occurred on R-CDs. The adsorbed DNA can be desorbed from N-CDs after cDNA addition because of DNA hybridization, resulting in fluorescence recovery. | ||
DNA desorption
The DNA desorption from some carriers using special denaturants can be used as an effective tool for investigating the interaction between DNA and the carriers.6 Herein, the fluorescence enhancement kinetics were monitored for the addition of DNA denaturants using the classical quenching model of GO and DNA as reference to investigate the DNA desorption from N-CDs. Each denaturant was employed to reveal a type of intermolecular force.9 For this purpose, the FAM-labeled DNA was pre-adsorbed onto N-CDs to prepare a low-fluorescence adsorption complex. For each sample, a free FAM-DNA fluorescence intensity in the buffer without N-CDs was used as the background for calculating the desorption degree. Additionally, the related DNA desorption behavior was not investigated in this study because of the weak adsorption ability of R-CDs to DNA.The DNA is negatively charged. Thus, we first investigated the charge interactions between the positive N-CDs and DNA by adding a high concentration of NaCl (Fig. 5A). A total of 3 M NaCl caused an almost 100% fluorescence recovery of FAM-DNA from N-CDs, thereby indicating that a strong charge effect existed due to the significant role of NaCl. Fig. S8† showed that adding PBS does not cause any fluorescence recovery, excluding the influence of ions in the PBS buffer on desorption. On the contrary, a slightly enhanced adsorption was observed for the GO and DNA system, suggesting that electrostatic attraction was unlikely to take place between DNA and GO. In this work, GO was negatively charged. Thus, no electrostatic interaction was expected to take place between DNA and GO.
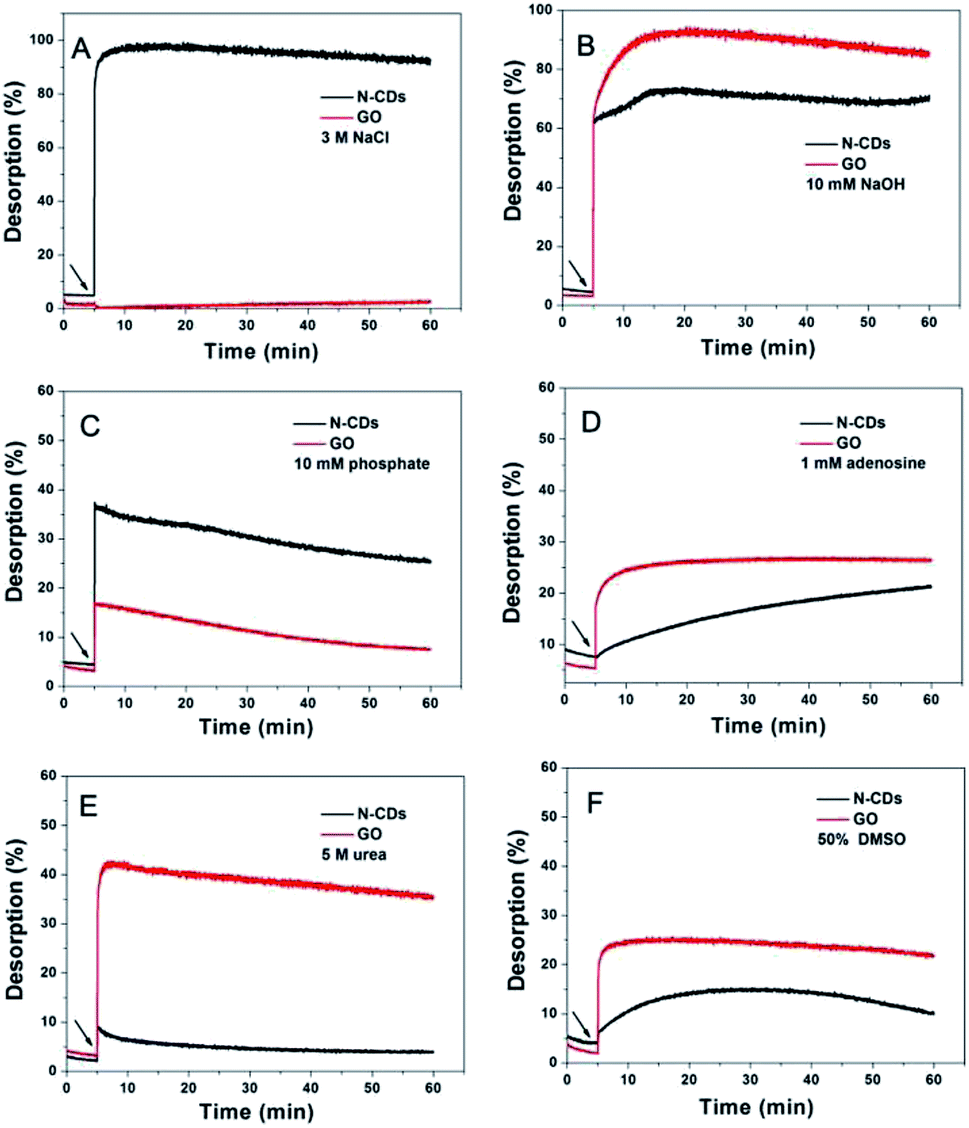 | ||
| Fig. 5 Comparison of DNA desorption from N-CDs and GO under various denaturing conditions. Kinetics of DNA desorption from N-CDs and GO after adding (A) 3 M NaCl, (B) 10 mM NaOH, (C) 10 mM phosphate, (D) 1 mM adenosine, (E) 5 M urea, and (F) 50% DMSO. The materials were added after 5 min, as indicated by the arrowhead. | ||
The pH effect of the DNA desorption was further investigated, given that the zeta-potential of N-CDs and GO could be modulated by adjusting the pH, as shown in Fig. 5B. The final 10 mM NaOH was added to each adsorption condition to increase the pH. The DNA desorption and fluorescence enhancements were observed in both the systems. Generally, at higher pH (Fig. S9†) caused by the addition of 10 mM NaOH, the positively charged N-CDs decrease the surface charge, while GO become increasingly negative. The decreased degree of charge of N-CDs would reduce the electrostatic adsorption ability of N-CDs for DNA. The augmented negative surface of GO increased the electrostatic repulsive force between negative DNA and GO and then reduced the adsorption. In comparison, the desorption degree of DNA from GO was more serious than the condition of N-CDs. This condition may be due to the sensitive interaction between DNA and negatively charged GO with the modulation of pH. Acidic pH was uninitiated due to the following two reasons. First, low pH is an unrealistic condition for real biosensing. Second, although little increment occurred in the fluorescence of pure FAM with the addition of 10 mM NaOH in PBS (Fig. S10†), FAM could evidently vary in acidic conditions due to its sensitive property in acidic pH.35
It is known that DNA is composed of nucleosides and a phosphate backbone. A total of 10 mM free inorganic phosphate or 1 mM adenosine was introduced into the sample of DNA and N-CDs to detect the possible chemical interactions caused by these two chemical groups.36 The N-CDs showed a relatively high desorption with phosphate (approximately 30%), indicating that DNA was adsorbed on N-CDs via its phosphate backbone (Fig. 5C). On the other hand, phosphate showed less than 15% desorption of DNA from GO after 60 min, which was lower than the adsorption effect on N-CDs. This result may be due to the negative phosphate backbone, which interacted with various surfaces via different actions such as electrostatic interactions. Moreover, the addition of adenosine induced an approximately 15% degree of desorption from N-CDs in a 60 min monitoring (Fig. 5D), thereby indicating the presence of hydrogen bonding or π–π stacking through the nucleobases from DNA and N-CDs in the adsorption of DNA on N-CDs.37
The interaction was low even though hydrogen bonds or π–π stacking in the adsorption of DNA on N-CDs existed. Herein, the effect of urea cleaning on the possible hydrogen bonding was further investigated.27 Thus, 5 M urea was applied (Fig. 5E). A significantly weaker desorption of DNA from N-CDs (nearly 6%) was observed over the evident release of DNA from GO (approximately 40%). This condition indicated that hydrogen bonding was related to the adsorption of DNA on N-CDs at a low degree. Combined with the result of adenosine denaturing in Fig. 5D, the hydrogen bonding may be due to the role of DNA nucleobases. This weak hydrogen bonding was due to the high content of –NH2 on the surface of N-CDs. Nitrogen is a weaker hydrogen acceptor than oxygen because of its lower electronegativity.38 DMSO was applied to dissolve the hydrophobic molecules so as to monitor the possible desorption and to study the hydrophobic interaction between DNA and N-CDs. As shown in Fig. 5F, N-CDs has approximately 10% fluorescence enhancement over the nearly 20% fluorescence enhancement with the GO condition. In this case, N-CDs exhibited the obscured hydrophobic interaction for DNA adsorption.
We further tested the effect of surfactant molecules on the desorption process of DNA from various nanomaterials to test the effect of vdW forces on adsorption. A total of four kinds of surfactants, two non-ionic macromolecular surfactant molecules (Tween 80 and Triton X-100) and two small-molecular ionic surfactants (SDS and CTAB) were applied. The four surfactants can induce DNA desorption from N-CDs (Fig. 6). Tween 80 and Triton X-100 caused more than 10% desorption to occur from N-CDs, which was a little higher or over that of GO. These results were consistent with the interaction of macromolecular surfactant molecules with N-CDs to displace DNA via their hydrophobic tails through vdW force. Tween 80 and Triton X-100 caused weak DNA desorption in the GO system, as shown in Fig. 6A and B. This phenomenon may be due to the main forces of hydrogen bonding and π–π stacking between GO and DNA that compete with the vdW force on the addition of the two surfactants. Furthermore, the SDS and CTAB showed an evident desorption effect from N-CDs but less desorption as compared to GO6 when the surfactant content was controlled. The stronger desorption of DNA from N-CDs in the presence of ionic surfactants was due to the following two reasons: first, the hydrophobic tails of the surfactants interacted with N-CDs using the vdW force to remove DNA. Secondly, the introduction of the ionic surfactant increased the salt concentration, which could weaken the electrostatic interaction between DNA and N-CDs.
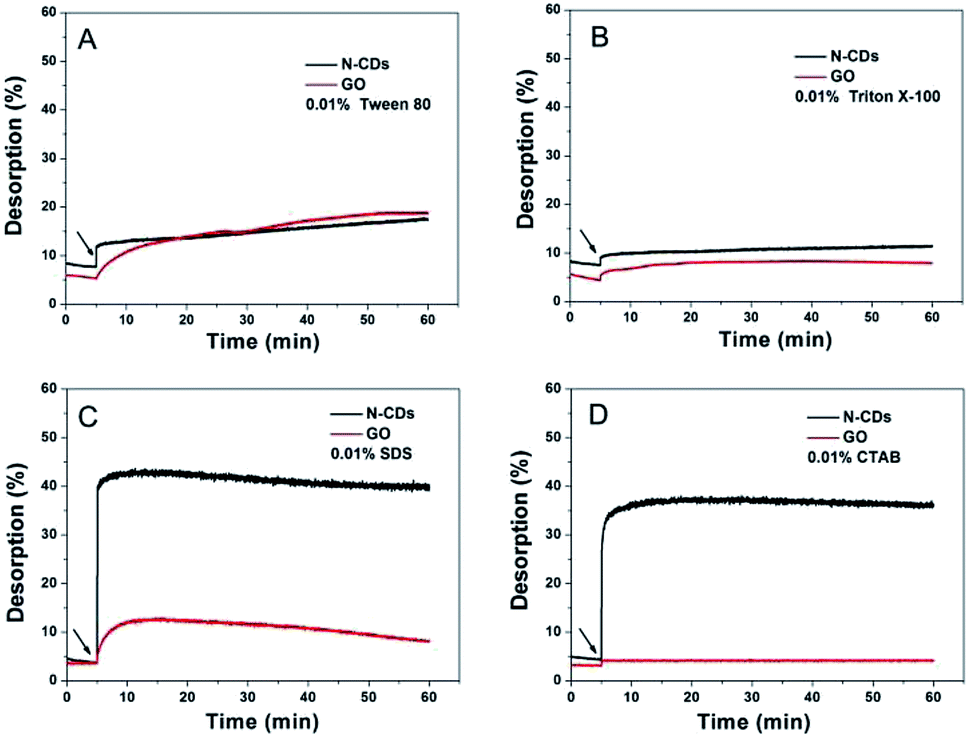 | ||
| Fig. 6 Kinetics of FAM-A15 DNA desorption from N-CDs and GO after adding 0.01% (A) Tween 80, (B) Triton X-100, (C) SDS, and (D) CTAB. The reaction buffer contains 10 mM PBS and 10 mM NaCl. The surfactants were added after 5 min, as indicated by the arrowheads. | ||
In summary, the above-mentioned results obtained from DNA desorption indicated that electrostatic attraction, the nucleobase effect (hydrogen bonding and π–π stacking), hydrophobic interaction, and vdW force were the driving forces for N-CDs to anchor DNA. According to the varied percentage of fluorescence recovery of DNA desorption from N-CDs, the interaction strength for N-CDs and DNA may obey the following order: electrostatic attraction ≫ nucleobase effect ≈ vdW > hydrophobic interactions.
Conclusions
In summary, DNA adsorption on three different carbon nanomaterials, viz., N-CDs, R-CDs, and GO were compared. Following the comparison of results of DNA adsorption, DNA sensing using ratiometric routine and DNA desorption from N-CDs was further investigated. The CDs were prepared from different routines. The surface composition and charge were the main factors for the interaction of DNA and CDs. The interaction between N-CDs and DNA could be elucidated effectively using denaturing agents. The DNA was adsorbed on the N-CDs mainly via electrostatic adsorption combined with the nucleobase effect and vdW, when the model of DNA desorption from GO was applied as the reference. The interaction between CDs and DNA is an important factor for the design of new kinds of CDs, which may be applied for the development of biosensors or in some gene delivery systems.Conflicts of interest
There are no conflicts to declare.Acknowledgements
The authors gratefully acknowledge the financial support of the National Science Foundation of China (21705021 and 21775023), the Natural Science Foundation of Fujian Province of China (2016J01767, 2017J01328), Joint Funds for the innovation of science and Technology, Fujian province (2017Y9121), Medical Innovation Project of Fujian Province of China (2016-CX-44), and the Elite Cultivation Program of Health and Family Planning of Fujian Province (2017-ZQN-61).Notes and references
- T. Premkumar and K. Geckeler, Prog. Polym. Sci., 2012, 37, 515 CrossRef CAS.
- H. S. Wang, H. L. Liu, K. Wang, Y. Ding, J. J. Xu, X. H. Xia and H. Y. Chen, Anal. Chem., 2017, 89, 11366 CrossRef CAS PubMed.
- B. W. Liu, P. Wu, Z. C. Huang, L. Z. Ma and J. W. Liu, J. Am. Chem. Soc., 2018, 140, 4499 CrossRef CAS PubMed.
- L. H. Tan, H. Xing and Y. Lu, Acc. Chem. Res., 2014, 47, 1881 CrossRef CAS PubMed.
- T. M. Sun, Y. S. Zhang, B. Pang, D. C. Hyun, M. X. Yang and Y. N. Xia, Angew. Chem., Int. Ed., 2014, 53, 12320 CAS.
- C. Lu, Y. B. Liu, Y. B. Ying and J. W. Liu, Langmuir, 2017, 33, 630 CrossRef CAS PubMed.
- H. Zhang, H. L. Zhang, A. Aldalbahi, X. L. Zuo, C. H. Fan and X. Q. Mi, Biosens. Bioelectron., 2017, 89, 96 CrossRef CAS PubMed.
- W. R. Yang, K. R. Ratinac, S. P. Ringer, P. Thordarson, J. J. Gooding and F. Braet, Angew. Chem., Int. Ed., 2010, 49, 2114 CrossRef CAS PubMed.
- C. Lu, P. J. Huang, B. W. Liu, Y. B. Ying and J. W. Liu, Langmuir, 2016, 32, 10776 CrossRef CAS PubMed.
- A. Loo, Z. Sofer, D. Bouša, P. Ulbrich, A. Bonanni and M. Pumera, ACS Appl. Mater. Interfaces, 2016, 8, 1951 CrossRef CAS PubMed.
- Y. F. Wang and A. G. Hu, J. Mater. Chem. C, 2014, 2, 6921 RSC.
- S. Y. Lim, W. Shen and Z. Q. Gao, Chem. Soc. Rev., 2015, 44, 362 RSC.
- J. F. Shangguan, D. G. He, X. X. He, K. M. Wang, F. Z. Xu, J. Q. Liu, J. L. Tang, X. Yang and J. Huang, Anal. Chem., 2016, 88, 7837 CrossRef CAS PubMed.
- Y. Shu, J. Lu, Q. X. Mao, R. S. Song, X. Y. Wang, X. W. Chen and J. H. Wang, Carbon, 2017, 114, 324 CrossRef CAS.
- Z. L. Peng, X. Han, S. H. Li, A. O. Al-Youbi, A. S. Bashammakh, M. S. El-Shahawi and R. M. Leblan, Coord. Chem. Rev., 2017, 343, 256 CrossRef CAS.
- S. S. Liang, L. Qi, R. L. Zhang, M. Jin and Z. Q. Zhang, Sens. Actuators, B, 2017, 244, 585 CrossRef CAS.
- S. Huang, L. M. Wang, F. W. Zhu, W. Su, J. R. Sheng, C. S. Huang and Q. Xiao, RSC Adv., 2015, 5, 44587 RSC.
- S. Wang, Y. J. Zhang, G. S. Pang, Y. W. Zhang and S. J. Guo, Anal. Chem., 2017, 89, 1704 CrossRef CAS PubMed.
- S. H. Qaddare and A. Salimi, Biosens. Bioelectron., 2017, 89, 773 CrossRef CAS PubMed.
- R. B. Guo, B. Chen, F. L Li, S. H. Weng, Z. F. Zheng, M. Chen, W. Wu, X. H. Lin and C. Y. Yang, Sens. Actuators, B, 2018, 264, 193 CrossRef CAS.
- J. Y. Huang, F. L. Li, R. B. Guo, Y. Y. Chen, Z. Z. Wang, C. F. Zhao, Y. J. Zheng, S. H. Weng and X. H. Lin, Microchim. Acta, 2018, 185, 260 CrossRef PubMed.
- H. F. Dong, W. H. Dai, H. X. Ju, H. T. Lu, S. Y. Wang, L. P. Xu, S. F. Zhou, Y. Zhang and X. J. Zhang, ACS Appl. Mater. Interfaces, 2015, 7, 11015 CrossRef CAS PubMed.
- M. Zhang, X. Zhao, Z. Fang, Y. Niu, J. Lou, Y. Wu, S. Zou, S. Xia, M. Sun and F. Du, RSC Adv., 2017, 7, 3369 RSC.
- H. J. Wang, X. He, T. Y. Luo, J. Zhang, Y. H. Liu and X. Q. Yu, Nanoscale, 2017, 9, 5935 RSC.
- S. Manohar, A. R. Mantz, K. E. Bancroft, C. Y. Hui, A. Jagota and D. V. Vezenov, Nano Lett., 2008, 8, 4365 CrossRef CAS PubMed.
- N. Varghese, U. Mogera, A. Govindaraj, A. Das, P. K. Maiti, A. K. Sood and C. N. R. Rao, ChemPhysChem, 2009, 10, 206 CrossRef CAS PubMed.
- J. S. Park, H. K. Na, D. H. Min and D. E. Kim, Analyst, 2013, 138, 1745 RSC.
- X. Liu, J. Liu, B. Zheng, L. Yan, J. Dai, Z. Zhuang, J. Du, Y. Guo and D. Xiao, New J. Chem., 2017, 41, 10607 RSC.
- B. Wang, Y. F. Chen, Y. Y. Wu, B. Weng, Y. S. Liu, Z. S. Lu, C. M. Li and Y. Cong, Biosens. Bioelectron., 2016, 78, 23 CrossRef CAS PubMed.
- M. López-López, P. López-Cornejo, V. I. Martín, F. J. Ostos, C. Checa-Rodríguez, R. Prados-Carvajal, J. A. Lebrón, P. Huertas and M. L. Moyá, J. Colloid Interface Sci., 2018, 521, 197 CrossRef PubMed.
- Z. S. Qian, X. Y. Shan, L. J. Chai, J. J. Ma, J. R. Chen and H. Feng, Nanoscale, 2014, 6, 5671 RSC.
- S. Q. Zhang, K. Wang, K. B. Lai, W. Shi, W. P. Jia, X. Y. Chen, T. Sun and D. M. Han, Biosens. Bioelectron., 2017, 91, 374 CrossRef CAS PubMed.
- A. Tyagi, K. L. Chu, I. H. Abidi, A. A. Cagang, Q. Zhang, N. L. C. Leung, E. Zhao, B. Z. Tang and Z. Luo, Acta Biomater., 2017, 50, 334 CrossRef CAS PubMed.
- Y. Zhuang, Q. Xu, F. J. Huang, P. C. Gao, Z. J. Zhao, X. D. Lou and F. Xia, ACS Sens., 2016, 1, 572 CrossRef CAS.
- G. L. Ke, Z. C. Zhu, W. Wang, Y. Zou, Z. Guan, S. Jia, H. M. Zhang, X. M. Wu and C. J. Yang, ACS Appl. Mater. Interfaces, 2014, 6, 15329 CrossRef CAS PubMed.
- C. D. Mol, T. Izumi, S. Mitra and J. A. Tainer, Nature, 2000, 403, 451 CrossRef CAS PubMed.
- J. Liu, Phys. Chem. Chem. Phys., 2012, 14, 10485 RSC.
- A. Fuertes, Dalton Trans., 2010, 39, 5942 RSC.
Footnote |
| † Electronic supplementary information (ESI) available: Calculated process of the fluorescence anisotropy value, fluorescent spectra of the N-CDs and R-CDs, FTIR and XPS of different carbon nanomaterials, the cDNA detection based on the quenching platform, kinetics adsorption, quenching efficiency of FAM-DNA by carbon nanomaterials, fluorescent spectra of FAM modified DNA in different condition of carbon nanomaterials and varied pH. See DOI: 10.1039/c9ra00881k |
| This journal is © The Royal Society of Chemistry 2019 |